

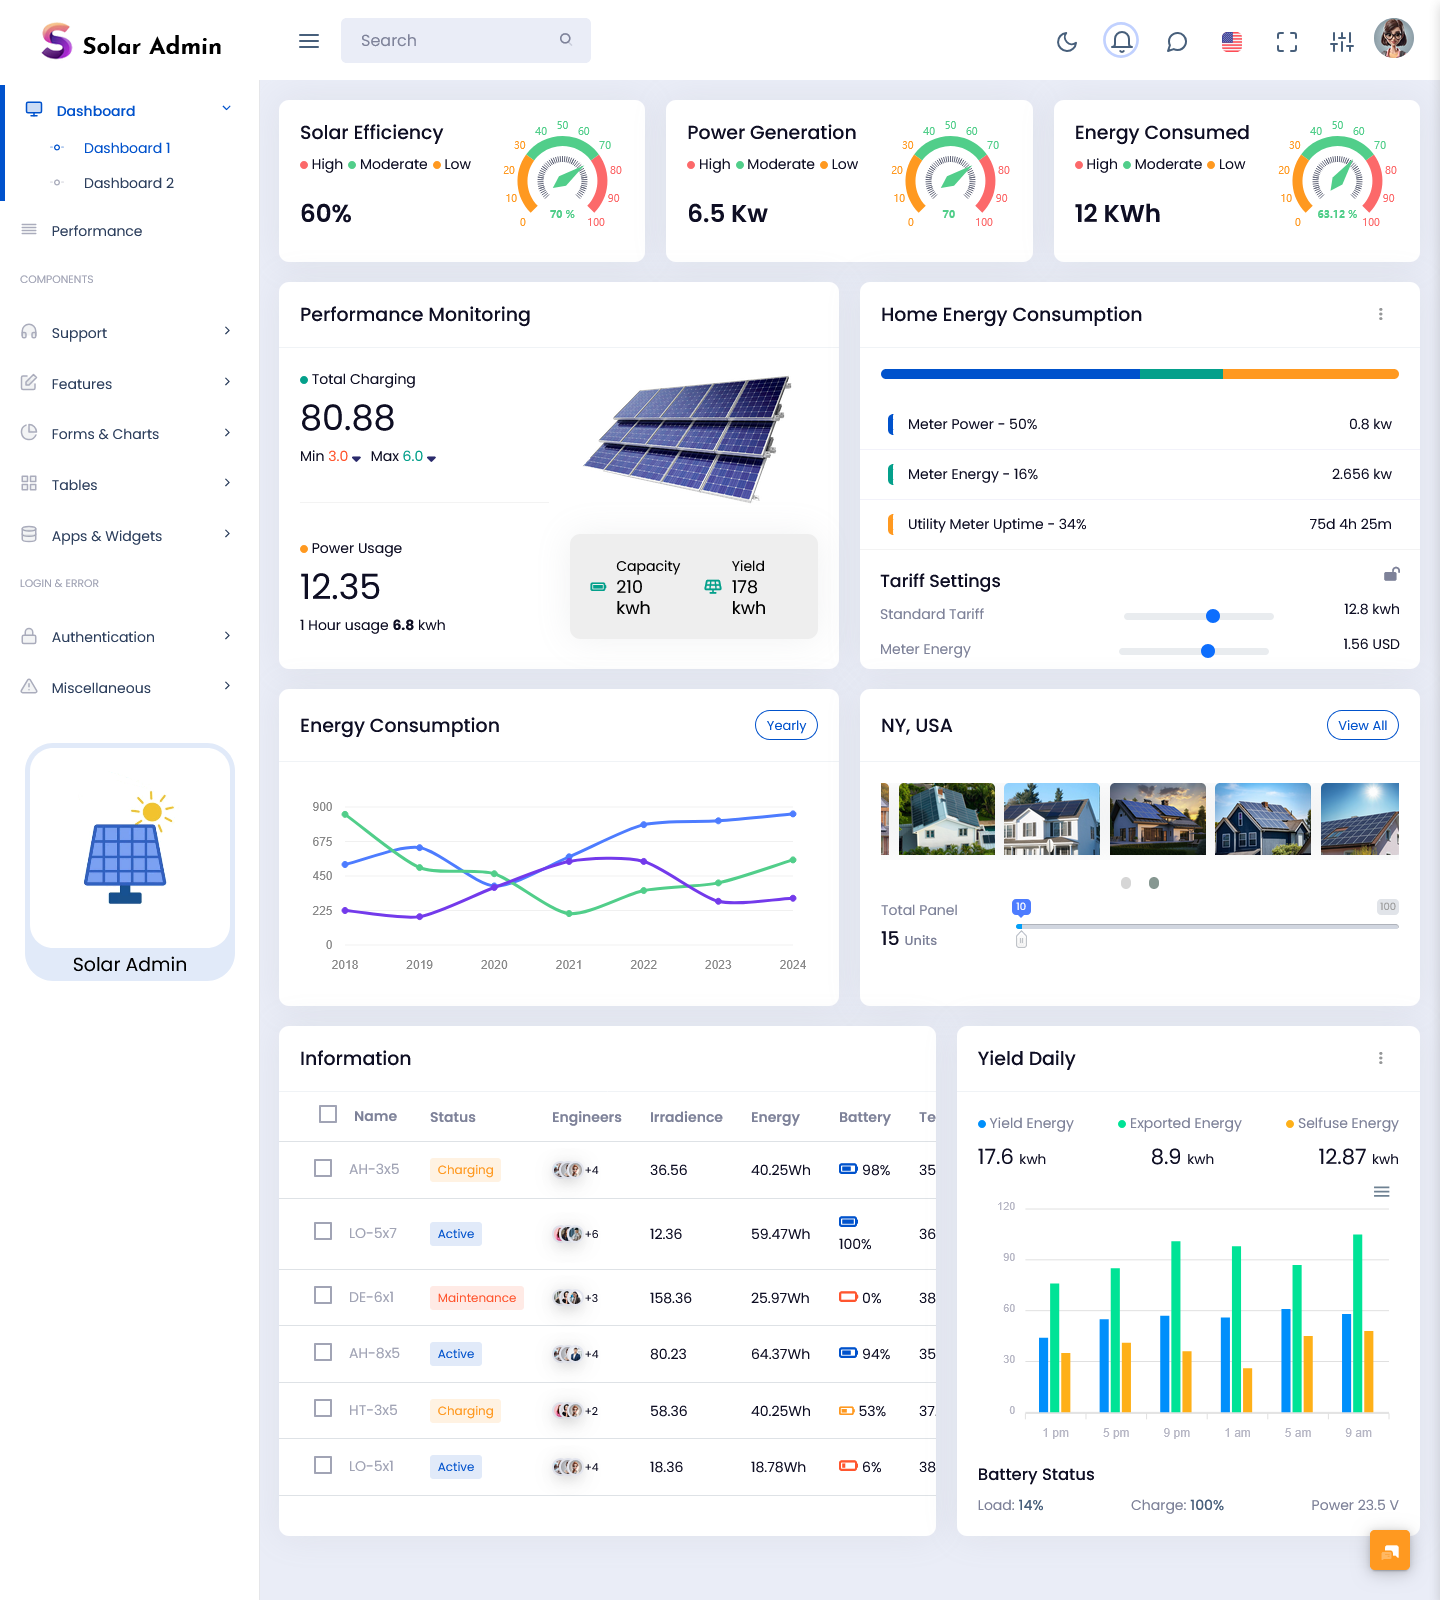
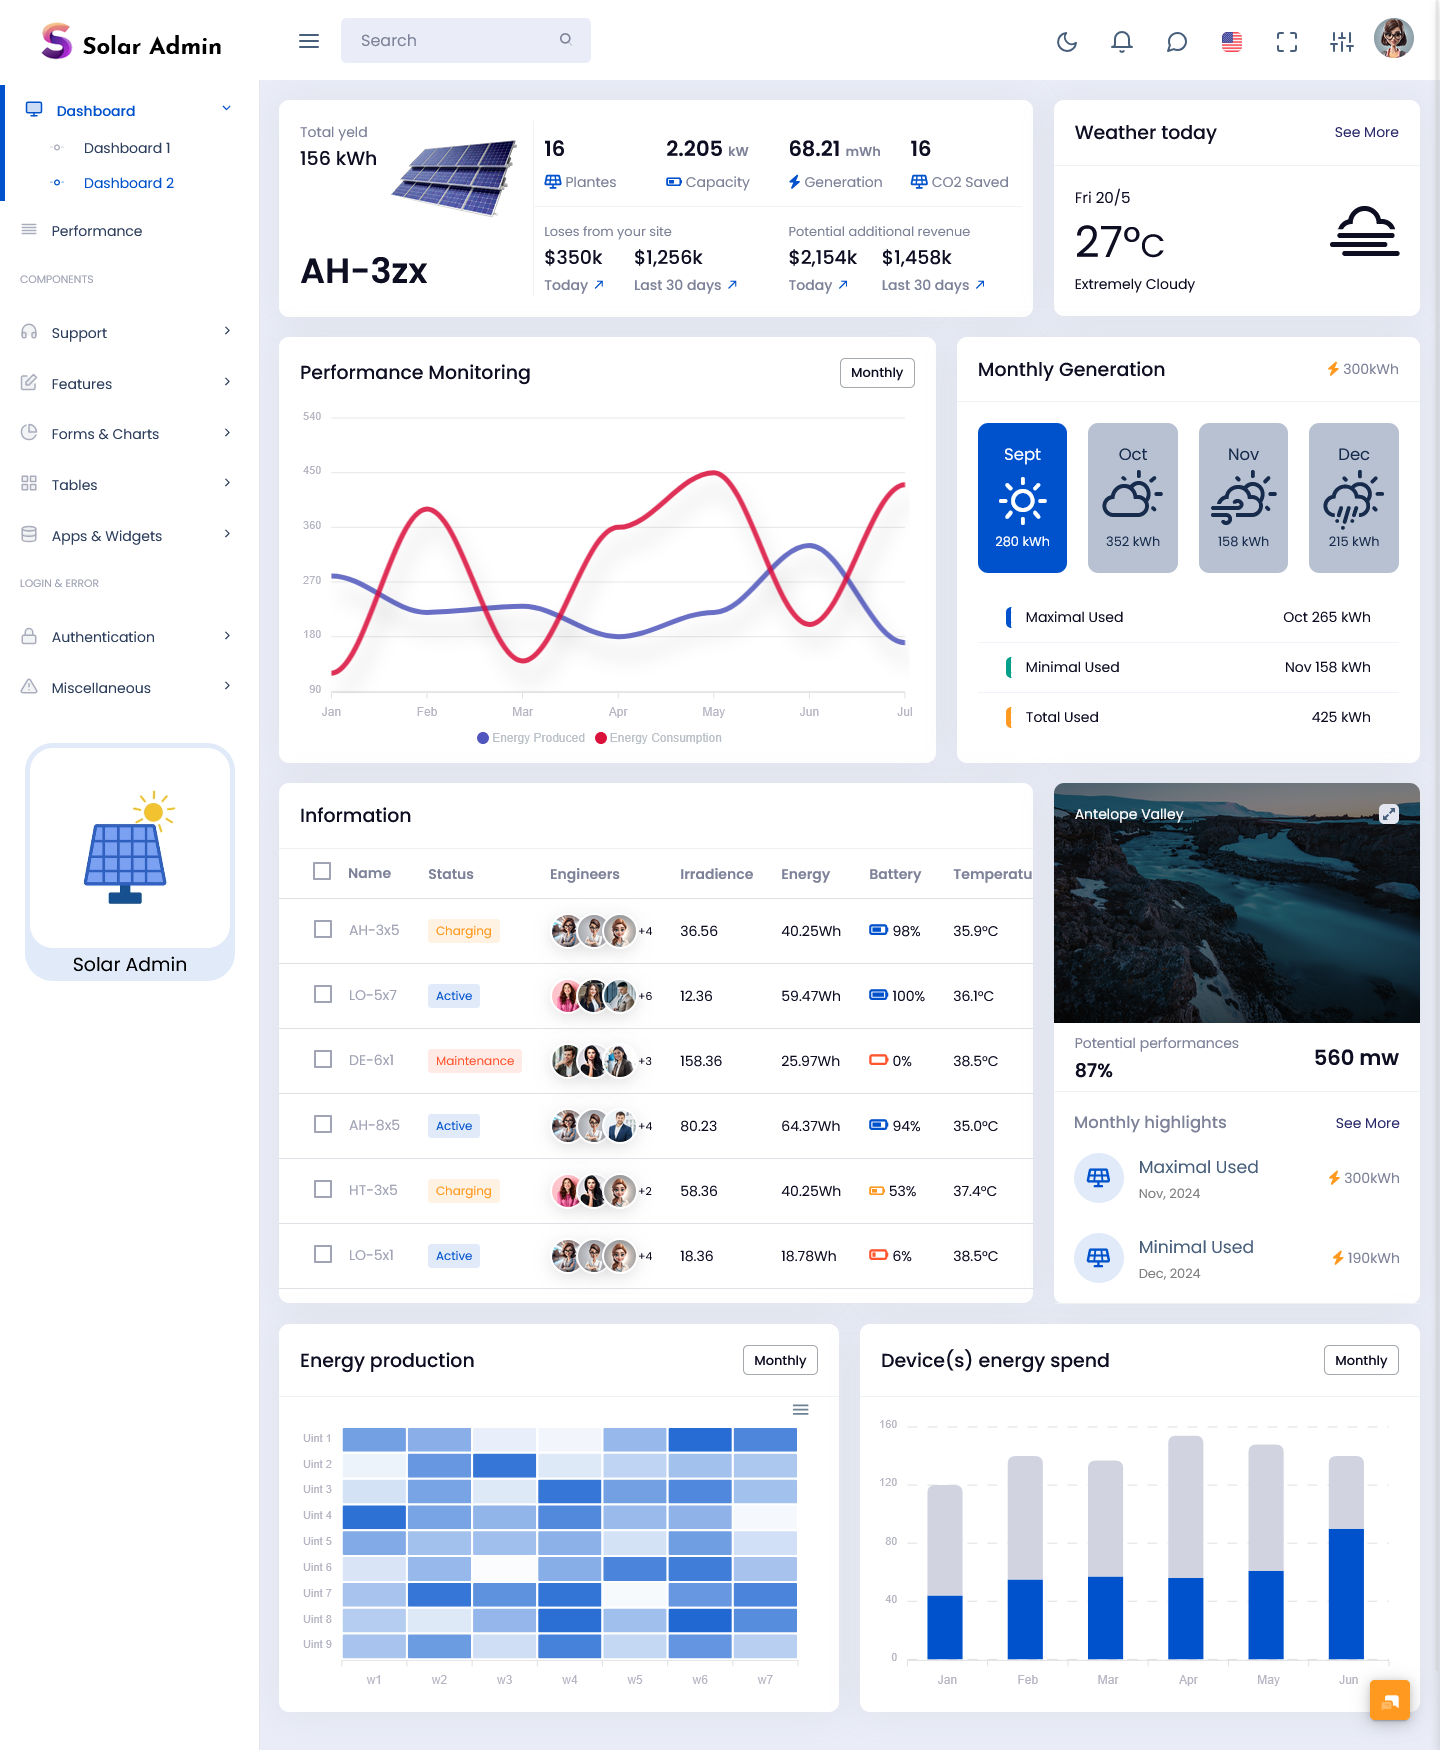
A solar dashboard provides a digital workspace where solar-related information can be organized and presented…
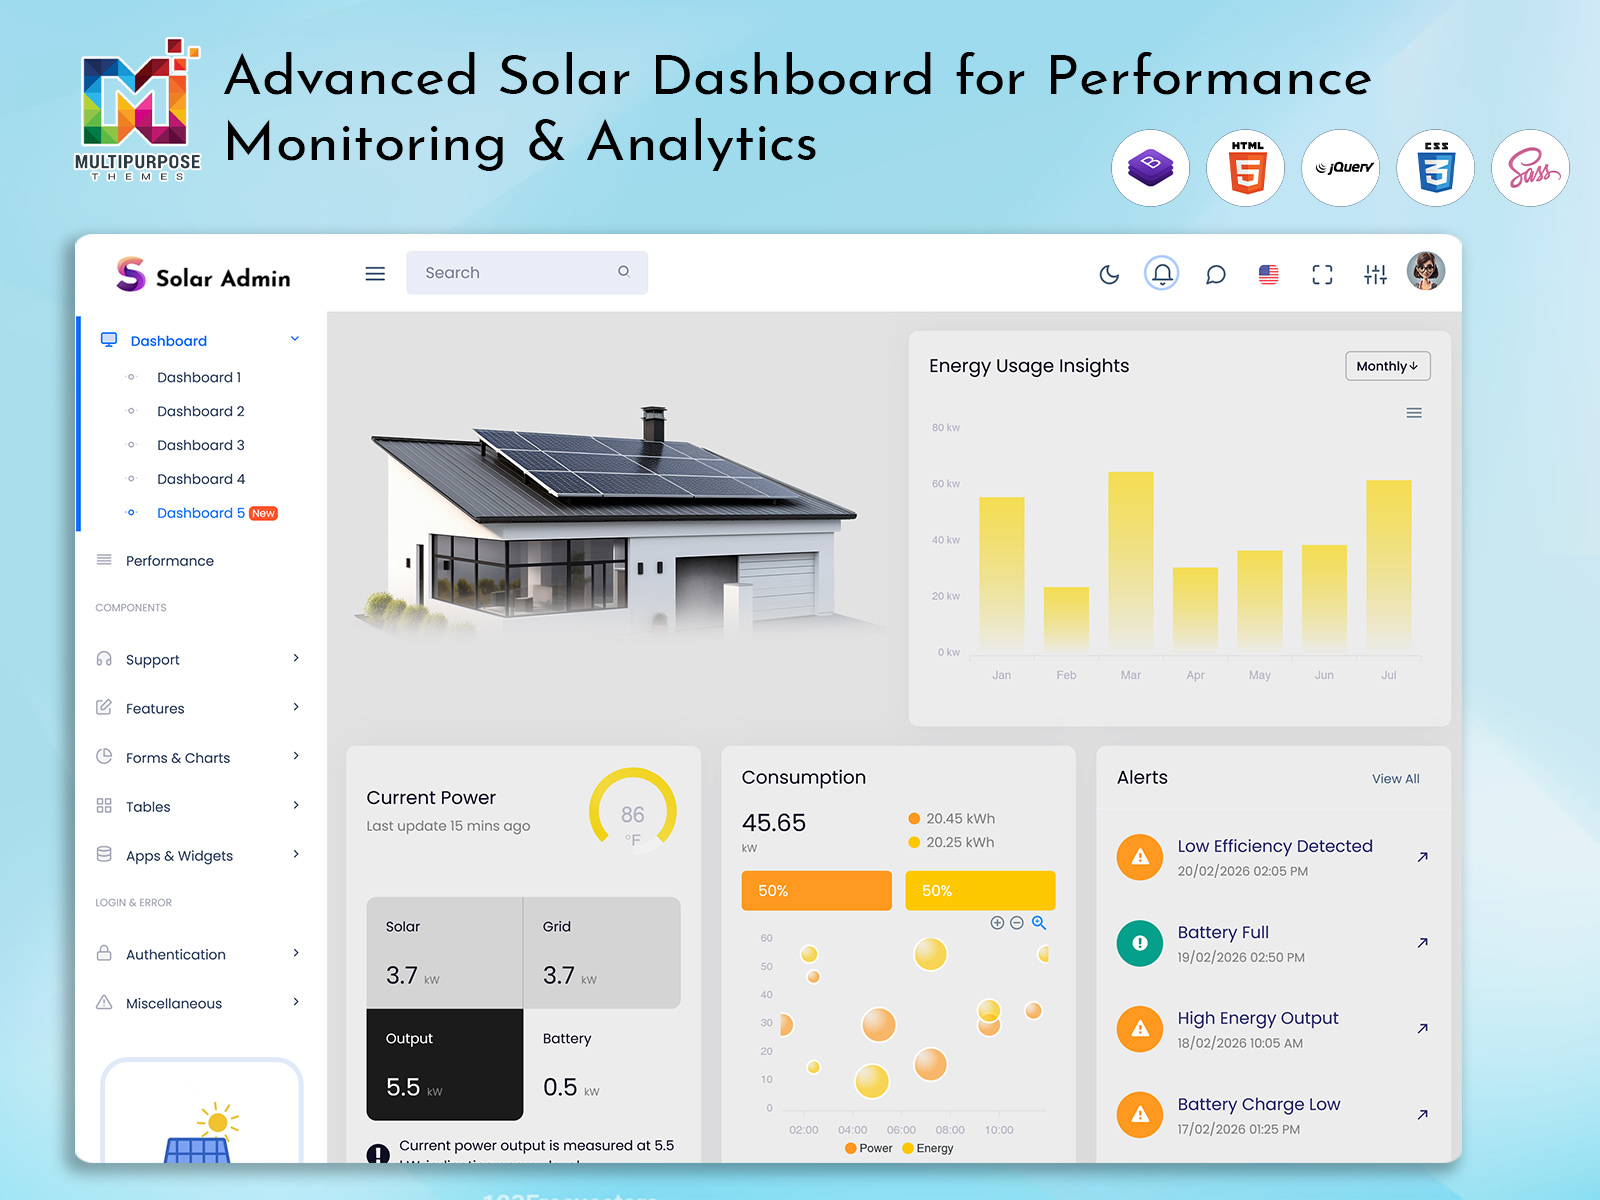
Advanced Solar Dashboard for Performance Monitoring
Reading Time: 8 minutes
Managing a solar energy system becomes more challenging when users need to track generation, consumption, equipment status, and overall performance regularly. A Solar Dashboard provides a simple way to manage all these activities from one place. It collects important information from the Solar Power System and displays it through clear reports, interactive charts, and real-time performance data. This allows homeowners, industries, and businesses to understand how their solar setup is working without depending on manual checks.
Watch Full Video
As solar installations continue to expand, proper monitoring plays an important role in maintaining better output and reducing unnecessary losses. A reliable Solar Dashboard helps users analyze energy production, identify performance changes, monitor power usage, and find possible issues before they impact the system. Whether it is a small rooftop project or a large Solar Commercial PV System, accurate insights help users make better energy management decisions.
With remote access through a Solar Web Dashboard, Solar Monitoring Mobile App, and Solar System Monitoring App, users can stay connected with their installations anytime. Custom reports, flexible layouts, and smart analytics make Solar Modern Dashboards an effective solution for improving system visibility, reducing maintenance efforts, and achieving better returns from solar investments.
Why Homeowners and Businesses Use Solar Energy Dashboards
A Solar Dashboard is designed to simplify the way energy systems are monitored and managed. Homeowners use it to understand how much electricity their solar panels generate, how much energy is consumed daily, and how much they save on electricity bills. Businesses, industries, and commercial facilities rely on the dashboard to monitor multiple installations, analyze production trends, and ensure consistent system performance.
A centralized Solar System Dashboard makes it easier to monitor every component of a solar installation without switching between multiple software applications. Users can track production, monitor equipment health, identify efficiency losses, and review historical reports from one convenient interface.
For organizations operating a Solar Commercial Pv System, the dashboard improves operational planning by providing detailed reports on energy generation, consumption, and equipment performance. Managers can compare multiple plants, identify underperforming systems, and schedule maintenance before small issues become costly repairs.
Whether accessed through a desktop Solar Web Dashboard or a Solar Monitoring Mobile App, users receive real-time updates that support faster decision-making and more efficient energy management.
Increase Solar Energy Production by Monitoring Solar Efficiency
Improving solar efficiency starts with continuous monitoring. A professional Solar Dashboard collects real-time data from every connected system and presents it through visual reports, allowing users to quickly identify performance issues and optimize energy production.
The dashboard continuously measures electricity generation, energy consumption, inverter performance, panel efficiency, and environmental conditions. If any section of the Solar Power System produces less energy than expected, users can immediately investigate the cause before production losses increase.
Using a Solar Dashboard , businesses can accurately measure generated electricity, compare production across different periods, and evaluate the overall efficiency of their solar installations. Historical reports also help identify seasonal trends, enabling better operational planning throughout the year.
The Solar System Monitoring App further enhances efficiency by sending instant notifications whenever abnormal conditions are detected. Users can receive alerts for equipment faults, reduced power generation, or unexpected performance changes, helping maintenance teams respond quickly.
By regularly monitoring Solar Panel Performance, organizations can improve energy production, reduce downtime, lower maintenance expenses, and maximize the return on every solar investment.
VIEW DEMO BUY NOW
Explore Live Solar Dashboard Demos
Choosing the right dashboard becomes much easier when you can explore live demonstrations before making a purchase. Buyers can browse multiple Solar Modern Dashboards to compare layouts, widgets, reports, charts, and interactive components. Every demo showcases a different interface designed for various business requirements and monitoring preferences.
The live demos allow users to experience how information is presented within the Solar Dashboard, including production reports, energy analytics, temperature monitoring, earnings, alerts, and performance statistics. This helps buyers understand the workflow before selecting a dashboard.
Every Solar Web Dashboard is fully customizable. Businesses can modify layouts, widgets, colors, charts, navigation menus, and reporting sections according to their operational requirements. Whether managing residential installations or a large Solar Commercial Pv System, buyers can choose the design that best matches their workflow.
Exploring multiple dashboard demos also helps organizations compare functionality and select a solution that supports future business growth while simplifying energy monitoring.
Essential Features of the Solar Energy Dashboard
1. Energy Usage Insights
Monitor electricity usage through interactive monthly and yearly charts that provide a complete and clear picture of energy consumption. The dashboard helps users compare historical trends, identify peak usage periods, and optimize energy distribution across different facilities. Detailed visual reports make it easier to improve operational efficiency while reducing unnecessary energy consumption.
2. Current Power Report
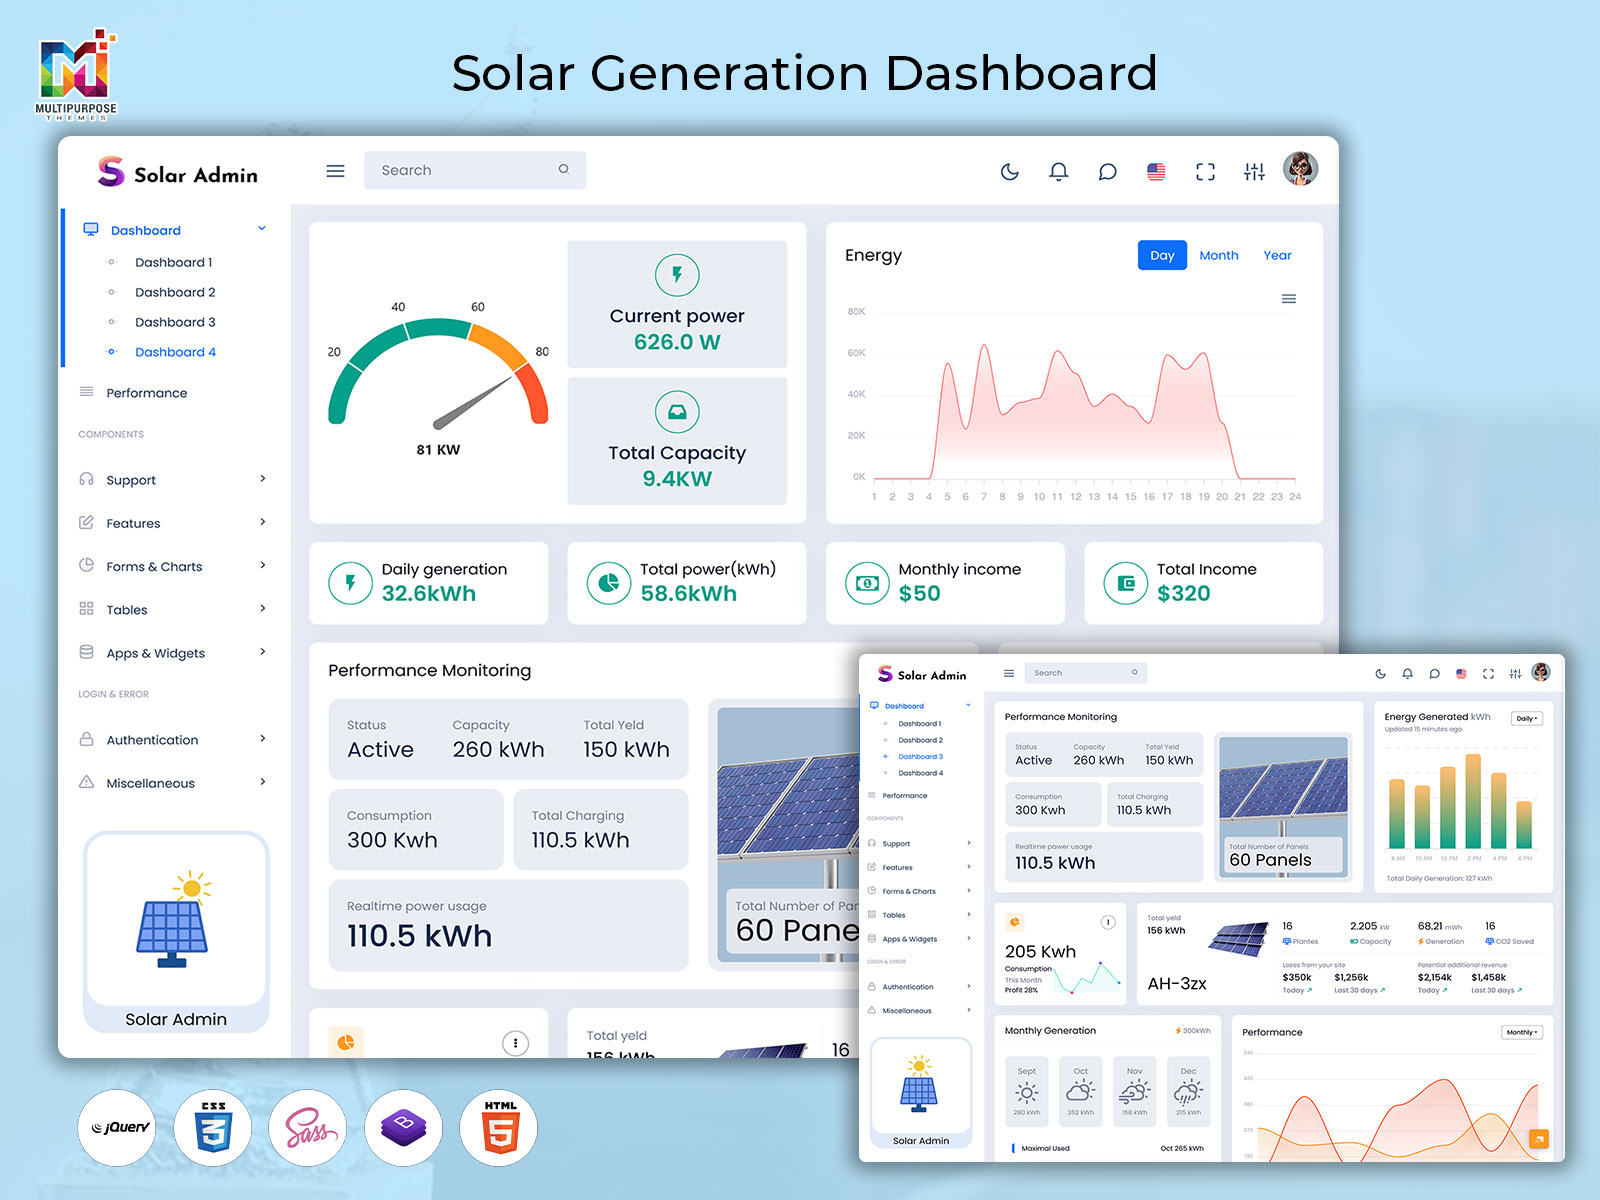
View complete real-time live information about your Solar Power System from one dashboard. Monitor current power generation, inverter status, system output, operating capacity, and live production statistics. The comprehensive report delivers accurate insights that help users understand overall system health and make informed operational decisions.
3. Smart Alerts
Receive instant notifications whenever the system detects unnecessary activity or performance changes. Alerts notify users about equipment faults , reduced production, communication failures , or maintenance requirements . Early detection helps reduce downtime and keeps the solar installation operating at maximum efficiency.
4. Energy Consumption Monitoring
Track how generated electricity is consumed across different locations, departments, or facilities. The dashboard provides detailed consumption reports that help users understand energy usage patterns , reduce wastage, and improve overall energy management. These insights support better planning and more efficient utilization of available solar power.
5. Power Energy Charts
Interactive power generation charts display daily, weekly, monthly, and yearly production trends. Visual analytics make it simple to understand and compare performance across different time periods, evaluate production efficiency, and identify opportunities to improve overall system output. These reports provide valuable information for both residential users and commercial energy managers.
6. Temperature Monitoring
Temperature plays an important role in the efficiency of every Solar Power System. The dashboard provides detailed information about panel temperature, plant temperature, installed capacity, and total energy generation. Users can compare environmental conditions with system performance to understand how temperature affects power production. This data helps identify performance losses caused by excessive heat and supports better maintenance planning. Whether managing a residential installation or a Solar Commercial PV System, temperature monitoring ensures the system operates at its highest efficiency throughout the year.
7. Performance Monitoring
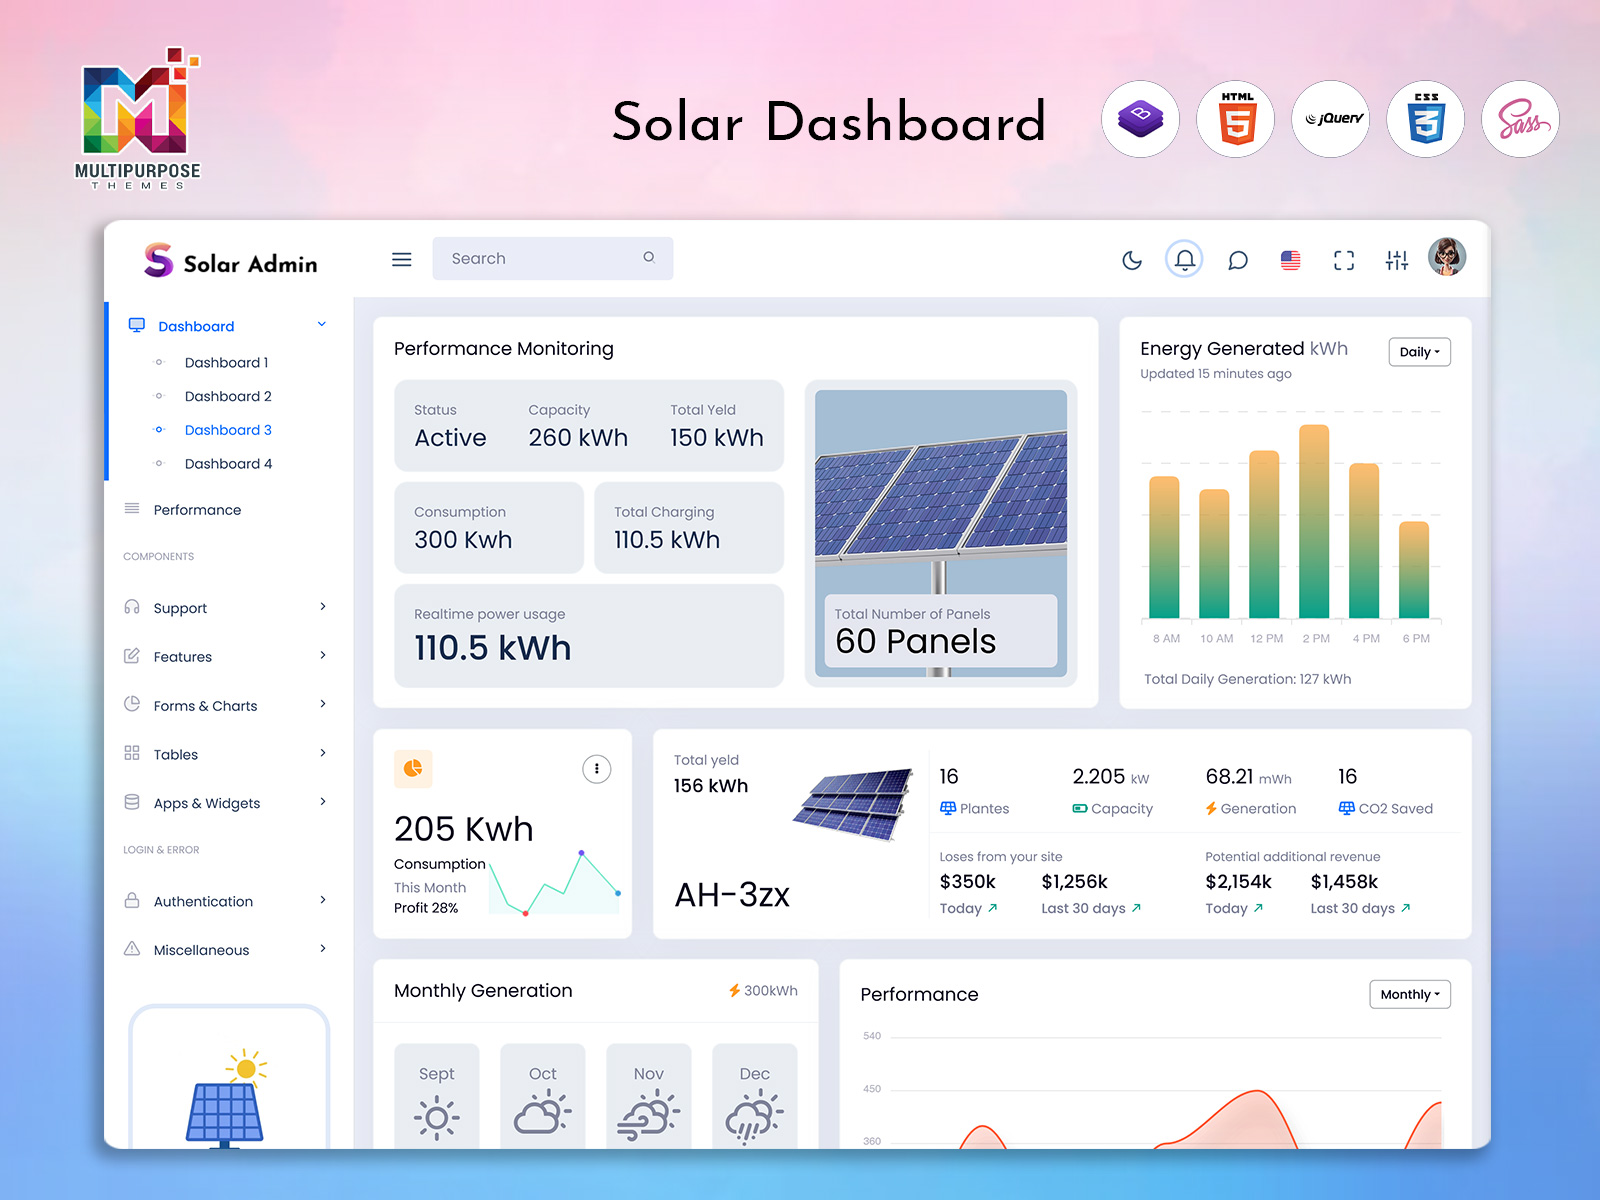
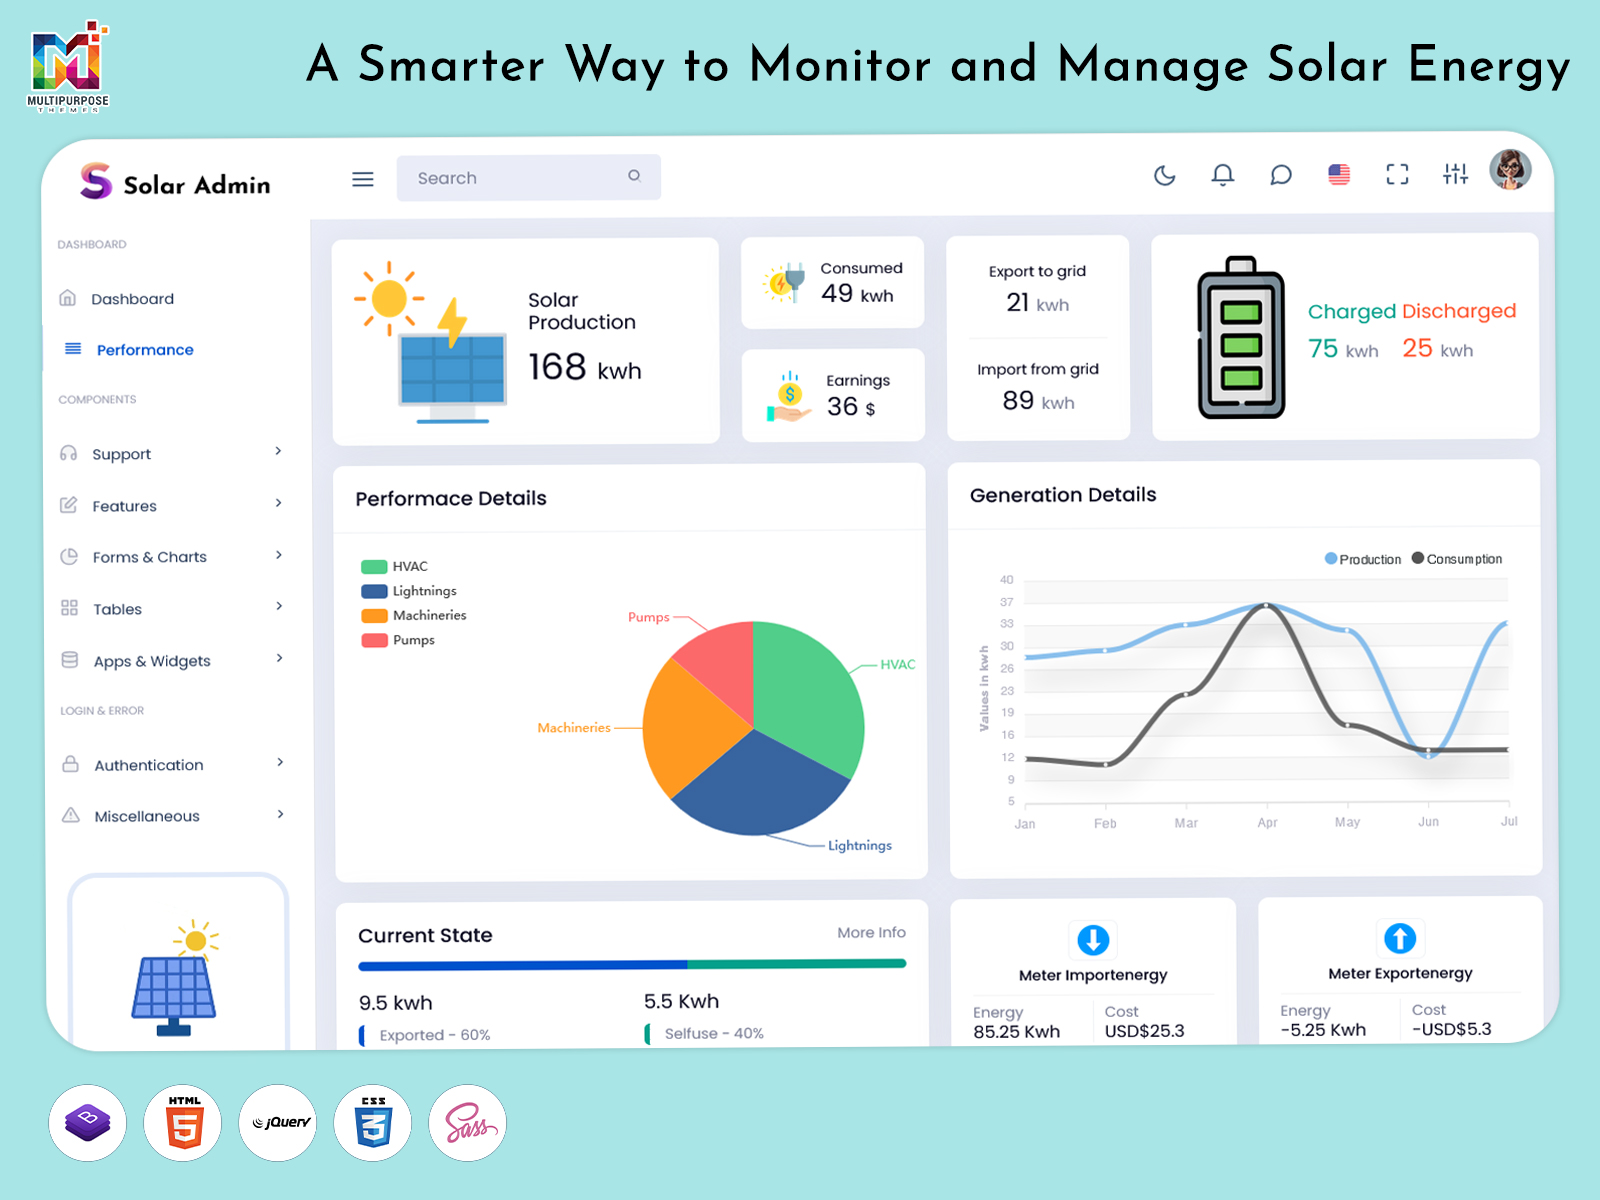
Performance monitoring gives users complete visibility into the health and productivity of their solar installations. The Solar Dashboard displays important performance indicators such as energy generation, inverter efficiency, operational status, equipment availability, and system uptime. Interactive charts and reports help users compare current performance with historical data to identify trends and improve efficiency. Businesses can use this information to schedule preventive maintenance, reduce unexpected downtime, and ensure their solar systems continue delivering maximum output.
8. All Plants Monitoring
Organizations managing multiple solar installations can monitor every plant from one centralized monitoring dashboard . Whether the plants are located in different cities, industrial facilities, or commercial buildings, users can compare performance, power generation, operational efficiency, and equipment status from a single interface. The dashboard provides real-time updates for each location, allowing managers to quickly identify underperforming plants and take corrective action. Centralized monitoring saves time, improves operational control, and simplifies the management of large-scale solar projects.
9. Earnings Overview
The earnings section helps users understand the financial benefits of their solar investment. The dashboard calculates electricity savings, estimated revenue, energy production value, and overall financial performance using easy-to-read reports and charts. Businesses operating a Solar Commercial PV System can evaluate the return on investment by comparing production with operating costs over different time periods. Financial insights make it easier to measure project success, forecast future savings, and make informed investment decisions.
10. Performance Details
Detailed performance reports provide a complete overview of every component within the Solar Power System. Users can analyze daily production, historical generation trends, equipment efficiency, operational status, maintenance history, and system availability from one location. These detailed reports help identify recurring issues, evaluate long-term performance, and improve maintenance planning. With complete visibility into every aspect of the system, users can make better operational decisions and maximize overall energy production.
11. Power Statistics
Power statistics provide a comprehensive summary of your solar installation’s overall performance. The dashboard displays total energy generated, average daily production, peak output, efficiency percentages, energy consumption, and system utilization through interactive graphs and reports. Users can compare performance across different months or years to identify growth opportunities and improve system efficiency. These statistics simplify reporting while helping businesses and homeowners monitor the long-term success of their solar energy systems.
VIEW DEMO BUY NOW
Why Choose Our Solar Modern Dashboards?
Our solar modern dashboards are designed to make solar energy management simple, reliable, and efficient. They combine impactful analysis with an easy-to-use interface so users can monitor every aspect of their solar power system without any technical issues. Whether you are a homeowner, energy consultant, or business owner, the dashboard provides complete visibility into system performance through interactive charts, real-time reports, and customizable widgets.
The platform supports desktop browsers with the help of a responsive Solar Web Dashboard and also provides remote access using a Solar Monitoring Mobile App and Solar System App. Users can monitor energy generation, review reports, receive immediate alerts, and track system performance from virtually anywhere. Every dashboard is fully customizable, allowing organizations to create layouts that match their operational requirements and reporting preferences.
The dashboard also integrates smoothly with various monitoring solutions and can complement Solar Designing Software by providing operational insights after installation. From project planning to long-term performance analysis, the platform supports every stage of solar energy management.
Smarter Solar Monitoring for Better Energy Management
Modern solar installations generate a large amount of operational information every day. A centralized Solar Dashboard transforms this information into meaningful analysis that helps users improve effectiveness, reduce operational costs, and maximize energy production. Instead of relying on manual reports, businesses and homeowners can monitor real-time system performance through visual analytics and automated reporting.
Using a Solar Charging Dashboard, organizations can inspect the performance of charging, the flow of energy, battery status, and overall system utilization in one place. Combined with a Solar Meter Dashboard, users gain a complete understanding of energy production, consumption, and distribution across their facilities.
The dashboard also improves collaboration between maintenance teams and energy managers by providing accurate performance reports, instant notifications, and historical analytics. Whether you manage a single rooftop installation or multiple utility-scale projects, centralized monitoring helps reduce downtime and improve operational efficiency.
Conclusion
A modern solar dashboard is more than a reporting tool-it is a complete energy management solution for commercial, residential, and industrial solar installations. It provides real-time visibility into energy generation, consumption, financial performance, and solar panel performance, helping users make smarter operational decisions every day.With features such as live monitoring, performance analytics, multi-plant management, earnings reports, and interactive charts, businesses can optimize their Solar Power System while reducing maintenance costs and improving productivity. Responsive access through a Solar Web Dashboard, Solar Monitoring Mobile App, and Solar System Monitoring App ensures users can monitor their systems from anywhere.
Explore different solar generation dashboards , compare their features and charts, customize the interface to match your workflow and requirements , then choose the solution that best supports your energy management goals.
FAQs
1. What is a Solar Dashboard, and why is it important for businesses?
A MultiPurpose Themes Solar Dashboard is a centralized platform that shows real-time information about energy generation, power consumption, equipment performance, and overall system efficiency in one place. It helps businesses monitor their Solar Power System, reduce operational costs, identify performance issues quickly, and make informed decisions using accurate energy data.
2. Is a Solar Dashboard easy to use?
Yes, MultiPurpose Themes modern solar dashboards are designed with user-friendly interfaces, interactive charts, and easy-to-understand reports. Users can monitor production, review analytics, and generate reports without any requirement for advanced technical knowledge, making the dashboard suitable for both beginners and experienced professionals.
3. Does it really help improve energy management?
Absolutely. A MultiPurpose Themes Monitoring Dashboard offers continuous insights into energy generation, consumption, equipment performance, and operational efficiency. Real-time monitoring helps users detect issues early, optimize energy usage, schedule maintenance proactively, and improve the overall management of their solar installations.
4. Does the dashboard work on all devices?
Yes. MultiPurpose Themes Themes dashboard is fully responsive and works smoothly on all devices like desktops, laptops, tablets, and smartphones. Users can access the Solar Web Dashboard, Solar Monitoring Mobile App, or Solar System Monitoring App to monitor system performance from virtually anywhere with an internet connection.
5. Is it possible to track Solar Panel Performance using the dashboard?
Yes. MultiPurpose Themes dashboard continuously monitors the performance of solar panels , power generation, system efficiency, equipment status, and historical production data. Users can identify underperforming panels, compare production trends, and improve maintenance planning , which can help maximize overall system efficiency.
6. Are Solar Generation Dashboards useful for both residential and commercial projects?
Yes. MultiPurpose Themes Solar Generation Dashboards are suitable for homeowners, commercial buildings, industries, educational institutions, and utility-scale solar plants. Whether managing a single residential installation or a large Solar Commercial PV System, both can be handled through one single dashboard. The dashboard provides valuable analytics that improve energy production, operational efficiency, and long-term system performance.

Related Posts

This Post Has 0 Comments