

Businesses create information throughout their activities. Customer interactions orders, website visits, marketing campaigns, financial transactions,…
Analytics Dashboard: Track Orders, Sales, Revenue and Users Easily
Reading Time: 5 minutes
Introduction
Every day information comes into the business. An analytics dashboard shows all the data. This tool helps find patterns and trends. I have found that when I look at patterns and trends patterns and trends show what works and what must change. The tool makes it easier to understand information.
Watch Full Video
Every day information comes into the business. An analytics dashboard shows all the data. This tool helps find patterns and trends. I have found that when I look at patterns and trends patterns and trends show what works and what must change. The tool makes it easier to understand information.
Using charts, tables and reports can be helpful to make decisions. The order tracking dashboard, sales dashboard, revenue reporting dashboard and user management dashboard can all help the company.
Analytics Dashboard
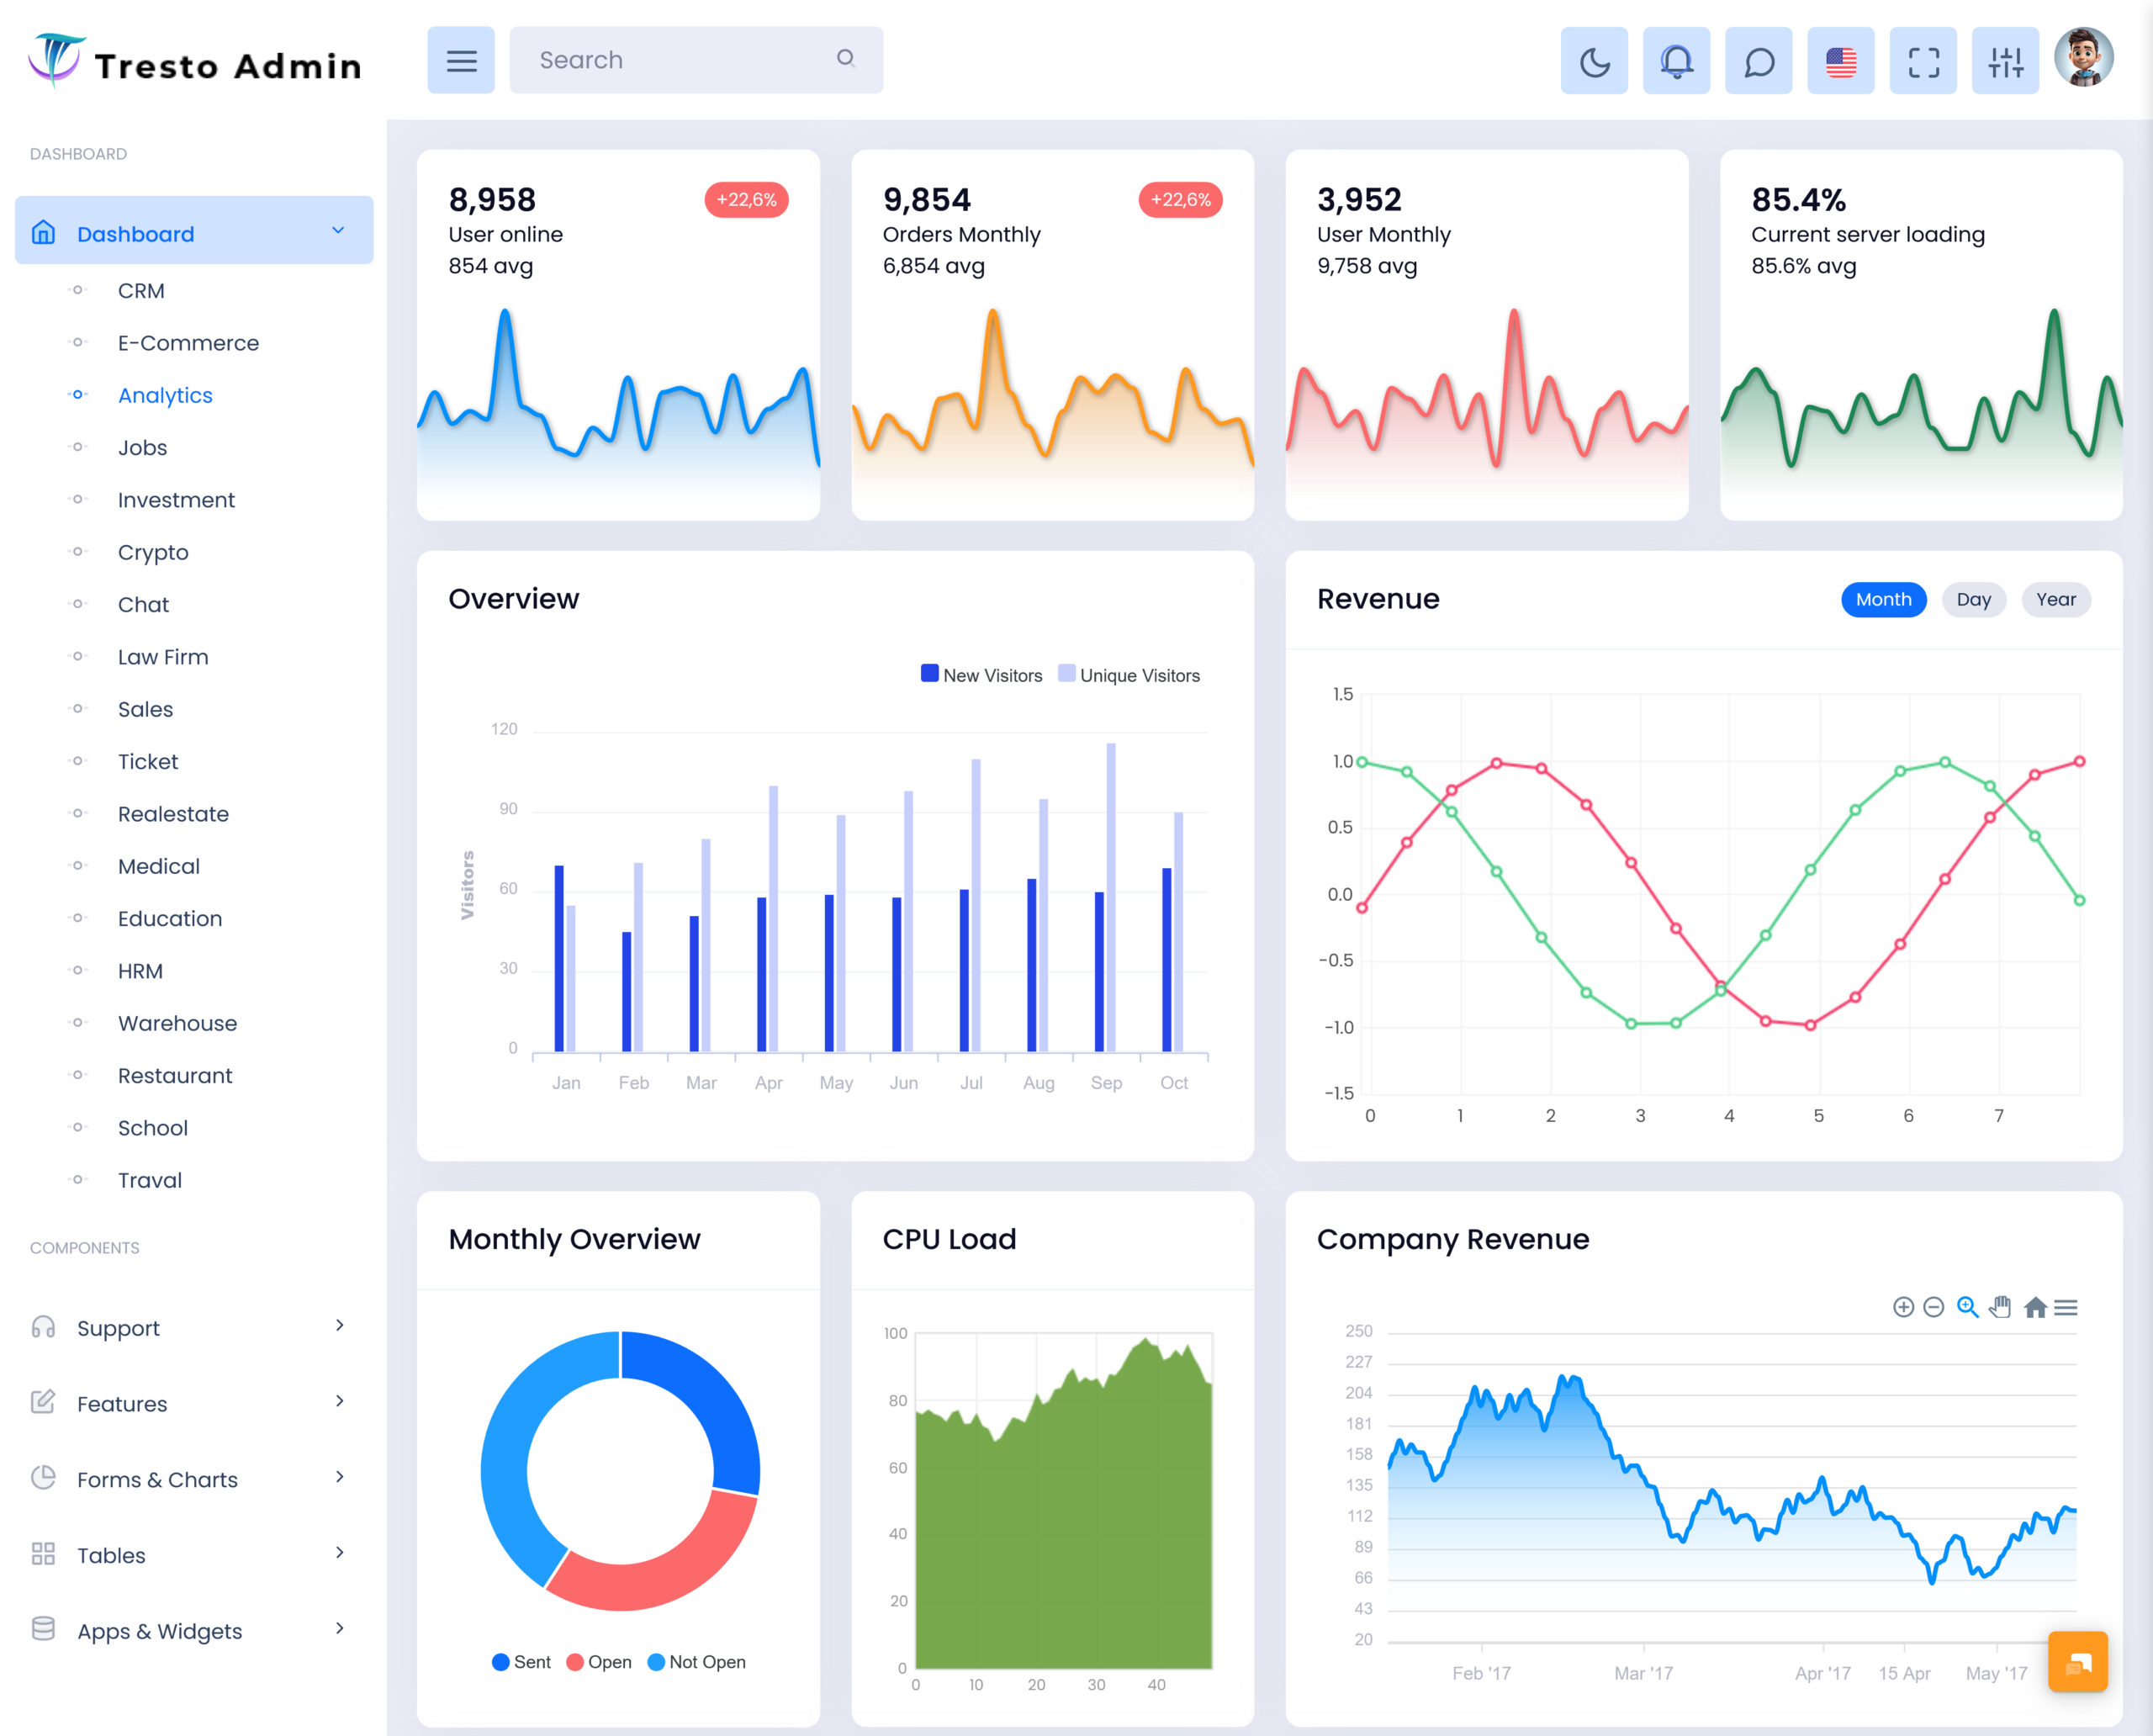
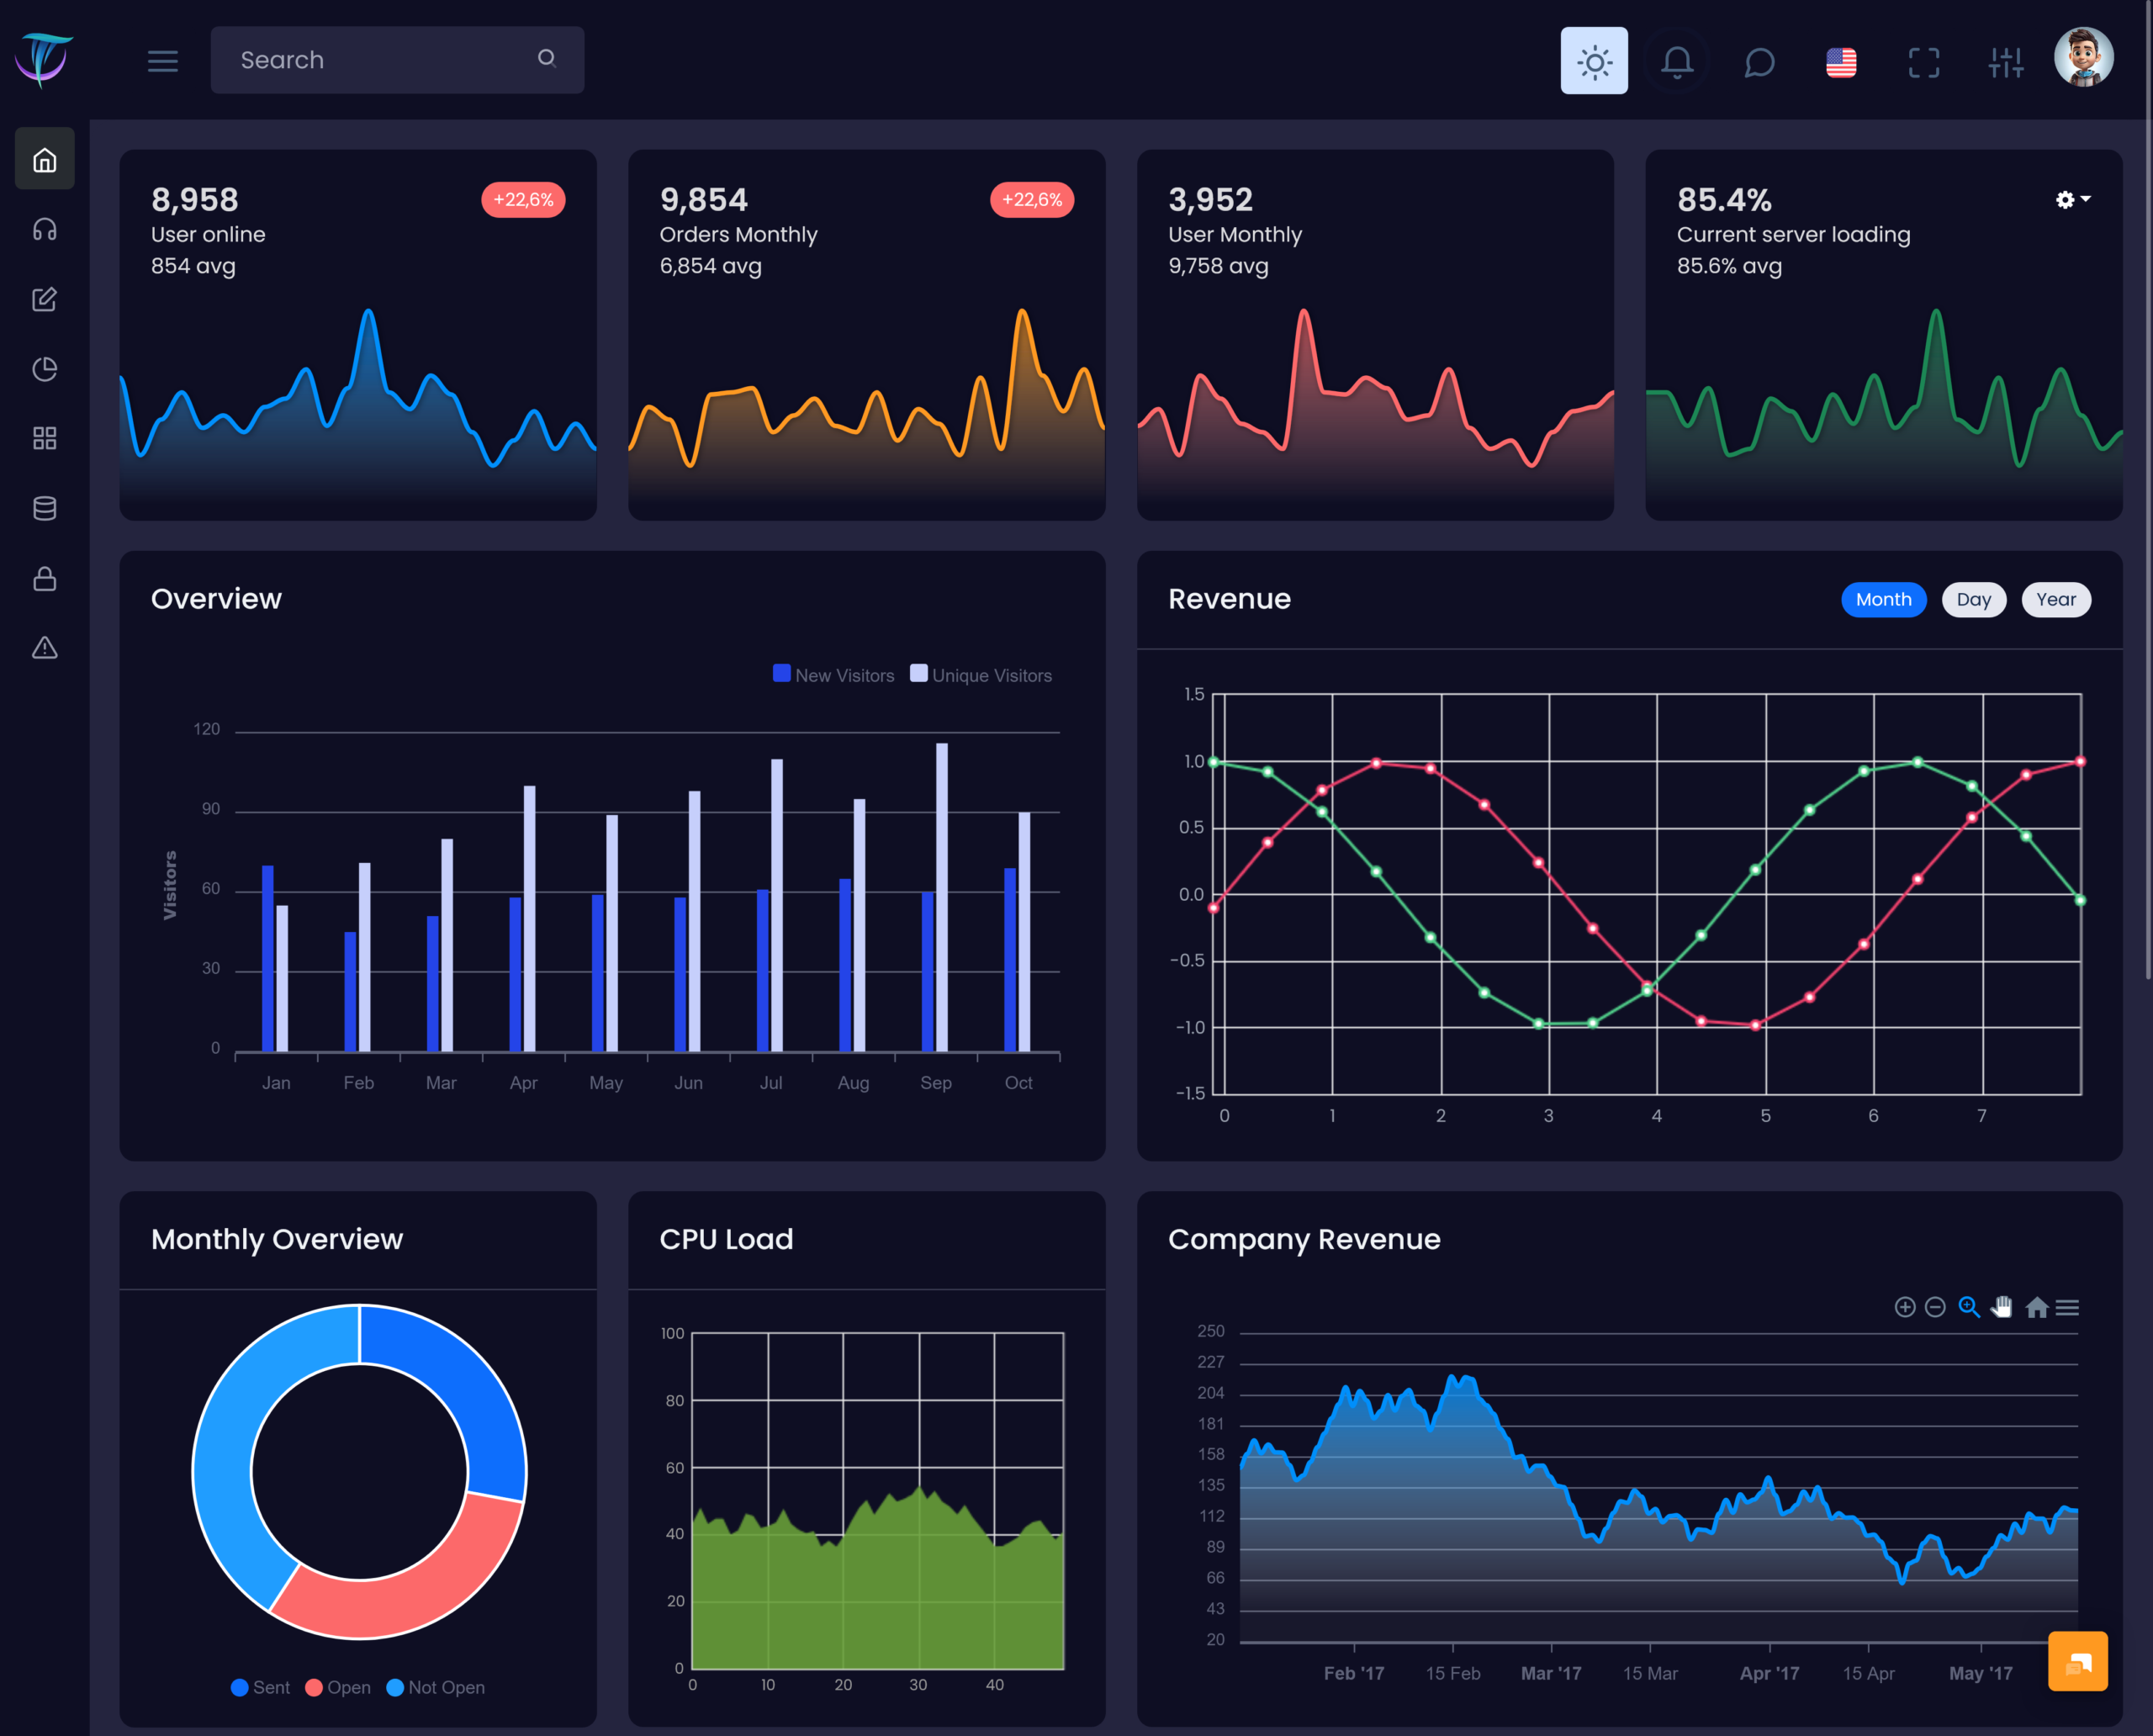
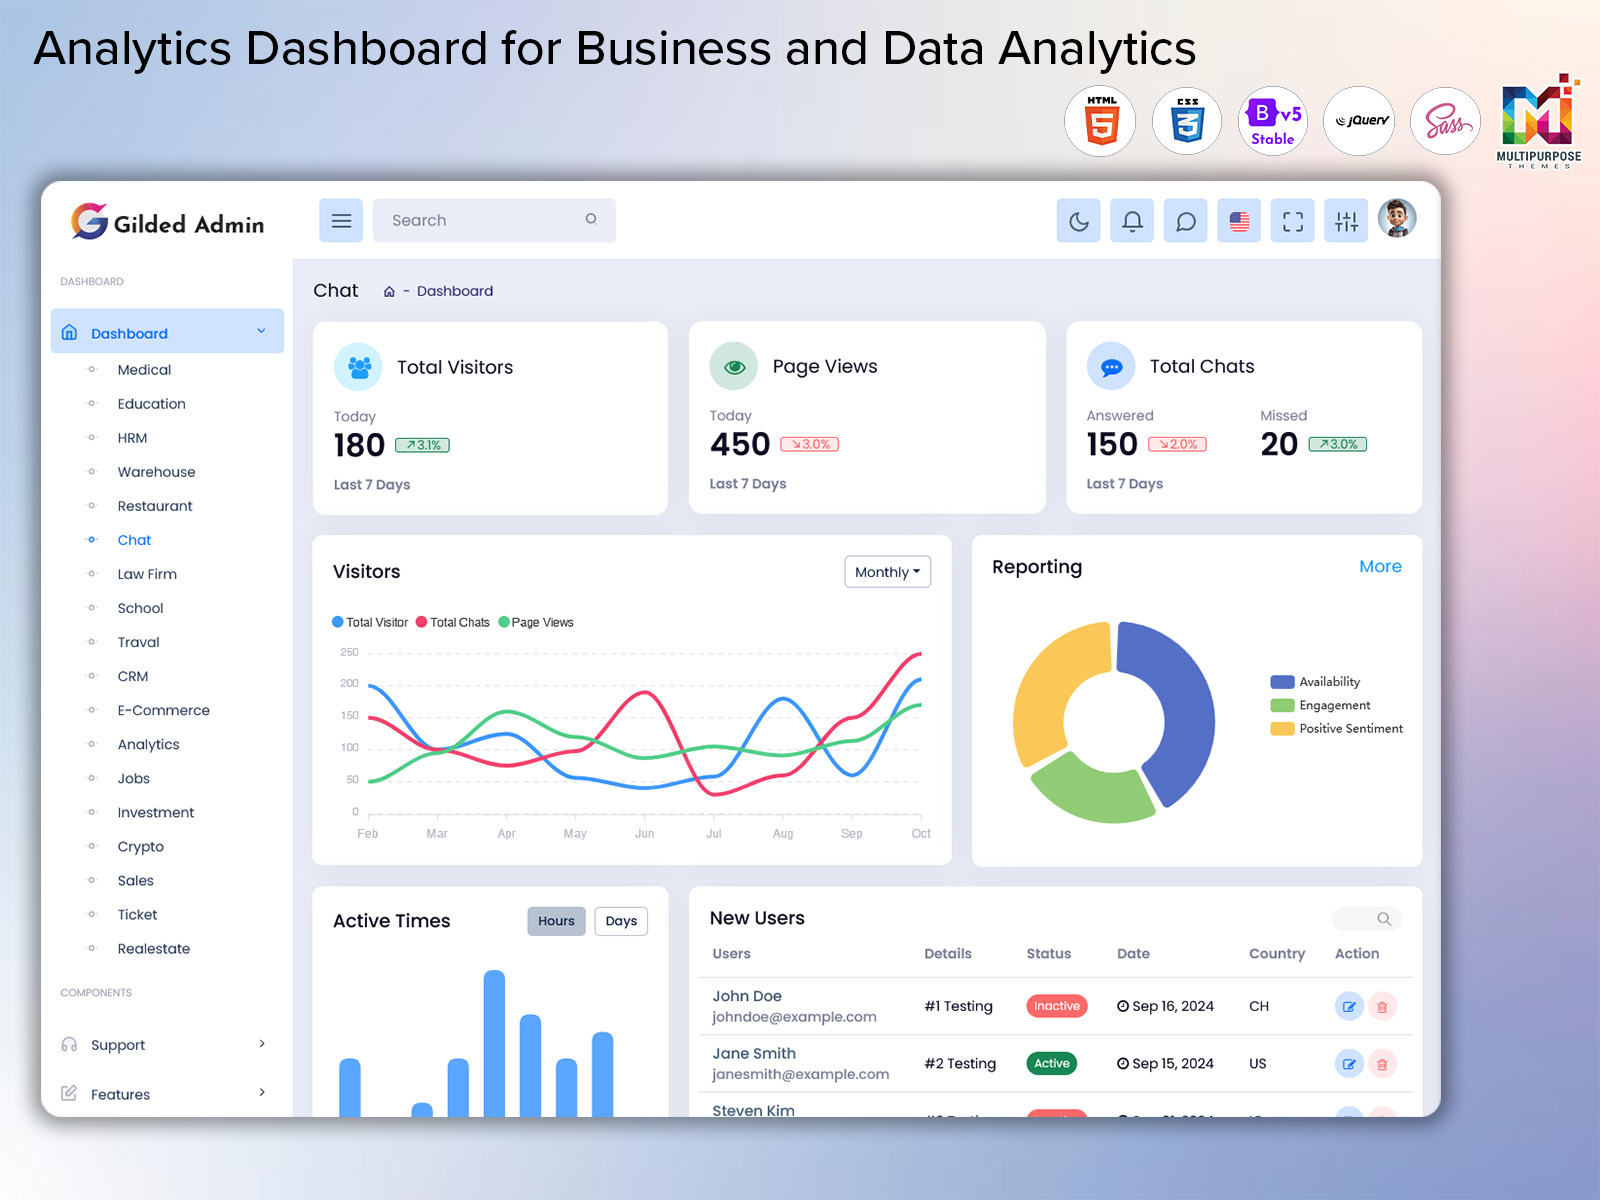
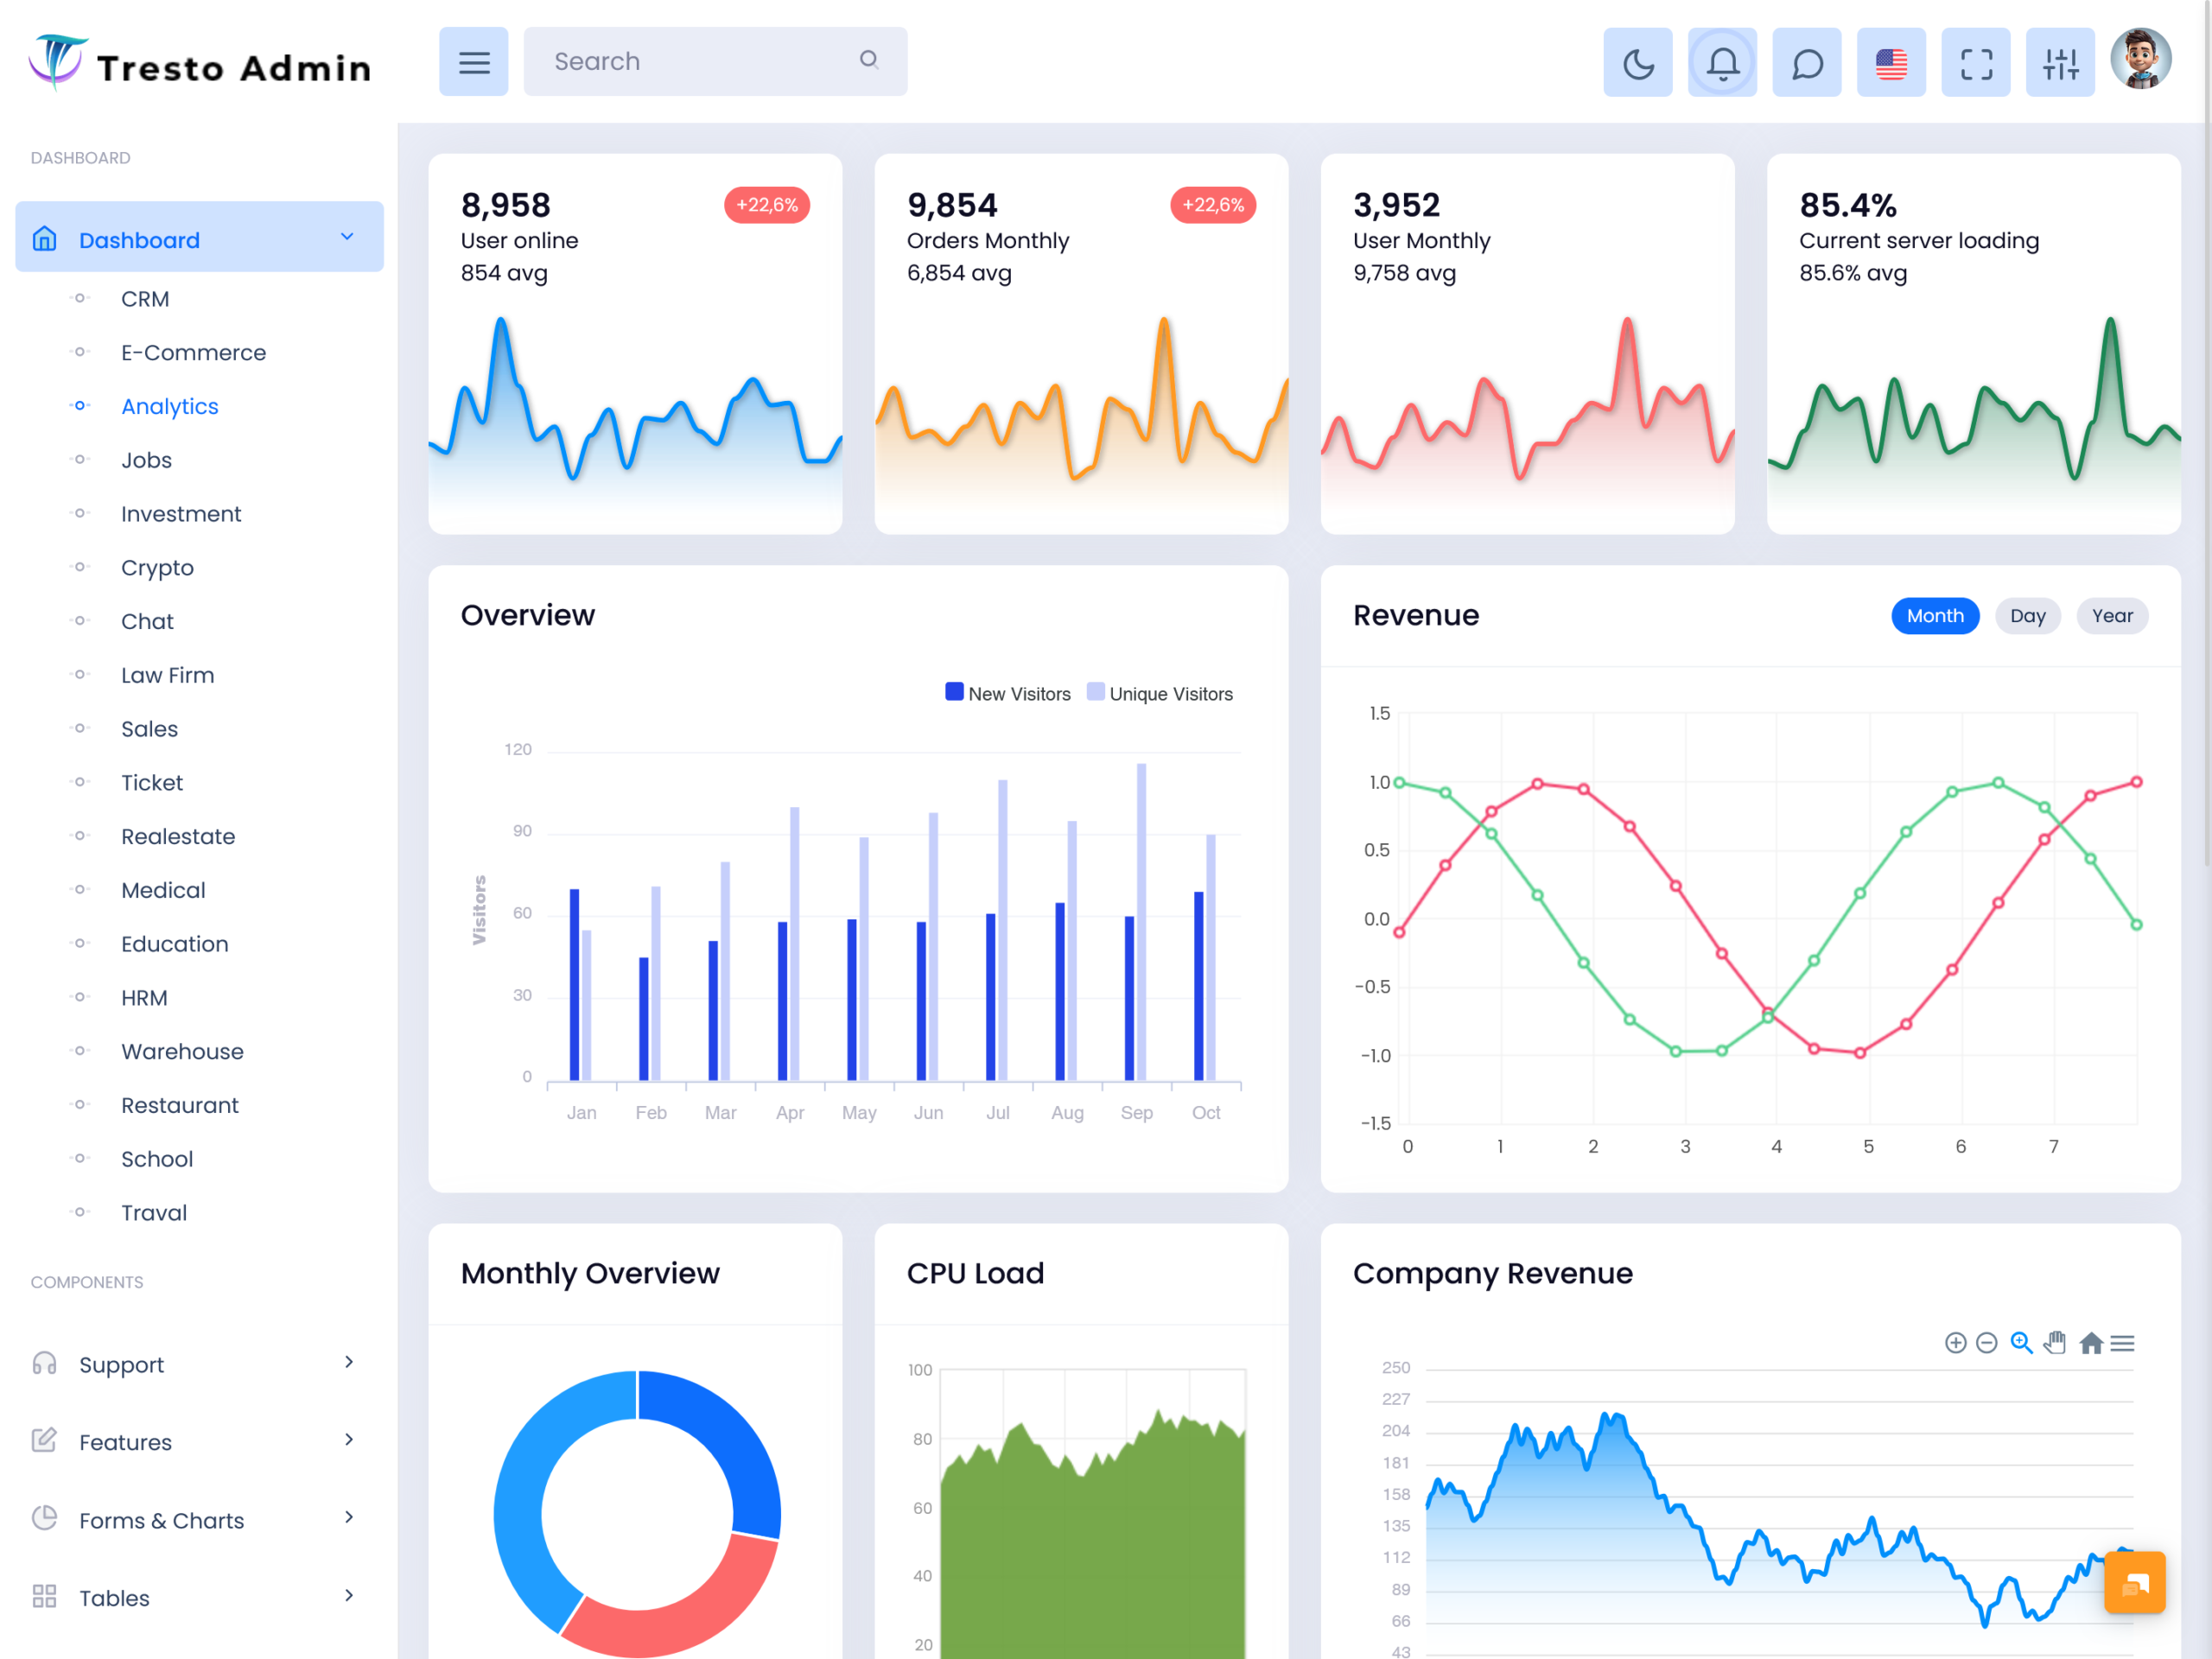
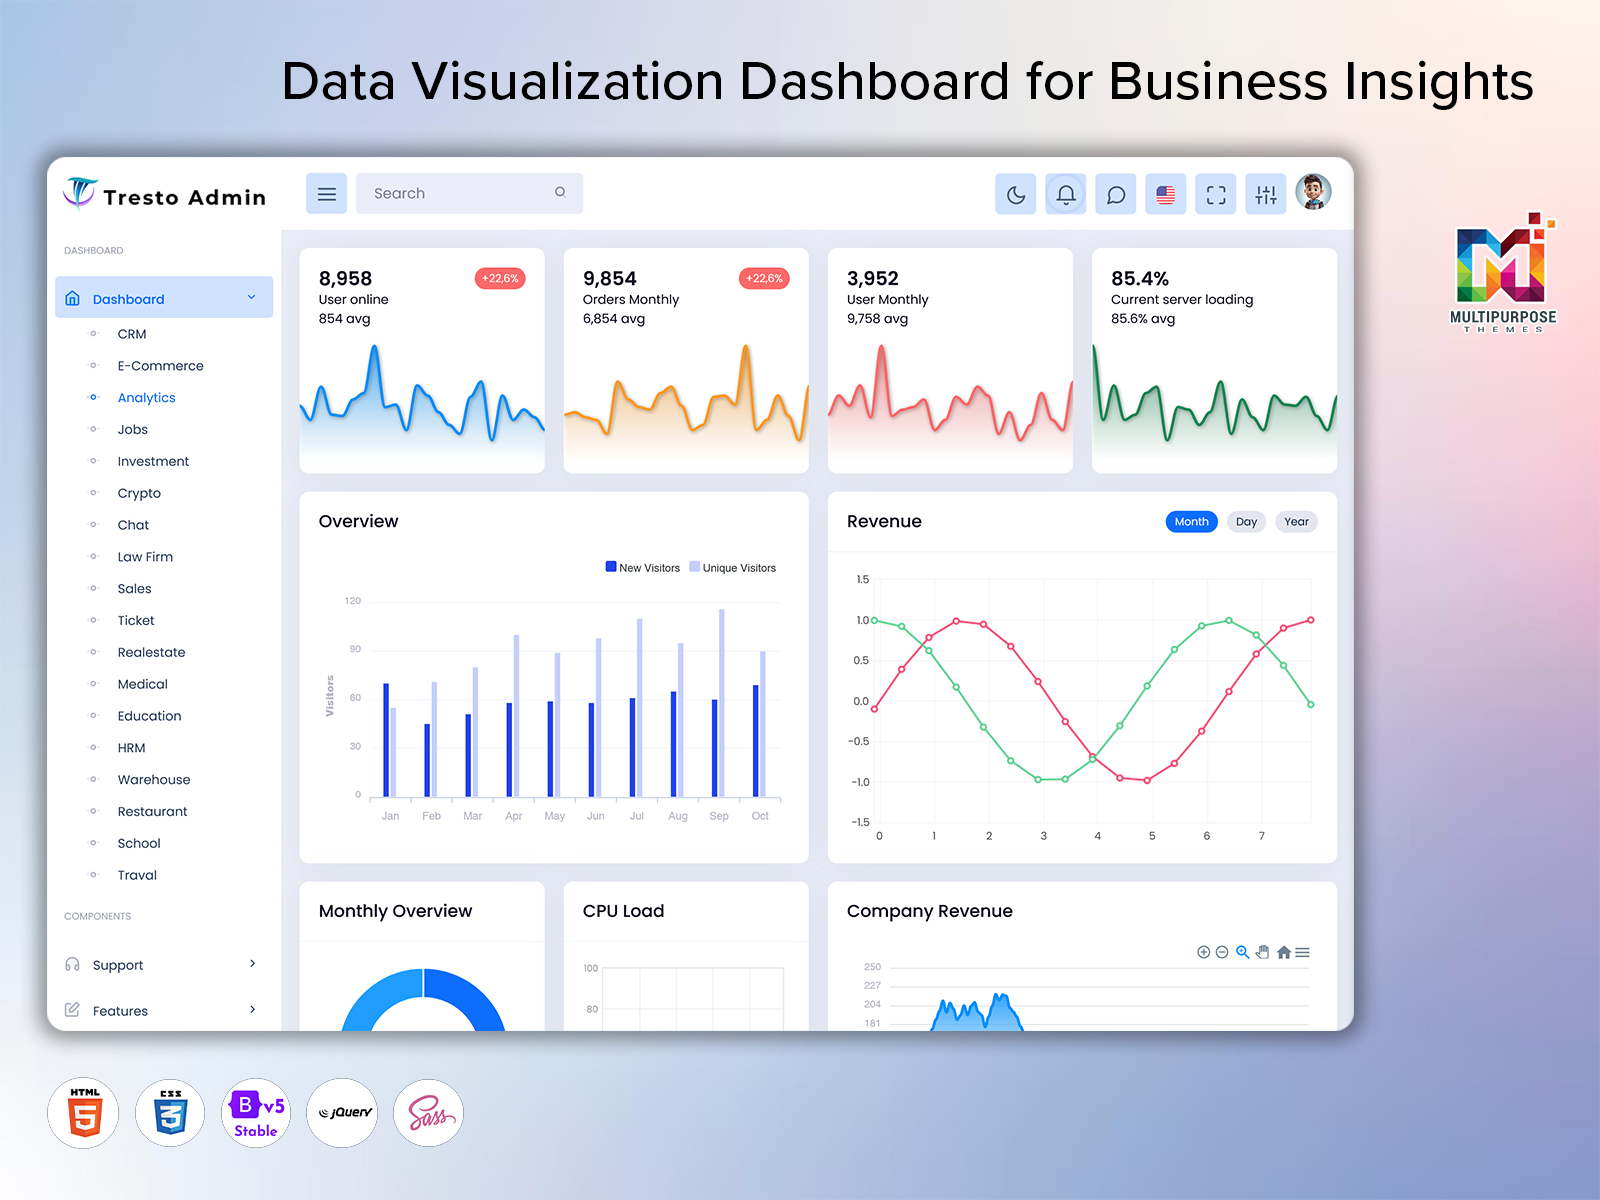
An analytics dashboard is a tool used to display data. Analytics dashboards can contain cards, charts, tables, filters and reports. All data can be viewed in one place. The data shown depends on what the company want to do.
Common data types:
- Order Tracking
- Sales
- Revenue Reporting
- User Management
- Customer Activity
- KPIs
Why use an analytics dashboard?
An analytics dashboard will give a picture of how the analytics dashboard shows how the company is doing showing the company’s performance. It can help organise data. Reasons:
All data in one place
All data can be viewed in one place. This can help view order details, sales, revenue and user data.
Visible
The team can easily see what is going on. The charts and cards make it more visual to help identify patterns.
Quick Reporting
Data can be easily viewed. Reports can be made. The reports will be consistent.
Informed Decisions
Data can be easily understood. This can help the team make better plans and decisions.
Key Features
Order Tracking Dashboard
Can help track orders. It will show details of the orders such as their status and delivery.
Features:
- Order ID
- Customer Details
- Order Date
- Product Details
- Order Status
- Fulfilment Status
- Shipping/Delivery Details
- Search and Filters
- Order Activity
Can help track orders.
Monthly Sales Dashboard
Provides an overview of how sales have gone. Can help compare sales between months.
Features:
- Total Sales
- Order
- Sales by Product/Category
- Sales by Region/Channel
- Compare by Month
- Sales Trends
Can you help identify which products are selling well and where sales are going up or down.
Revenue Reporting Dashboard
Provides revenue data. Can help the team identify total sales and trends.
Common Features:
- Revenue (Over a period of time)
- Revenue by Product/Service
- Revenue by Region/Business Unit
- Revenue Trends
- Compare by Period
- Reports (If wanted)
Having a clear revenue dashboard will help the team.
User Management Dashboard
Can help admins to manage user accounts. Can be useful if there are users, roles & permissions.
Common Features:
- User Profiles/Accounts
- User Status/Registration Details
- Roles & Permissions
- Search & Filters
- User Activity Summary
- Create/Edit Accounts
Permissions need to be set up so users can only see the data that they need and do what they should be able to do.
Key Metrics
Depending on what the company want to achieve there will be different metrics. Common metrics:
- Order Volume
- Order Fulfilment
- Monthly Sales
- Revenue
- Active Users
- User Growth
Order Volume
Shows how many orders have been received over a period of time. Can show how much demand there is.
Order Fulfilment
Shows how many orders are in each status (pending, processing delivered). Can help identify progress.
Monthly Sales
Shows how much sales have been made in a month. Can help identify trends.
Revenue
Shows how much money has been received over a period of time. Can be broken down by product, region and channel.
Active Users
Shows how many users there are over a period of time. How active they are will depend on the company.
User Growth
Shows how many users have joined over a period of time.
Types of Analytics Dashboard
Depending on what the team want to focus on an analytics dashboard can be very useful.
- Operational Dashboard
- Sales Dashboard
- Revenue Dashboard
- User Analytics Dashboard
Who can use an Analytics Dashboard?
Many roles can benefit from using an analytics dashboard.
- Business Owner – I would like to know how the business is doing.
- Sales – I would like to know how sales/orders are doing. Can identify trends.
- Operations – I would like to know how orders are being fulfilled.
- Finance – I would like to know how much income we are getting. Can create reports.
- Admins – I would like to manage users, roles & permissions.
- Developers – I would like to create or customise analytics apps.
Choosing an Analytics Dashboard Template
Consider what your app should do. You have to make a choice about which data should be supplied by your application. I believe this decision will shape how users experience your application. This decision will shape how users experience your application.
I want you to take a moment to imagine the people who will use your application. Think about the purpose of your application and the data that will be useful, for people using your application.
Once you have chosen, select the functionality of your application. What kind of content to display.
Look for a template that includes:
- Charts & Cards
- Order, Sales & Revenue Dashboards
- User Management Dashboards
- Search, Filters & Tables
- Navigation & Consistency
- Customisable Components
This will give you a base to work from.
Benefits of using an Analytics Dashboard Template
Saves Time
Saves time as the dashboard and components have already been created.
Consistent
Using the components will give a consistent analytics dashboard. Makes it easy to track orders, sales, revenue & user data.
Easy to Customise
Developers can customise the colours, layout, navigation and components to fit the app.
Organised Data
Provides data in a way.
Best Practice
Analytics dashboards should be simple. Analytics dashboards should also be easy to understand. Tips:
- Highlight Key Metrics
- Use charts to identify trends.
- Group Data
- Use filters to help users search by date, category and status.
- Page Layouts
- Ensure it can be viewed on desktop, tablet & mobile.
- Keep Secure – Use permissions to keep data secure.
- Display data that can help users make decisions.
Conclusion
An analytics dashboard can help track orders, sales, revenue and user data. Using dashboards such as the order tracking dashboard, monthly sales dashboard, revenue reporting dashboard and user management dashboard can help the team understand the business.
Using an analytics dashboard template can help developers. The business can get started quicker. Using a template will provide components, navigation, responsive design and customisation to create an user experience.
FAQs
What is an Analytics Dashboard?
An Multipurpose Themes analytics dashboard is a tool used to display data from the business. It provides charts, tables and summaries to help users understand how they are doing.
What is an Order Tracking Dashboard?
An order tracking dashboard can help users track order details, status and delivery.
What is a Monthly Sales Dashboard?
A monthly sales Multipurpose Themes dashboard displays data about sales within a month. It shows totals, performance and trends.
What is a Revenue Reporting Dashboard?
A revenue reporting dashboard displays revenue totals and comparisons.
What is a User Management Dashboard?
A user management dashboard can help admins view accounts, manage roles and track user data.
Can an analytics dashboard be customised?
Yes you can customise the layout, components, colours and data to fit your app.

Related Posts

This Post Has 0 Comments