

Cryptocurrency platforms have various sorts of information to deal with, including the records of assets,…
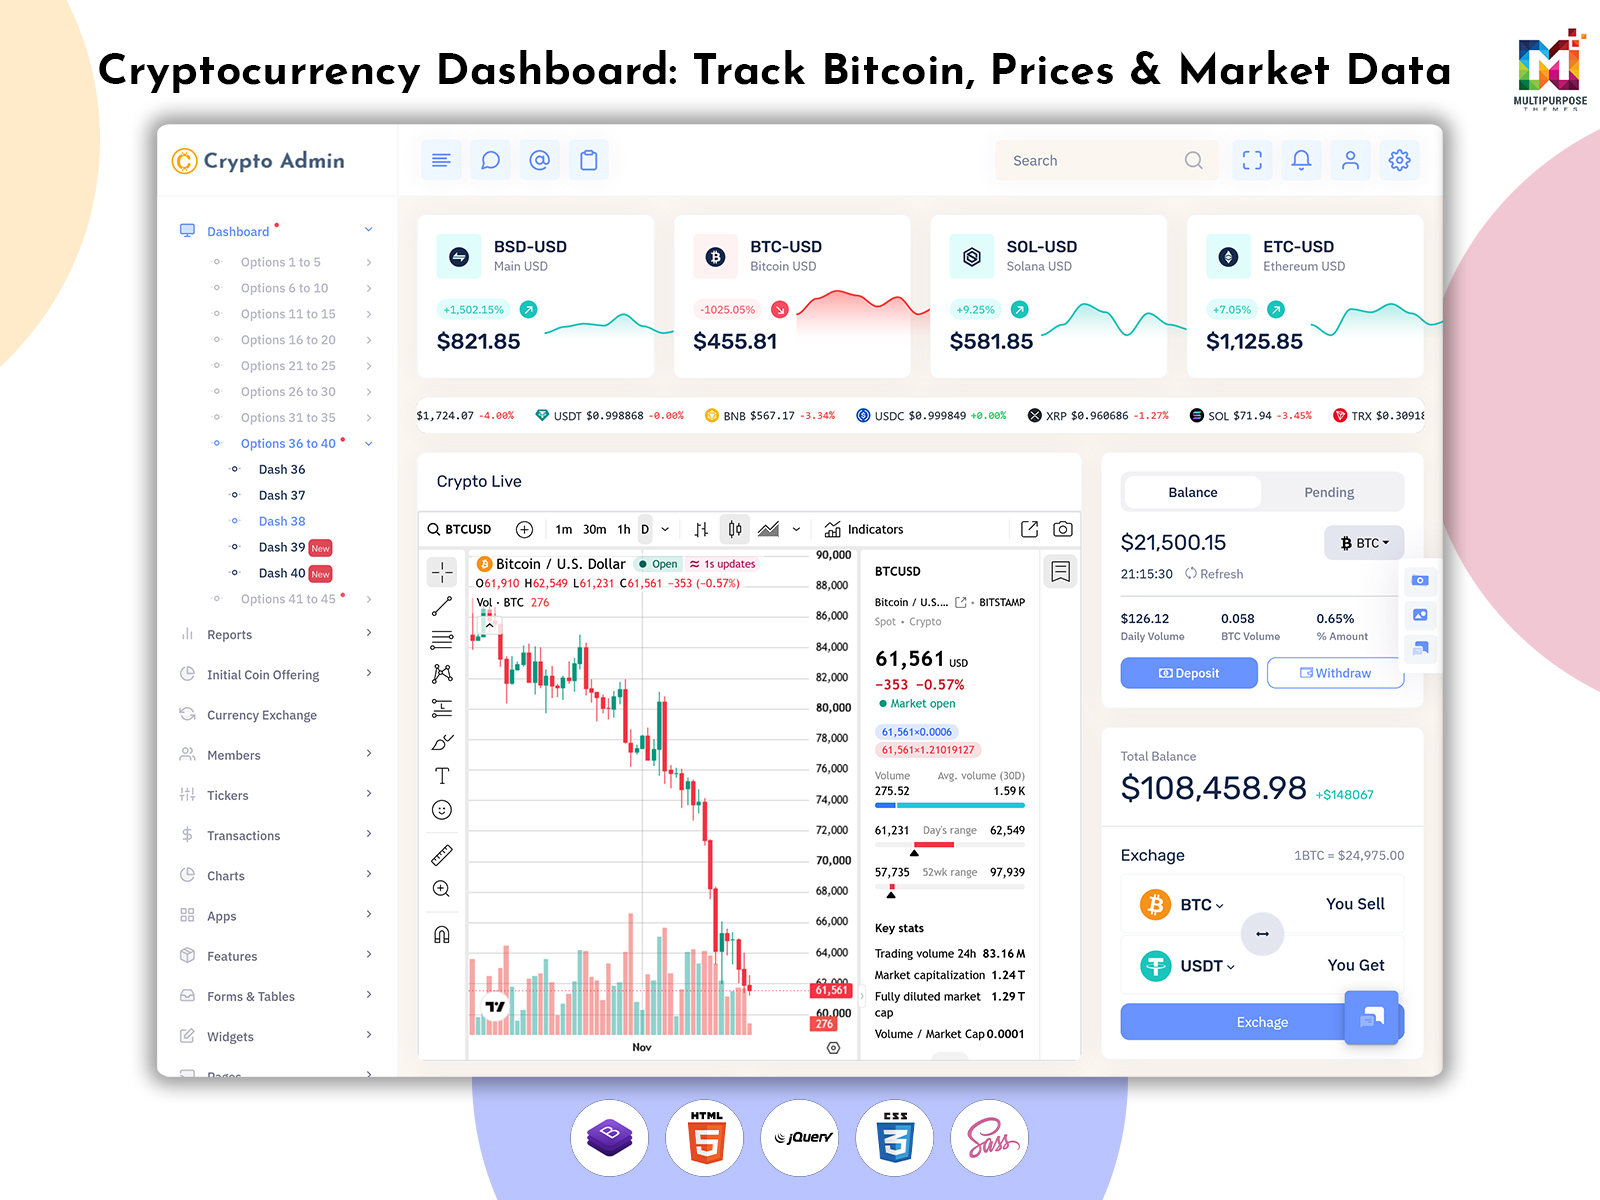
Crypto Dashboard: Track Bitcoin, Analyse Data and Invest Smarter
Reading Time: 8 minutes
Introduction
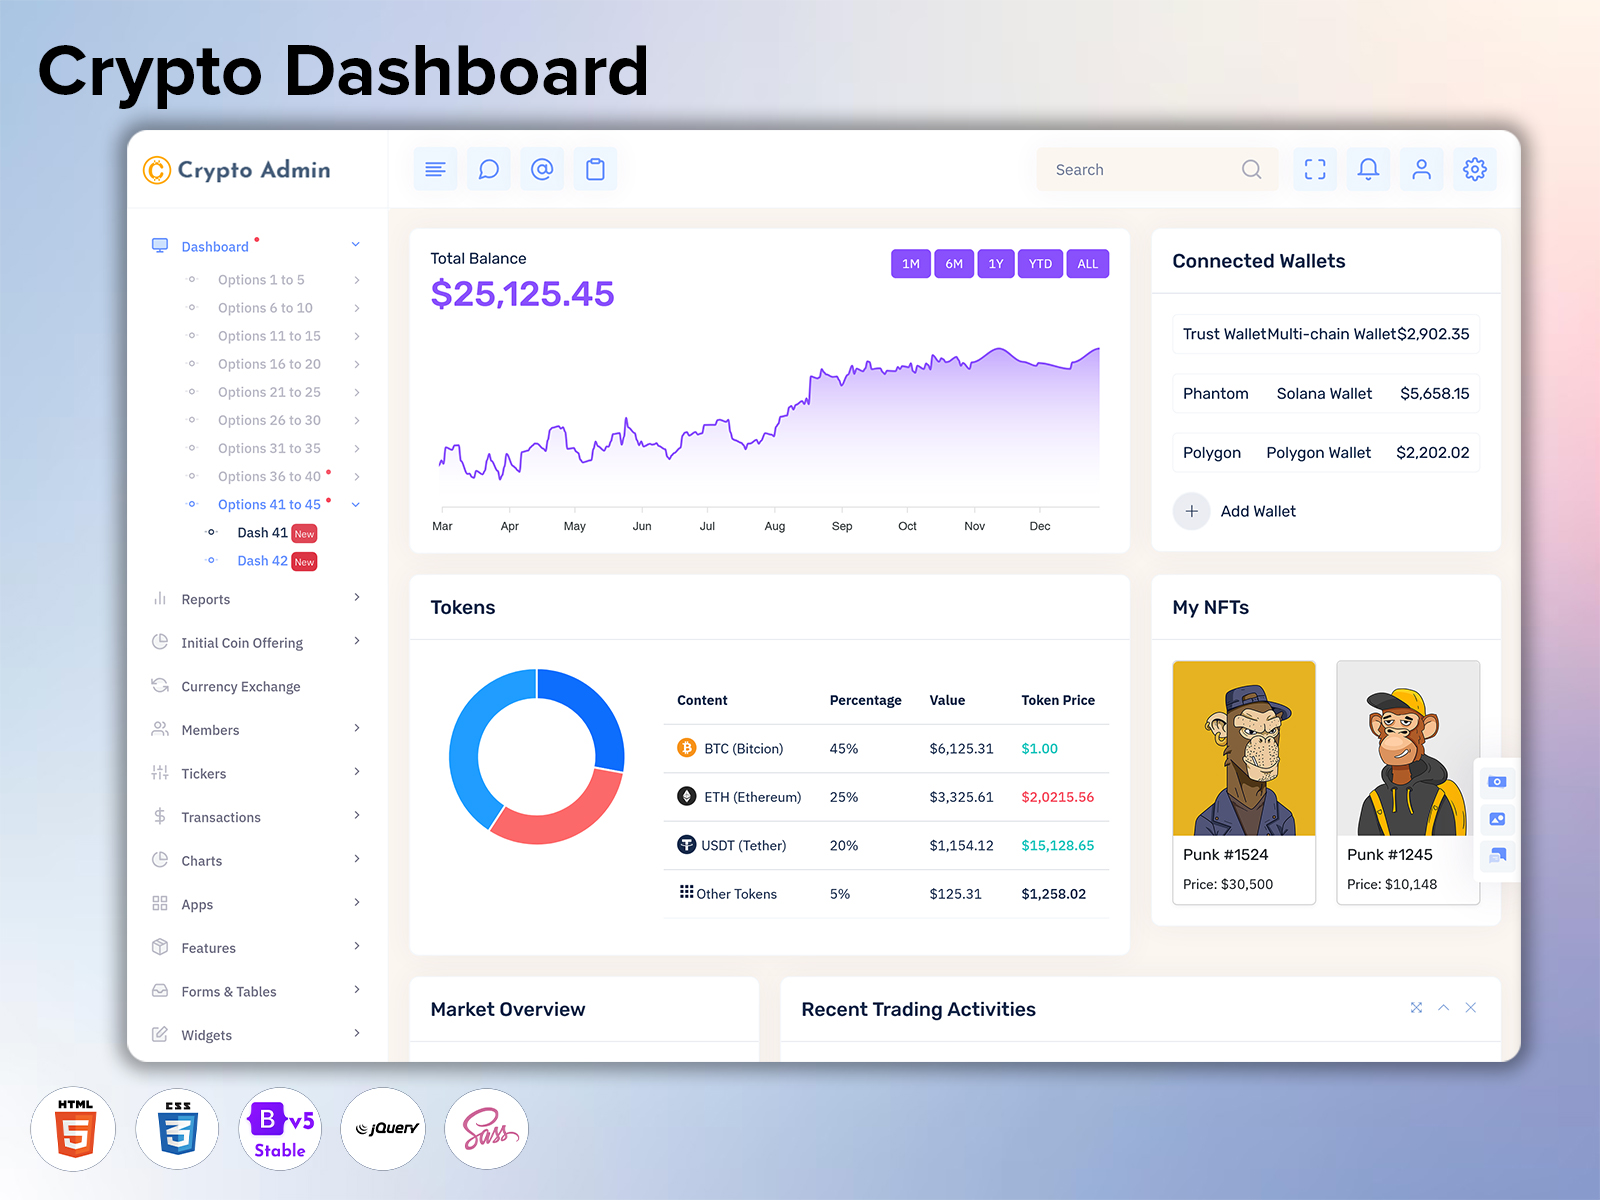
A Cryptocurrency Dashboard is a tool used to manage and look at information about cryptocurrencies. This includes things, like prices, your own collection of digital coins, buying and selling activities, visual representations of price changes and how well your digital assets are doing. A Cryptocurrency Dashboard lets you access information from multiple platforms.
Watch Full Video
A designed Cryptocurrency Dashboard can help developers create cryptocurrency trading portfolio management and financial analytics platforms. A Bitcoin Dashboard Template can help create an interface for managing complex data.
In this blog I will look at what a Cryptocurrency Dashboard’s how it can help you track the market and what features it offers. I will also look at what developers should consider when choosing a dashboard template.
What is a Cryptocurrency Dashboard?
The Cryptocurrency Dashboard shows you cryptocurrency data. The Cryptocurrency Dashboard lets you view cryptocurrency data easily. The Cryptocurrency Dashboard also lets you control and set up cryptocurrency data. A Cryptocurrency Dashboard lets you track assets view market prices, analyse price changes and see portfolio performance.
Depending on the application a Cryptocurrency Dashboard can offer information about Bitcoin, Ethereum and other digital currencies. This can include market capitalisation, trading volume, price changes, transaction history and portfolio breakdown.
A Cryptocurrency Dashboard can be used by businesses and developers to create crypto applications. A Cryptocurrency Dashboard will provide a layout to view key information.
The main goal is to make cryptocurrency data easy to access and understand.
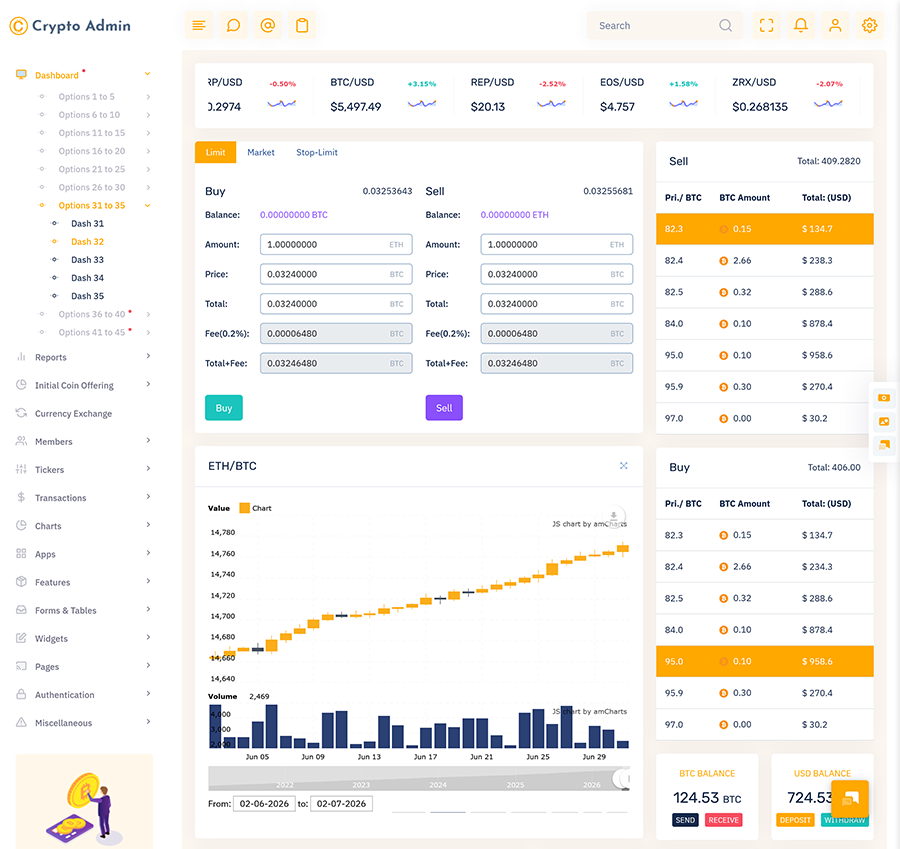
VIEW DEMO BUY NOW
Key Features of a Cryptocurrency Dashboard
A Cryptocurrency Dashboard should provide a way to view key market data. Depending on the application there can be features. Some features are common. Can help provide a great experience.
Live Cryptocurrency Price Tracker
Cryptocurrency prices can fluctuate frequently. A Cryptocurrency Dashboard can be used to view prices of digital currencies.
A Cryptocurrency Dashboard lets you view prices compare between cryptocurrencies and track price changes.
Bitcoin Dashboard
Bitcoin is one of the cryptocurrencies that people watch closely. I can use a Bitcoin Dashboard to see Bitcoin data like price how Bitcoin has done in the past how much Bitcoin is traded and the trends, in Bitcoin price.
Using charts and data summaries helps you see how Bitcoin has performed over time.
Cryptocurrency Portfolio Management
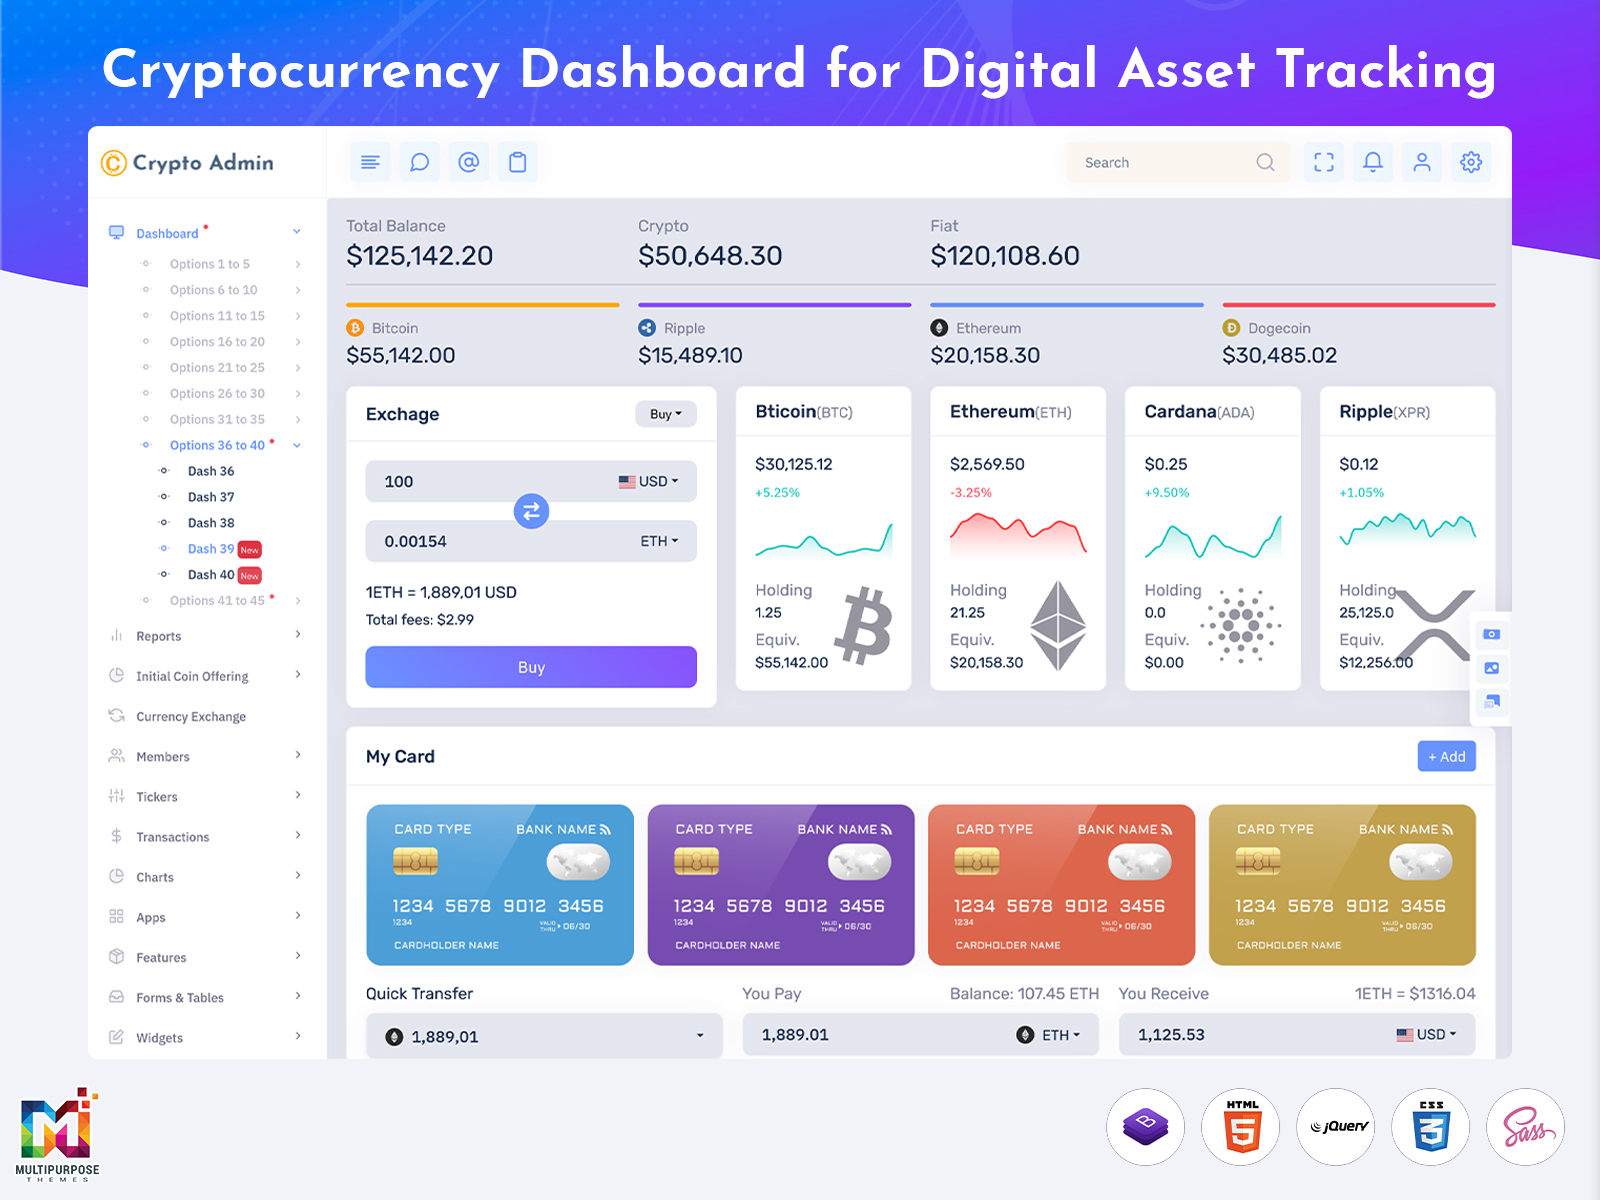
This can help you manage your assets. A Cryptocurrency Dashboard can show you the value of your portfolio the breakdown of assets and how much of each asset you have. A Cryptocurrency Dashboard can also show how your portfolio is performing.
Market Capitalisation & Trading Volume
Market capitalisation and trading volume can help you understand how active the market is.
I think a Cryptocurrency Dashboard can show this using data cards, tables and charts. I think a Cryptocurrency Dashboard lets you compare between cryptocurrencies.
Interactive Charts & Graphs
I find that charts help you understand data better.
A Cryptocurrency Dashboard can show line charts, bar charts and other kinds of pictures.
Cryptocurrency Dashboard tools help you see how prices go up and down and watch how things are doing.
A Cryptocurrency Dashboard lets you check timeframes. You can compare market trends. Get a clearer picture of how prices move over time.
Transaction History
This can help you view recorded transactions. A Cryptocurrency Dashboard can include dates, asset name, amount, type of transaction and status.
A Cryptocurrency Dashboard can help you keep track of your activity.
Watchlist
A watchlist can help you keep track of cryptocurrencies.
A Cryptocurrency Dashboard lets you save currencies to view price changes, in one place of searching for them.
Responsive Dashboard
A responsive Cryptocurrency Dashboard will adapt to the screen size. A Cryptocurrency Dashboard lets you view data on desktops, tablets and mobile devices.
Responsive tables, adaptable charts and organised navigation can provide an experience.
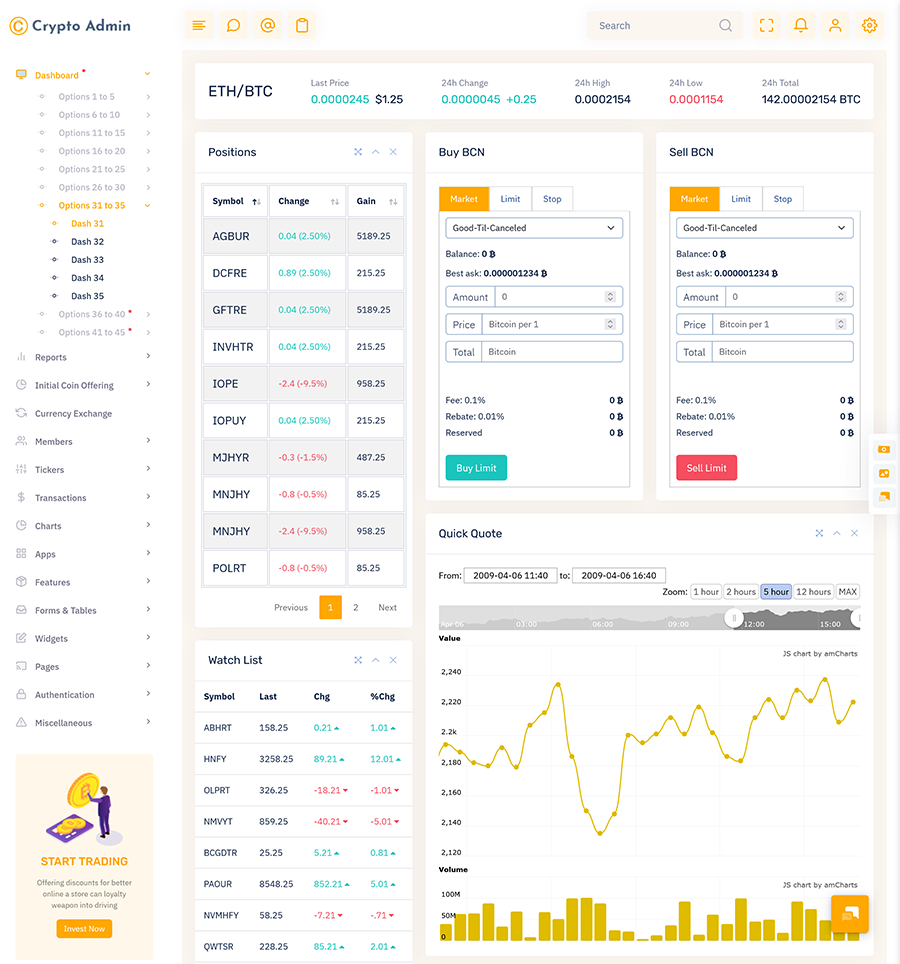
VIEW DEMO BUY NOW
How a Crypto Dashboard Can Help You Track the Market
There is a lot of changing data within the cryptocurrency market. This can become time consuming to check each asset.
A Cryptocurrency Dashboard can provide you with all the market data, in one place. A Cryptocurrency Dashboard lets you view prices compare performance see trading volumes and track assets.
For example if you are tracking Bitcoin, Ethereum and other cryptocurrencies a Cryptocurrency Dashboard lets you view how Bitcoin, Ethereum and cryptocurrencies prices are changing. A Cryptocurrency Dashboard makes it simple to compare coins. It helps you see how Bitcoin, Ethereum and other cryptocurrencies are doing.
A Cryptocurrency Dashboard can help keep your research in order. Keep in mind that cryptocurrency prices change a lot and the information might not always be correct.
How to Use Cryptocurrency Data Before Investing
Before investing in cryptocurrency it can be useful to understand the data. A Cryptocurrency Dashboard can help organise data points.
Some data you can view:
- Price – View price changes.
- Trading Volume – See how much is being traded.
- Market Capitalisation – Compare market values.
- Portfolio Breakdown – View how your chosen assets are broken down.
- Market Trends – Use charts and historical data to analyse price changes.
- Asset Information – Understand the cryptocurrency and what it’s for.
This can help you with market research. This can help you make decisions but investing in cryptocurrency comes with risks.
Bitcoin Dashboard Template for Crypto Applications
When creating a cryptocurrency platform you will need an interface to display data. A Bitcoin Dashboard Template can help provide a ready‑made starting point.
Than designing each element of the dashboard from scratch you can use a pre‑designed template and adapt it to your needs.
A Bitcoin Dashboard Template can include:
- Bitcoin Price Cards.
- Historical Price Charts.
- Portfolio Performance.
- Cryptocurrency Market Tables.
- Transaction History.
- Watchlist.
- Account Management.
- Responsive. Dashboard.
This can help you organise your data.
The actual market data user accounts and trading will depend on your back‑end, API integrations and other services.
Cryptocurrency Dashboard vs Bitcoin Dashboard
Although these are very similar they can be used for purposes depending on your application.
| Cryptocurrency Dashboard | Bitcoin Dashboard |
| Multiple digital currencies | Focuses on Bitcoin |
| Shows crypto prices | Shows Bitcoin prices |
| Multi‑asset portfolio | Focuses on Bitcoin performance |
| Compare cryptocurrencies | Help analyse Bitcoin market trends |
| Great for crypto platforms | Great for Bitcoin focused applications |
A Cryptocurrency Dashboard can be useful if you need to display data about assets. A Bitcoin Dashboard focuses more on Bitcoin data.
You can also combine both methods to create a platform which can track Bitcoin and provide cryptocurrency data.
Who Can Use a Cryptocurrency Dashboard?
A Cryptocurrency Dashboard can be useful for users and businesses.
Individual Crypto Investors
Individuals can use this to manage their cryptocurrency, track prices and view portfolio performance.
Cryptocurrency Traders
Traders can use the market charts, price data and watchlists to track cryptocurrency.
Crypto Startups
Startups creating asset platforms can use dashboards to display market data and user accounts.
FinTech Businesses
FinTech businesses can integrate cryptocurrency data into their applications and analytics.
Developers & Designers
Developers and UI designers can use a Cryptocurrency Dashboard Template to create crypto management applications.
Portfolio Management Platforms
Digital asset management platforms can use dashboards to manage portfolio data, asset breakdown and performance.
Key Metrics to Include
A good cryptocurrency dashboard should include metrics to help you understand market activity and portfolio data.
Some useful metrics to include are:
- Price – Shows the price of the chosen cryptocurrency.
- 24hr Price Change – Shows how much the price has changed in the 24hrs.
- Market Capitalisation – Shows the market value.
- Trading Volume – Shows how much has been traded in the chosen timeframe.
- Total Portfolio Value – Shows the value of the assets in your portfolio.
- Asset Breakdown – Shows how your portfolio is broken down.
- Historical Performance – Helps you view price changes over timeframes.
This can be displayed using cards, charts and tables.
How to Integrate APIs
A cryptocurrency dashboard will need some data to display. You can integrate it with APIs providing market data for cryptocurrencies.
These will provide data to your cryptocurrency dashboard such as price, trading volume, market capitalisation and historical price data.
The general steps are:
- Choose a cryptocurrency data provider.
- Integrate with the provider’s API.
- Get the required cryptocurrency data.
- Organise the data.
- Display using cards, charts and tables.
- Set how often the data updates.
The quality, availability and how often the data is updated will depend on the provider.
Why Use a Cryptocurrency Dashboard Template?
A responsive dashboard can help you display cryptocurrency data. As users will be viewing the platform on screen sizes the dashboard should be easy to read and navigate.
Choosing a cryptocurrency dashboard template can help you create a layout.
Benefits include:
- Easy to display cryptocurrency data in organised sections.
- Customise dashboard elements.
- Responsive.
- Data is displayed in charts, tables and cards.
- Easy to develop.
Choosing a template can help provide an user experience and a good starting point for creating cryptocurrency applications.
Best Practice for Creating a Cryptocurrency Dashboard
Your cryptocurrency dashboard should display data. Be easy to understand.
Some tips to consider are:
- Place market data at the top of the dashboard.
- Use labels, for prices, percentages and other financial data.
- Do not overcrowd with many charts.
- I think you should format the data using the cryptocurrency formatting.
- I think you should include filters to view data.
- I think tables and charts should be easy to read on screen.
- I think you should include messages for loading, errors and no data.
- I think the data should have a source and last updated date.
I think this can help keep your dashboard tidy and provide an user experience.
Future Scope of Cryptocurrency Dashboard Development
I think as cryptocurrency applications continue to evolve with digital assets, financial services and data technologies dashboard designs can also evolve.
Some areas to consider are:
- crypto portfolio analysis.
- Custom price messages.
- Integrate exchange data.
- Detailed market data reports.
- Custom dashboard widgets.
- Improved data visualisation.
- AI tools to help summarise market data.
I think this can help developers create cryptocurrency platforms. How they are used will depend on what the applications for what data is available and what technical requirements are.
Conclusion
I think a Cryptocurrency Dashboard can help you view cryptocurrency prices, track market activity and manage asset data. With features such as Bitcoin tracking, portfolio management, interactive charts, transaction history and market analysis Cryptocurrency Dashboard provides a source of detailed data.
I think a ready‑made Cryptocurrency Dashboard can help developers create crypto trading tools, portfolio management and financial analysis applications. A flexible Bitcoin Dashboard Template can also help you easily customise elements of the dashboard.
I think if you are creating a cryptocurrency platform or application to help users track their assets choosing the dashboard layout can help you display and manage financial data.
I think you should view our Cryptocurrency Dashboard demo on Multipurpose Themes to see how it has been designed, laid out and what features it includes for your dashboard project.
VIEW DEMO BUY NOW
FAQs
1. What is a Cryptocurrency Dashboard?
A Multipurpose Themes Cryptocurrency Dashboard is a screen that displays cryptocurrency prices, market data, portfolio information, trading volume and other digital asset data.
2. What are the main features of a Cryptocurrency Dashboard?
Common features include price tracking, Bitcoin tracking, portfolio management, market charts, trading volume, transaction history, watchlists and responsive designs.
3. What is a Bitcoin Dashboard Template?
A Multipurpose Themes Bitcoin Dashboard Template is a ready‑made dashboard that can be customised to create applications to track Bitcoin prices, historical performance, portfolio data and related market data.
4. Can a Cryptocurrency Dashboard track than one cryptocurrency?
Yes. A Cryptocurrency Dashboard can display data for currencies such as Bitcoin, Ethereum and others depending on what the application can connect to.
5. How do Cryptocurrency Dashboards get prices?
Prices can be obtained using APIs connected to market data providers or exchanges. How often the prices update will depend on the data source. How it has been set up.
6. Can I manage my crypto portfolio?
I think yes. A Multipurpose Themes Cryptocurrency Dashboard can include features to show you how your assets are performing, the value of your portfolio and how your assets are split.
7. Is a Cryptocurrency Dashboard for developers?
Yes. A Cryptocurrency Dashboard Template can be used as a starting point to create crypto applications. You can customise the layout, charts, tables and other elements depending on your project.
8. Can a Cryptocurrency Dashboard be used on devices?
Yes. A responsive Multipurpose Themes Cryptocurrency Dashboard can adapt to devices, tablets and computers to make it easy to view data.
9. What is the difference, between a Cryptocurrency Dashboard and a Bitcoin Dashboard?
A Cryptocurrency Dashboard can display data for currencies whereas a Bitcoin Dashboard focuses on Bitcoin prices, activity and performance.
10. Can I customise a Cryptocurrency Dashboard Template?
Yes. Developers can customise the layout, colours, charts, tables, menus and other elements depending on what the application needs.
11. What data should I display on a Cryptocurrency Dashboard?
Key data to display includes price, price changes, 24hr changes, market value, trading volume, historical performance, total portfolio value and asset breakdown.

Related Posts

This Post Has 0 Comments