

What Is a Solar Dashboard? A Solar Dashboard is a screen that arranges and shows…
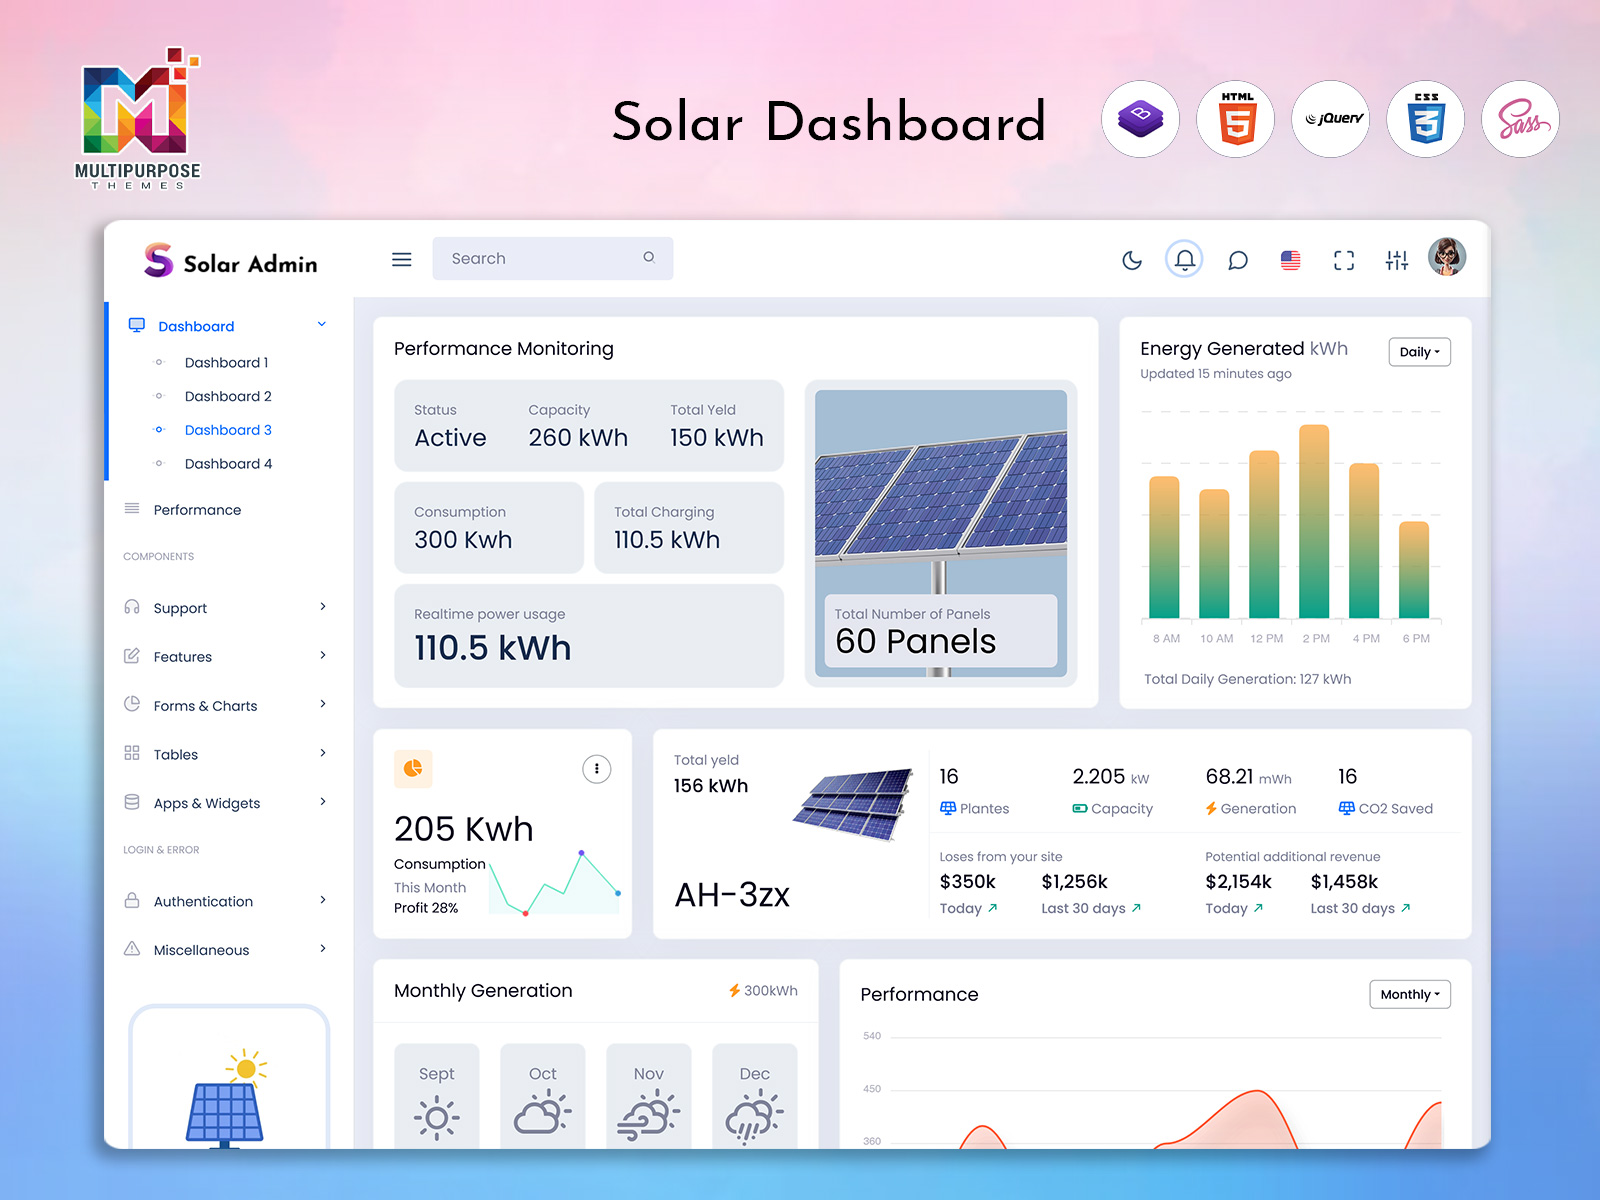
Solar Monitoring Mobile App: A Smarter Solar Dashboard
Reading Time: 9 minutes
A solar dashboard provides a digital workspace where solar-related information can be organized and presented in a clear manner. Instead of checking different devices, reports, or monitoring screens, users can work with relevant information through one interface.
Watch Full Video
The value of a dashboard is not simply in displaying numbers. A useful interface should help users understand what is happening with the solar system, notice meaningful changes, and investigate situations that may require attention.
This is especially important as solar installations become more diverse. A small residential system and a large Solar Commercial Pv System can have very different monitoring requirements. The dashboard should therefore be flexible enough to suit the scale and purpose of the installation.
What is a Solar Dashboard?
A solar dashboard is a digital interface designed to organize and present information associated with a solar energy system. It can be used by homeowners, solar installers, maintenance teams, facility managers, energy companies, and commercial organizations that need a clearer way to review their solar operations.
Solar systems can produce information continuously. Looking at one individual reading may not provide much meaning, but comparing information over time can help users understand how the installation is behaving.
A dashboard creates a structured place for that information.
Solar Generation Dashboards can be designed to help users review energy generation information and understand changes in output. The way this information is presented can be adapted according to the type and size of the installation.
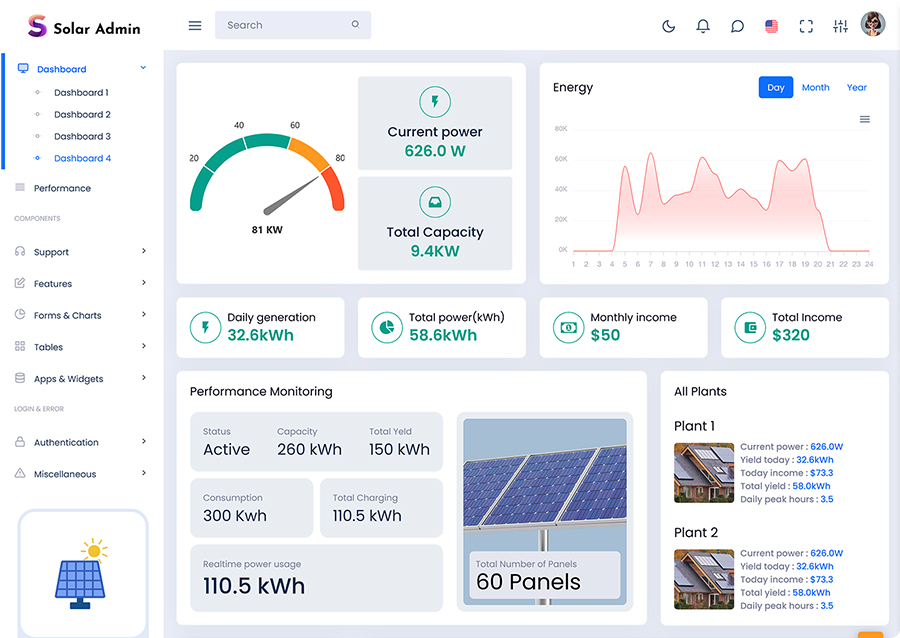
A Solar System Dashboard can provide a broader workspace for monitoring the overall condition and activity of a solar installation. It can be particularly useful when users need more than a single production figure.
A Solar Web Dashboard can make solar information accessible through a web-based interface. This can be useful for users who need to review system information from different devices or locations, depending on the application’s architecture and access controls.
For larger installations, a Solar Commercial Pv System may involve a greater volume of operational information and require a more structured monitoring experience.
The purpose of a solar dashboard is therefore to turn raw system information into something people can review and understand.
It should answer practical questions such as:
- Is the system behaving as expected?
- Has production changed noticeably?
- Does a particular period look unusual?
- Which information deserves further investigation?
- How is the system behaving over time?
A well-designed dashboard can make these questions easier to approach.
‘
VIEW DEMO BUY NOW
From Solar Monitoring to Smarter System Insights
Solar dashboards are often viewed mainly as monitoring screens. However, their usefulness can go much further.
A solar system can perform differently depending on weather, seasonal conditions, equipment behavior, site characteristics, maintenance requirements, and other external factors. Because of this, a single day’s output should not automatically be treated as a complete measure of system performance.
Context matters.
For example, a user may notice that today’s generation is lower than yesterday’s. That observation is useful, but it does not necessarily indicate a problem. Weather conditions or other environmental factors may explain the difference.
A dashboard can help users compare information over time rather than reacting to one isolated number.
This is where Solar Generation Dashboards can become especially useful. They can help users recognize changes in production and decide whether those changes are normal or worth investigating.
A Solar System Dashboard can take an even wider view by bringing different types of system information into one workspace.
The goal should not be to make the user constantly watch the dashboard. Instead, the dashboard should provide useful information when the user needs to review the system.
This creates a healthier relationship between monitoring and decision-making.
Rather than asking, “What number is on the screen?”, users can ask:
“What does this information tell me about the system?”
That shift can make the dashboard much more valuable.
Features of Solar Dashboard
1. Solar Generation Dashboards
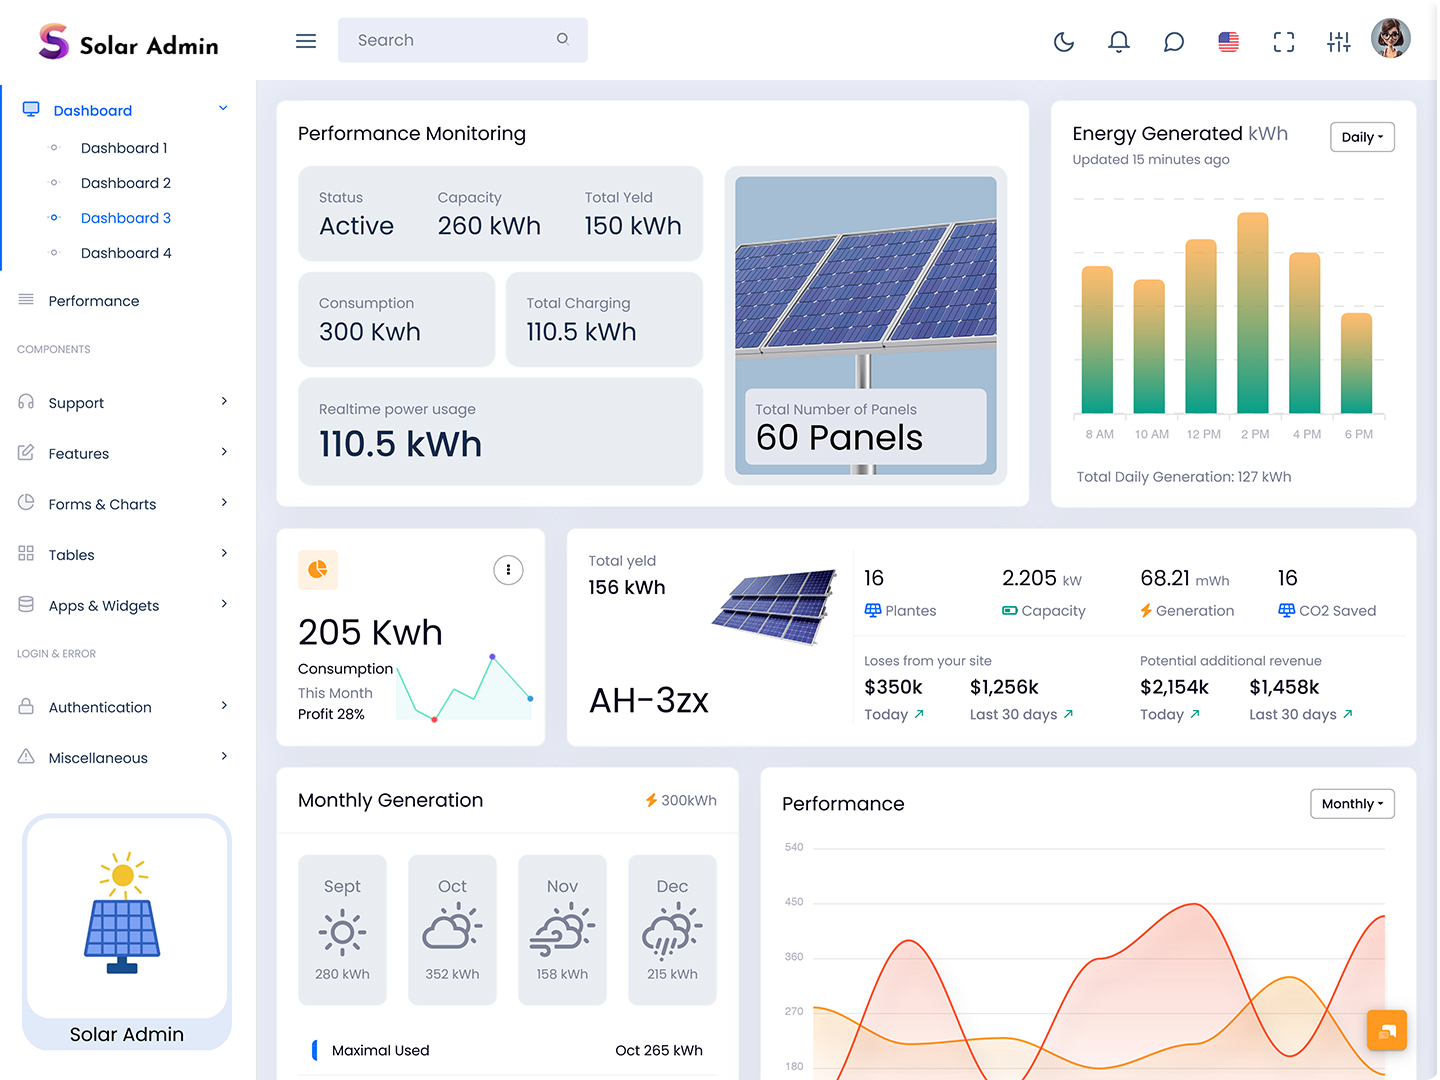
Solar Generation Dashboards can organize solar production information into a clear visual workspace. They help users review how much energy the installation has generated during selected periods and make comparisons easier without requiring them to manually combine separate monitoring records.
2. Solar System Dashboard
A Solar System Dashboard can provide a wider view of an installation by bringing relevant system information into one interface. It can help users understand the current operating picture and move toward detailed information when a particular condition deserves closer attention.
3. Solar Web Dashboard
A Solar Web Dashboard can provide browser-based access to solar information, depending on how the application is developed. This approach can make monitoring more convenient for authorized users who need to review system information without depending on a single dedicated workstation.
4. Solar Commercial Pv System
A dashboard designed for a Solar Commercial Pv System can accommodate the broader monitoring requirements associated with larger installations. Its interface can be structured to help facility teams and operators review information efficiently while keeping the overall experience organized.
5. Historical Performance View
A solar dashboard can organize historical information so users can look beyond current readings. Reviewing previous periods can provide useful context for understanding whether a recent change is temporary, expected, or sufficiently unusual to deserve additional investigation.
6. Visual Data Presentation
Solar information can be easier to understand when presented through carefully selected visual elements. A dashboard can use clear charts and other representations to help users recognize movement and comparisons without making the interface unnecessarily complicated.
7. Flexible Monitoring Interface
Different solar installations have different requirements. A flexible dashboard can be adapted around system size, user roles, monitoring needs, and business objectives. This allows developers to create an interface that fits the installation instead of forcing every solar project into an identical structure.
Solar Dashboard as a Practical Decision-Making Tool
A meaningful solar dashboard should help users understand information rather than simply display it.
Consider a commercial facility with a large solar installation. The facility manager may not need to watch the system every minute. What they need is a reliable way to review the system periodically and identify anything that appears different from the expected situation.
A solar dashboard can generate substantial amounts of information. Presenting every available data point at once could make the interface difficult to understand.
A better approach is to organize information into layers.
The first layer provides a quick overview. The second gives context. The third allows users to investigate specific areas.
This means the dashboard can support different levels of attention.
A manager who only wants a quick status check can remain at the overview level. Someone investigating an unusual production change can move into more detailed information.
This approach is particularly useful for Solar Generation Dashboards.
Instead of simply showing production figures, the dashboard can help users understand how those figures relate to different periods.
For example, a lower generation level may look concerning when viewed alone. When compared with historical information and the conditions surrounding that period, the same result may become easier to interpret.
The dashboard does not need to make the final judgment.
Its role is to provide the information needed for the user to make that judgment.
That makes it a decision-support workspace rather than just a monitoring screen.
VIEW DEMO BUY NOW
Benefits of Solar Dashboard
1. Easier Solar Monitoring
A Solar Dashboard brings relevant system information into a centralized workspace. This makes routine monitoring more convenient and gives users a clearer starting point when they want to understand current solar activity without checking multiple disconnected sources.
2. Better Understanding of Generation
Solar Generation Dashboards can help users review production information across selected periods. This makes it easier to recognize changes and compare results instead of judging system behavior from one isolated reading.
3. Supports Faster Review
A Solar System Dashboard can organize important information so users can review the installation more efficiently. A clear overview reduces unnecessary searching and allows users to move toward detailed information only when closer investigation becomes necessary.
4. Useful for Remote Monitoring
A Solar Web Dashboard can make relevant solar information available through a browser-based environment. Depending on implementation and security controls, authorized users can review system information from locations other than the physical installation.
5. Helps Commercial Operations
A dashboard designed around a Solar Commercial Pv System can give commercial teams a structured way to review larger solar installations. It can make complex information easier to organize and support more consistent operational monitoring.
6. Provides Historical Context
A solar dashboard can preserve and present historical information in an accessible format. Comparing current observations with earlier periods can help users understand whether a change appears normal, temporary, or worthy of additional investigation.
7. Supports Better Decisions
By presenting relevant information clearly, a solar dashboard can give users stronger context for operational decisions. It does not replace technical expertise, but it can help people recognize where further attention, analysis, or professional inspection may be appropriate.
Solar Dashboard for Future-Ready Energy Management
Solar energy management is becoming increasingly data-oriented. As installations grow and organizations rely more heavily on renewable energy, the ability to understand system information can become increasingly important.
A dashboard provides a foundation for that understanding.
However, future-ready design does not mean filling the interface with every available data point.
It means creating a system that can evolve.
A Solar System Dashboard may initially focus on basic monitoring but later need to support additional users or information sources. A Solar Web Dashboard may need to accommodate more remote users as a business expands its operations.
Similarly, Solar Generation Dashboards may need to handle a larger historical record as the installation remains operational over many years.
Flexibility should therefore be considered from the beginning.
The interface should be able to grow without becoming confusing.
This is particularly important for commercial installations, where a Solar Commercial PV System may become part of a broader energy-management strategy.
The dashboard can then serve as a practical information layer between the system and the people responsible for understanding it.
Build Your Solar Dashboard with MultiPurpose Themes
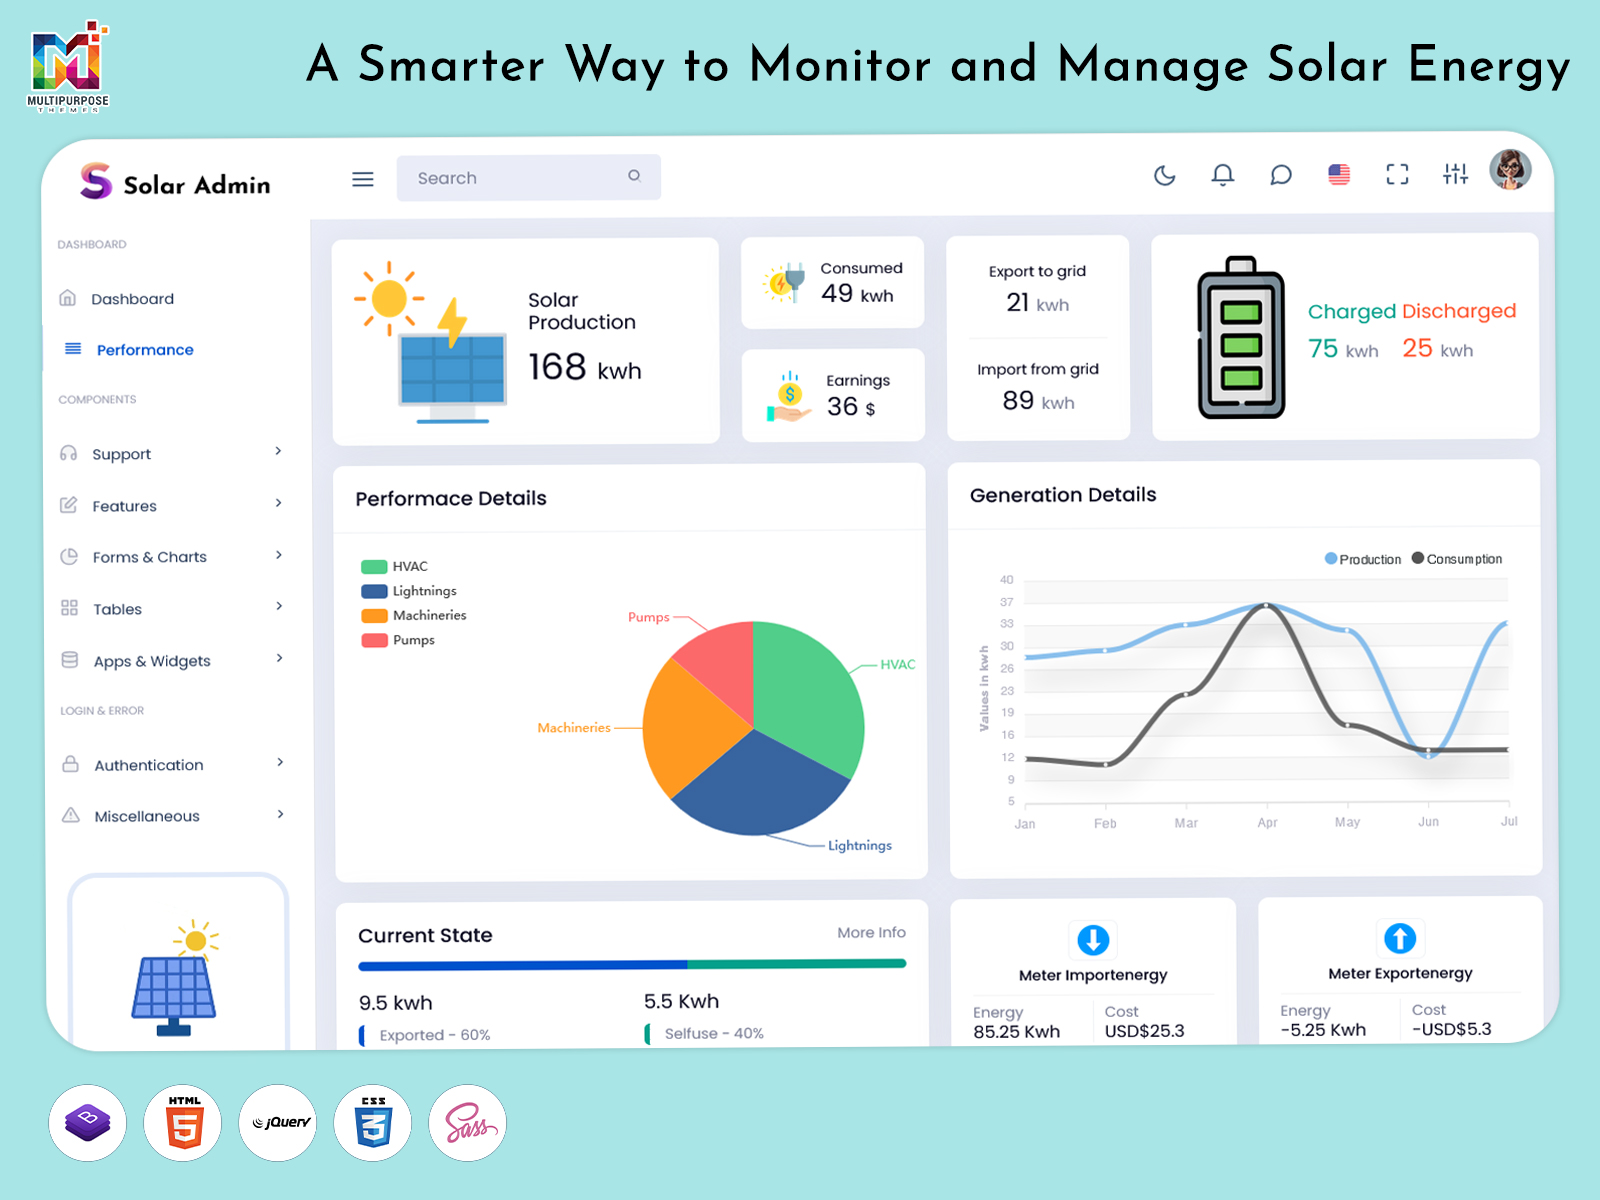
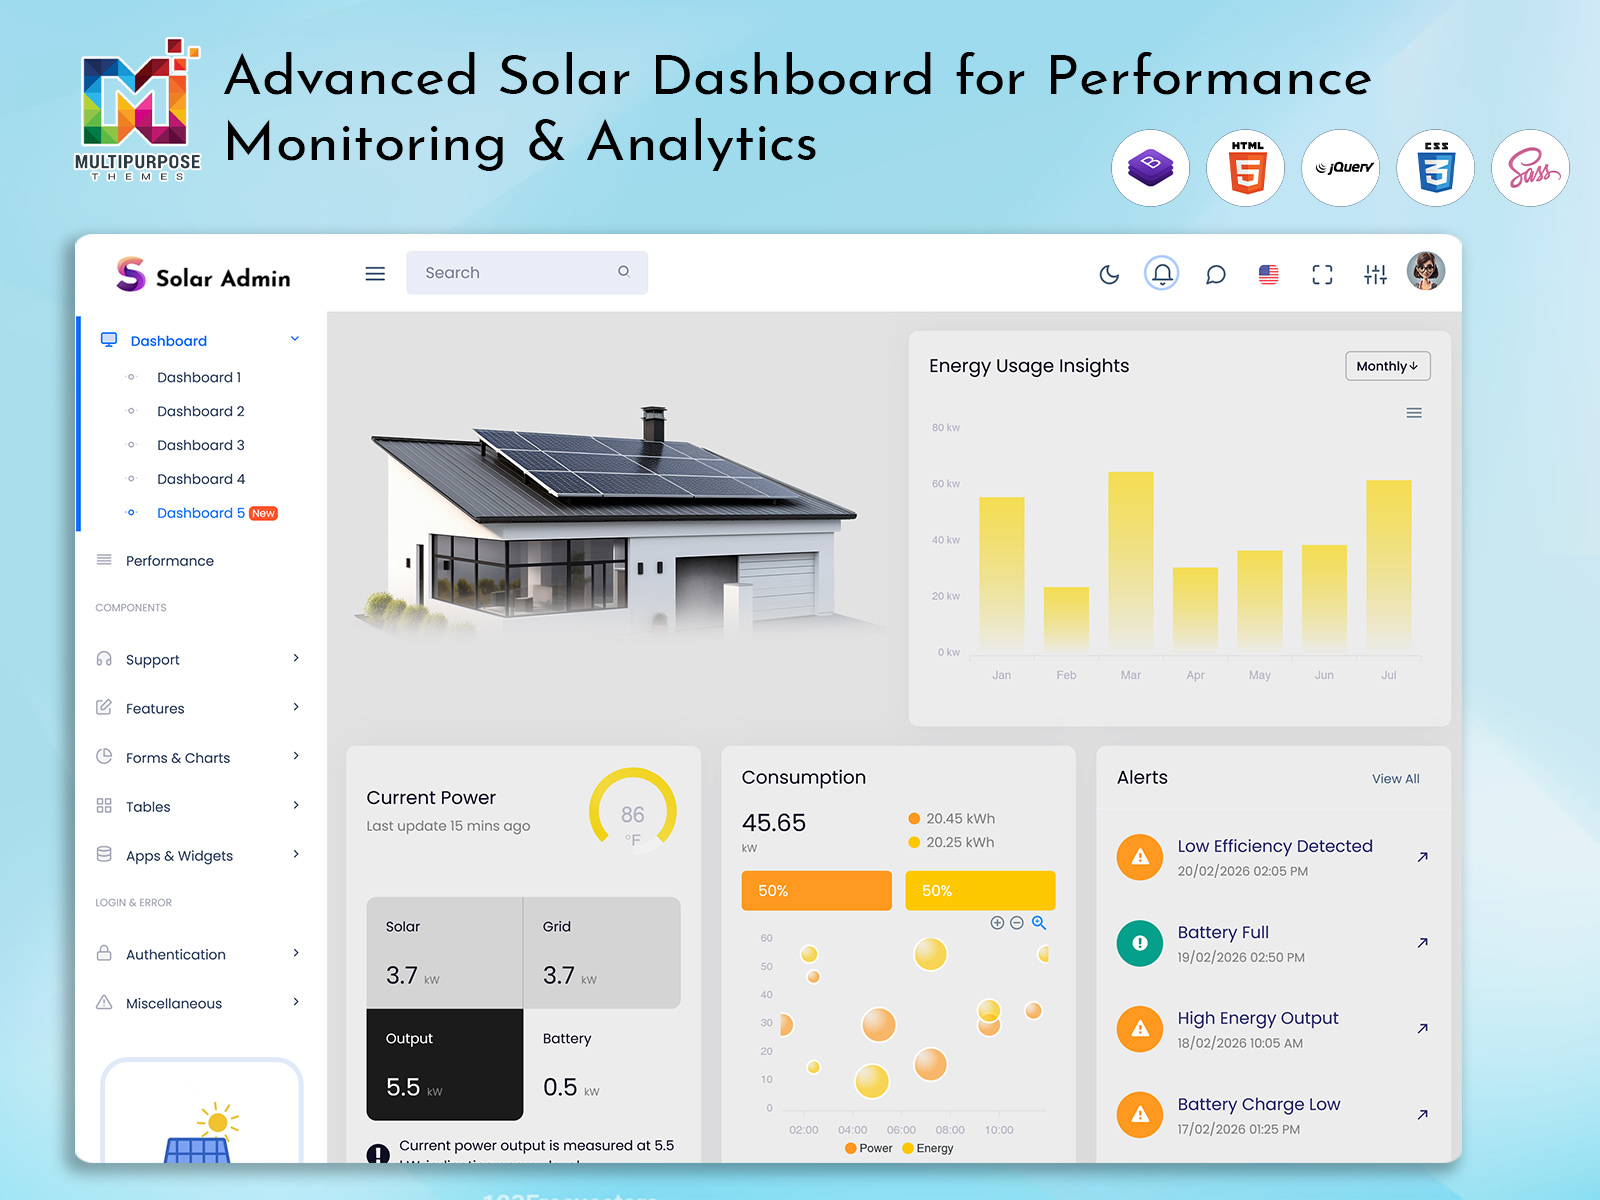
At MultiPurpose Themes, we create flexible admin templates that can be adapted to different project requirements, and our Solar Admin Template is designed with the same approach. It provides a ready-to-use foundation for building and customizing solar monitoring interfaces, with responsive layouts, multiple dashboard styles, charts, widgets, Light and Dark modes, RTL support, and flexible navigation options. The template is also designed to be easy to customize, allowing developers and businesses to adapt the interface to their branding, workflow, and specific monitoring requirements. Whether you are working on a Solar Generation Dashboard, Solar System Dashboard, or a broader Solar Web Dashboard, Solar Admin gives you a practical starting point that can be customized as your project evolves. We also provide documentation, updates, and support to help make the development and customization process easier.
Conclusion
A solar dashboard can make solar system information easier to understand, review, and use.
Solar Generation Dashboards can help users examine production information, while a Solar System Dashboard can provide a broader view of the installation. A Solar Web Dashboard can offer convenient browser-based access for authorized users, and dashboards designed for a Solar Commercial PV System can provide a more structured environment for larger installations.
The real value of a solar dashboard does not come from displaying the greatest number of figures.
It comes from presenting meaningful information in a way that helps people understand what is happening.
A homeowner may need a simple overview. A technical professional may require deeper information. A commercial manager may want a broader operational perspective.
The dashboard should respect these differences.
When designed around real users, clear information, historical context, flexible access, and practical decision-making, a solar dashboard can become much more than a monitoring screen.
It can become a dependable digital workspace for understanding how a solar installation behaves today, how it has behaved over time, and where further attention may be needed.
VIEW DEMO BUY NOW
Frequently Asked Questions
1. What is a solar dashboard used for?
A MultiPurpose Themes solar dashboard is used to organize information related to a solar energy installation in one digital interface. It can help users review system activity, understand generation information, compare different periods, and identify changes that may require additional attention or investigation.
2. What are Solar Generation Dashboards?
MultiPurpose Themes Solar Generation Dashboards are interfaces focused on presenting solar energy production information in an organized way. They can help users understand generation across different periods and recognize changes more easily than when information is reviewed through separate or manually prepared records.
3. Can a Solar System Dashboard be used for commercial installations?
Yes. A Solar System Dashboard can be designed for both smaller and larger installations. For commercial projects, the interface may need to accommodate more information, users, and operational requirements. The final structure should be determined by the size and purpose of the solar installation.
4. What is a Solar Web Dashboard?
A MultiPurpose Themes Solar Web Dashboard is a browser-based interface for viewing solar-related information. Depending on its implementation, authorized users may be able to access the dashboard from different locations and devices. Appropriate authentication and access controls should be considered when developing a web-based monitoring system.
5. Is a solar dashboard useful for a Solar Commercial Pv System?
Yes. A MultiPurpose Themes Solar Commercial PV System can generate substantial operational information, making an organized dashboard useful for reviewing system activity. A commercial dashboard can be designed around the needs of facility managers, technical teams, maintenance personnel, and other authorized users.
6. Can a solar dashboard show historical information?
Yes. A dashboard can be designed to present historical solar information so users can compare current observations with previous periods. Historical context can be particularly useful when someone notices a change and wants to determine whether it appears unusual or part of normal variation.
7. What should I consider when choosing a solar dashboard?
Consider who will use the dashboard, what information they require, whether remote access is needed, how much customization is possible, and whether the interface works across different screen sizes. Developers should also review framework compatibility, integration options, security requirements, and scalability before selecting a solution.

Related Posts

This Post Has 0 Comments