

What Is a Solar Dashboard? A Solar Dashboard is a screen that arranges and shows…
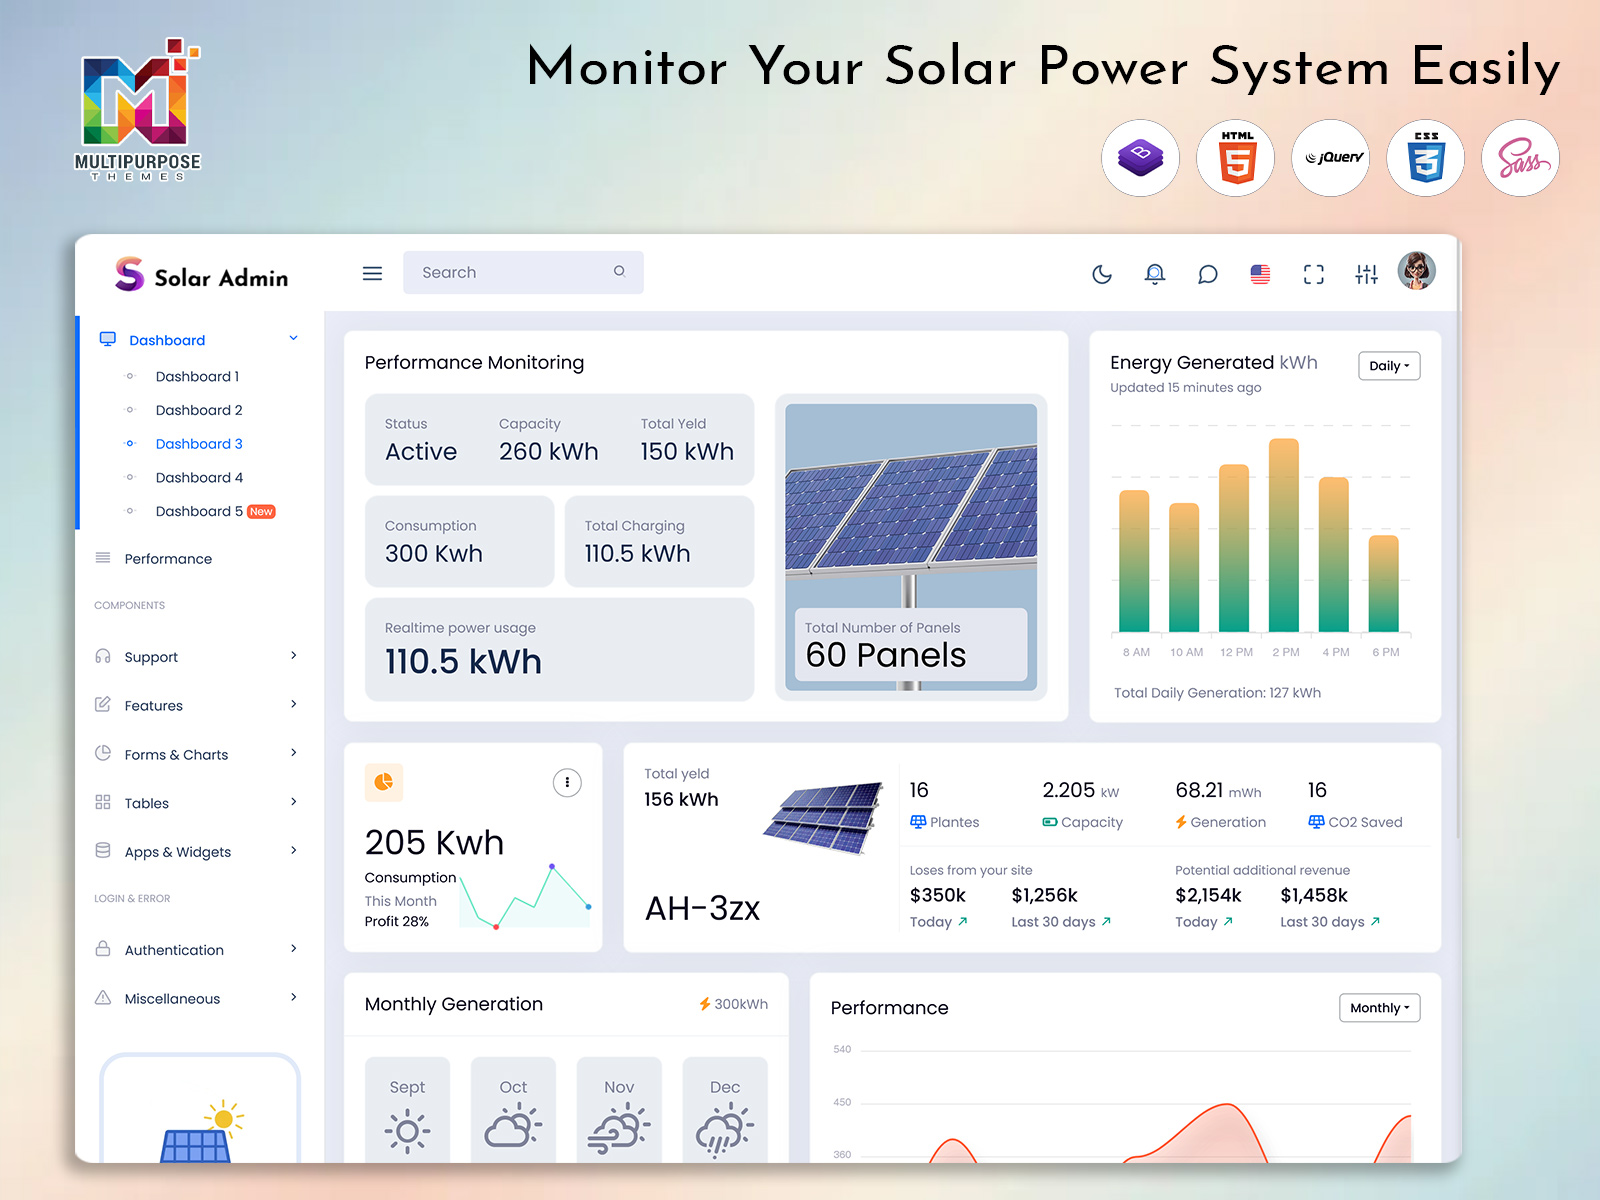
Solar Modern Dashboards: Monitor Your Solar Power System Easily
Reading Time: 9 minutes
With solar becoming a real consideration for many homes and businesses looking to adopt a more sustainable source of electricity, monitoring will become increasingly important. Solar Modern Dashboards provide a means to get a clear and organised view of your solar data.
Watch Full Video
Having a dashboard can provide you with a way to see how much electricity you are generating, consuming, details of how your system is performing and more. Having a good dashboard can help you understand your data better whether you are managing your installation or have a large commercial solar project.
Solar Modern Dashboards
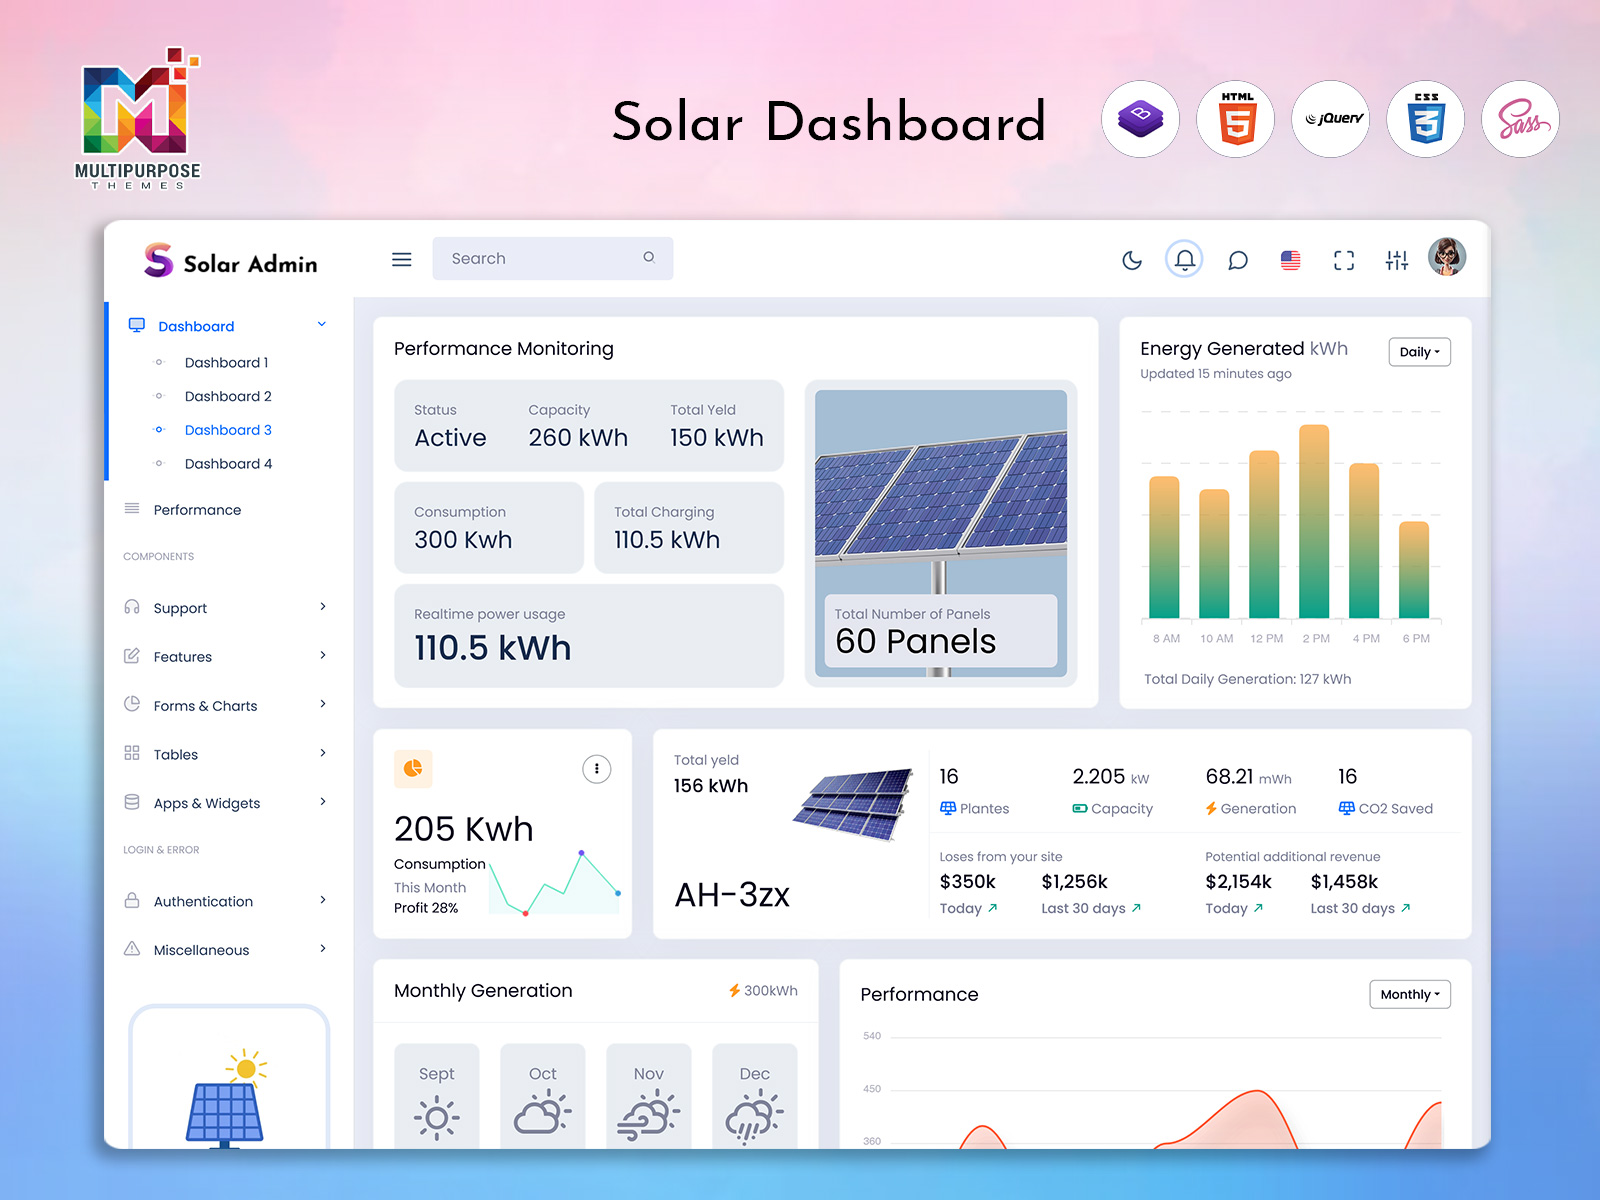
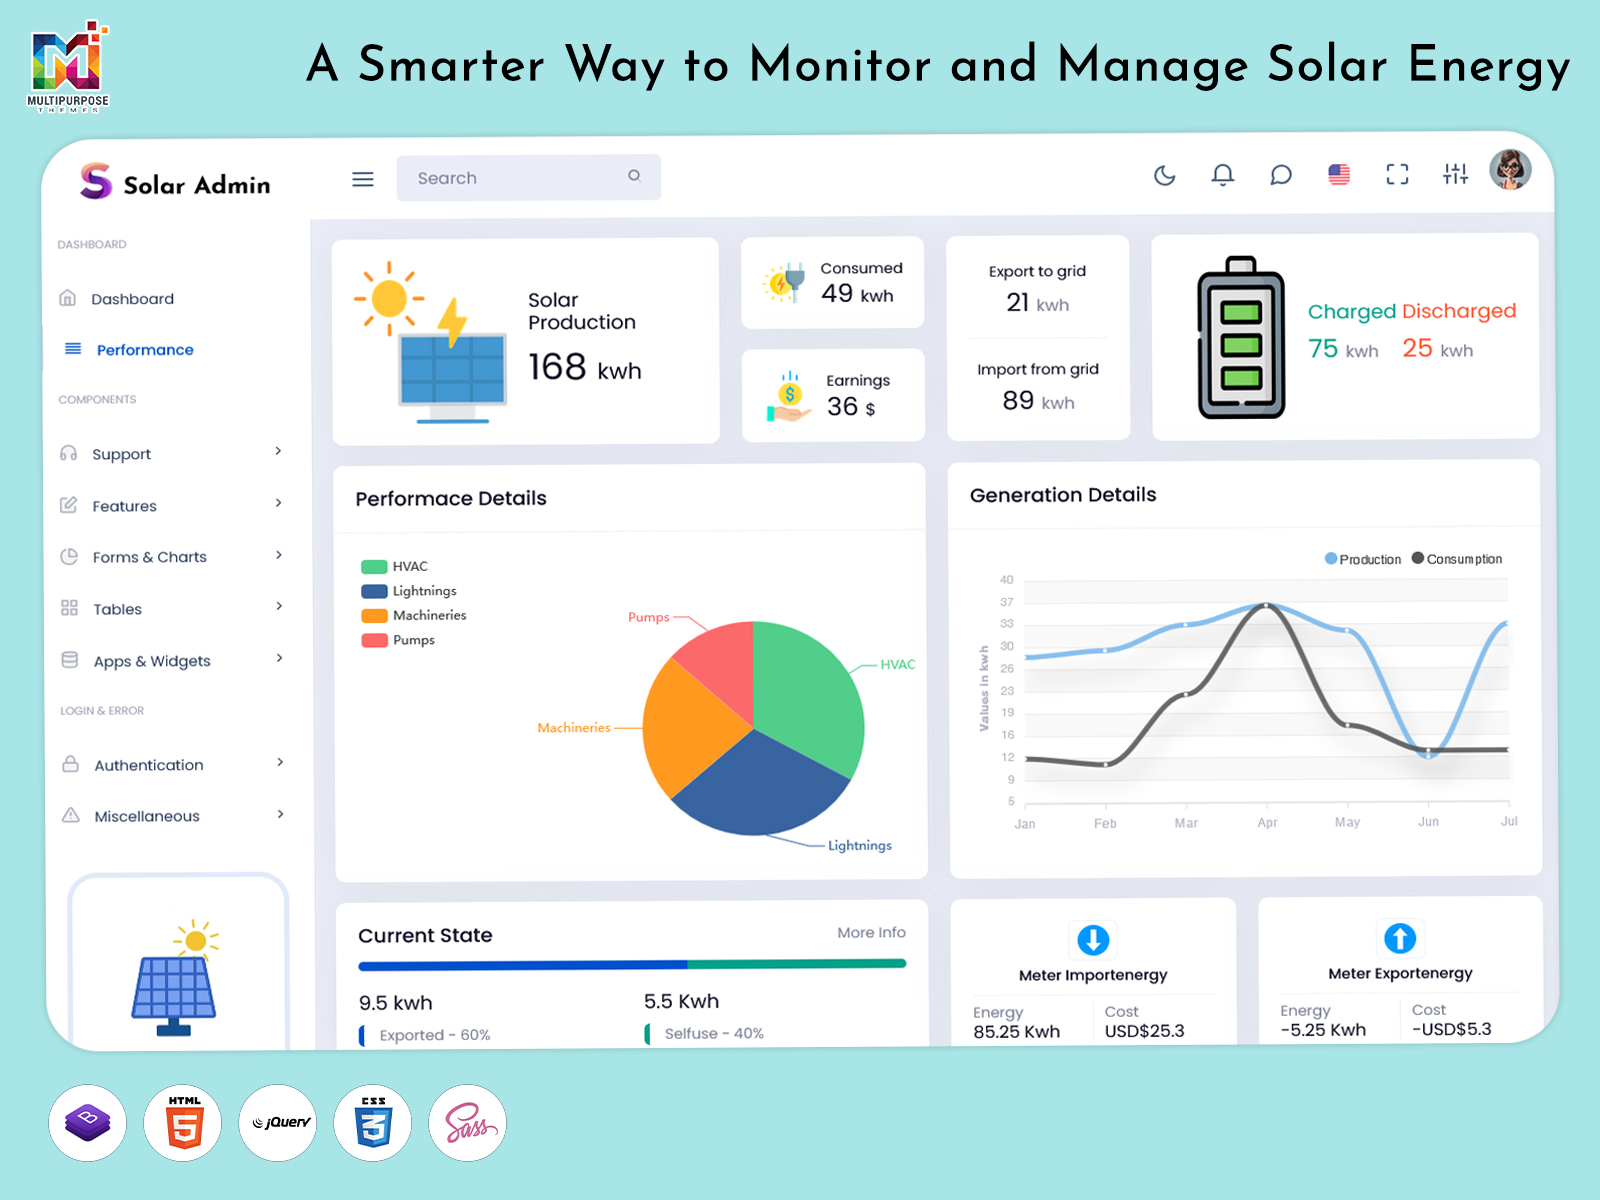
Solar Modern Dashboards provide a way to view important solar data with charts, graphs and cards summarising your solar generation and performance.
Using a dashboard you can get an overview of your solar generation, consumption, performance and more. Having a good dashboard can help you understand your solar data better depending on what you are managing.
What are Solar Modern Dashboards?
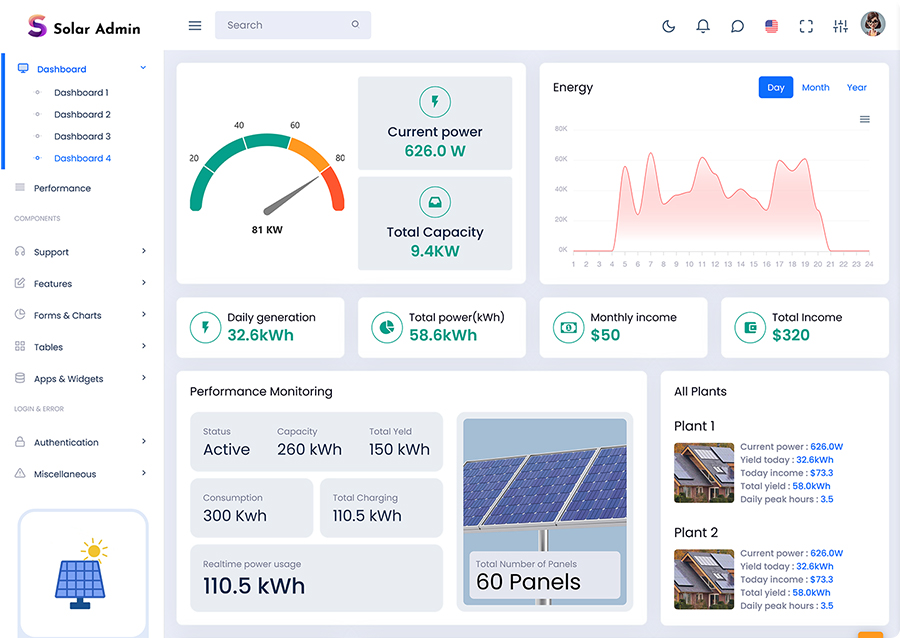
Solar Modern Dashboards are interfaces which can provide you with an overview of important data relating to your solar generation and performance. This will provide you with charts, graphs and cards to display your data.
You can view important data in one place using a dashboard. This may include energy generation, historic generation, consumption and equipment status depending on your system and available data.
Solar Modern Dashboards can help many including homeowners, installers, facility managers and businesses.
VIEW DEMO BUY NOW
Why is a Solar System Monitoring App useful?
A Solar System Monitoring App will provide you with a way to view information relating to your installation. The use of the monitoring application makes it easier to understand how the monitoring application monitors the system performance.
For example, a homeowner may want to know how much electricity they are generating using their solar panels. A commercial facility manager may want to compare how much they are generating at certain times.
A monitoring app can provide you with an organised view of your data.
Some useful features include:
- Performance – View solar generation and see how your system is performing.
- Tracking – See how much electricity your system is producing.
- Historic – Compare data between days, months and more.
- Overview – See equipment information and status if available.
- Easy to access – Have access to solar information using a compatible web or mobile interface.
Depending on the equipment you are using to monitor your data.
Top Features Of A Modern Solar Dashboard
The task of accessing and understanding relevant data through your dashboard should not be difficult for you.
1. Real Time Solar Monitoring
The amount of solar energy produced throughout the day will vary depending on sunlight, weather and other factors. Having a dashboard can provide you with an overview of the data you have.
If your monitoring platform provides you with real time updates you can see how your energy generation is changing.
2. Energy Generation Analysis
By having analysis of your energy generation you can understand how much electricity your installation is generating. Using charts and graphs can help provide you with an easy way to see any patterns.
For example, seeing how much you are generating per month. This can help you see any changes.
3. Solar Performance
Having key performance indicators can help summarise your data.
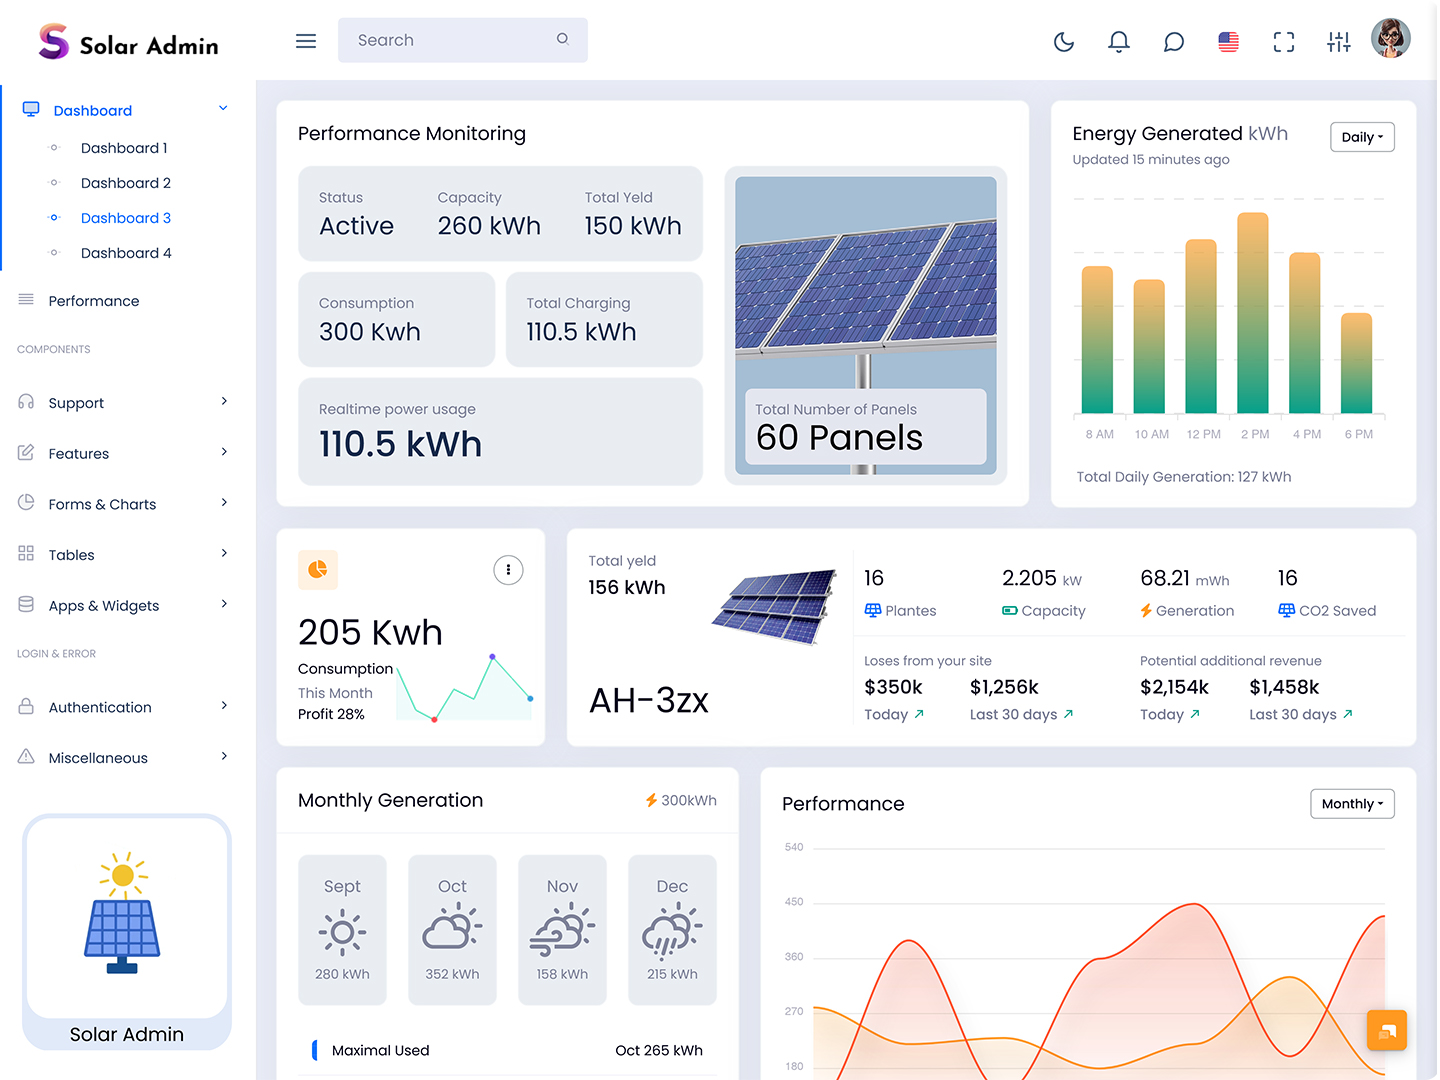
Your dashboard can provide you with the following data:
- Total generation.
- Current generation.
- Generation per month.
- Consumption (if data is available).
- Availability or equipment status (if available).
- Savings or impact (if calculations have been made with the right data and assumptions).
Make sure your KPIs have labels and units attached.
4. Historical Data
My past records help me see how I have performed over time.
I can compare my performance with my performance.
The dashboard makes it easier for me to keep track of information.
I can organize information by day, week or year. This way you get a view of your progress.
This can help you see any patterns in your generation. Having clear reports can also help businesses provide management teams with an understanding of their solar performance.
5. Responsive Dashboard
Users of your solar system may want to view information from a desktop, tablet or mobile. Having a responsive dashboard will mean your dashboard will fit to the size of the screen. Your dashboard should have a friendly interface with the most important data available. Charts should be easy to read and navigation simple.
6. Solar System App
A Solar System App can help you interact with information or services relating to your power installation. Depending on your platform you can have energy monitoring, generation reports, equipment information and notifications.
Solar System Apps can be designed for users wanting to understand their electricity generation or for businesses managing larger installations. Some apps can be used by installers to help them see information relating to their system.
The main purpose of a Solar System App is to make it easier to find solar related information. Clear data is a tool. Clear data shows how your system performs. Sorting out the data gives me the chance to identify what succeeds and what fails.
VIEW DEMO BUY NOW
How Does A Solar Power System Dashboard Work?
A Solar Power System dashboard usually displays data collected from monitoring equipment, inverters, meters or other sources. This will be processed by your monitoring platform.
A monitoring process may include:
- Data collection – Information is collected by compatible equipment.
- Data processing – Data is organised by your monitoring platform.
- Dashboard – Data is displayed in charts, graphs and cards.
- Performance – You can see how much you are generating and compare your data.
- Action – If there are any unusual readings you can see why and contact a qualified service professional.
Depending on your equipment, software and monitoring.
Benefits Of Monitoring Your Solar Power System
Monitoring your system can help you understand your installations better.
1. Understand Energy Generation
The presence of a dashboard will allow you to know very clearly the amount of power that your installation produces in a particular period of time.
2. Compare Performance
Comparing data can help you see any changes in your energy generation. This could be due to sunlight, weather, equipment and more. Further investigation may be needed.
3. Reports
Having a central place to find your solar performance can help. Instead of looking at individual records you can view organised reports.
4. Informed Energy Decisions
The knowledge of how much you are producing and using will help you make wise choices regarding energy consumption. Businesses can use this information to help them review their requirements whilst homeowners can understand how their solar installation is helping them.
5. Increased Visibility Of Installations
If you are managing solar installations within an organisation having a dashboard can help. If your monitoring platform can provide you with data organised by site/system you can easily see your performance.
Who Can Benefit From Solar Modern Dashboards?
Depending on the size of your installation and what information you need to review a dashboard can help:
- Homeowners – View solar generation and understand how your system is performing.
- Commercial Businesses – Monitor generation across your business and view reports.
- Solar Installers – View information if your monitoring platform provides you with the right tools and permissions.
- Facility Managers – View energy generation and consumption.
- Solar Project Operators – View organised performance data if they are monitoring multiple sites.
- Energy Consultants – Use solar data to help review energy performance.
A dashboard will be most useful if it provides the right information and features.
Top Tips For Choosing A Solar Dashboard UI
The UI of your dashboard can help you interact with your solar data. Whilst a dashboard may provide you with information having a confusing layout may make it difficult to understand.
Consider the following:
- Simple layout – Place the most important energy data in an easy to find place.
- Easy to read charts – Choose charts and graphs to help you understand any patterns in your generation.
- Important metrics – Use cards to highlight important data such as total generation and current generation.
- Device Compatibility – It must be compatible with desktops, tablet, and cell phones.
- Historical reports – Provide options to view generation over certain periods.
- Clear units – Make sure units and explanations are clear.
- Consider users – Provide views for homeowners, administrators, operators or others.
- Easy to understand – Present information, in a way that’s easy to understand. Make sure the data is clear and simple. Use language. Keep things to understand. Show the data in a way that anyone can understand the data. Keep the data simple. Make the data easy to follow. Stay clear and straightforward.
Designing your dashboard with care can help make it easier to navigate.
Solar Dashboards And Energy Management
Having a dashboard can help with energy management if you have the correct data sources.
For example if you are a business you can compare your generation against your electricity consumption to understand how much you are meeting through solar. If your system provides you with data relating to importing, exporting or storing from the grid you may gain an understanding of your energy usage.
Whilst this can help with planning and reviewing your performance a dashboard will not automatically improve your generation or ensure you save on your electricity. It can help provide information in a way that can be interpreted.
Why Choose A Modern Solar Dashboard Interface?
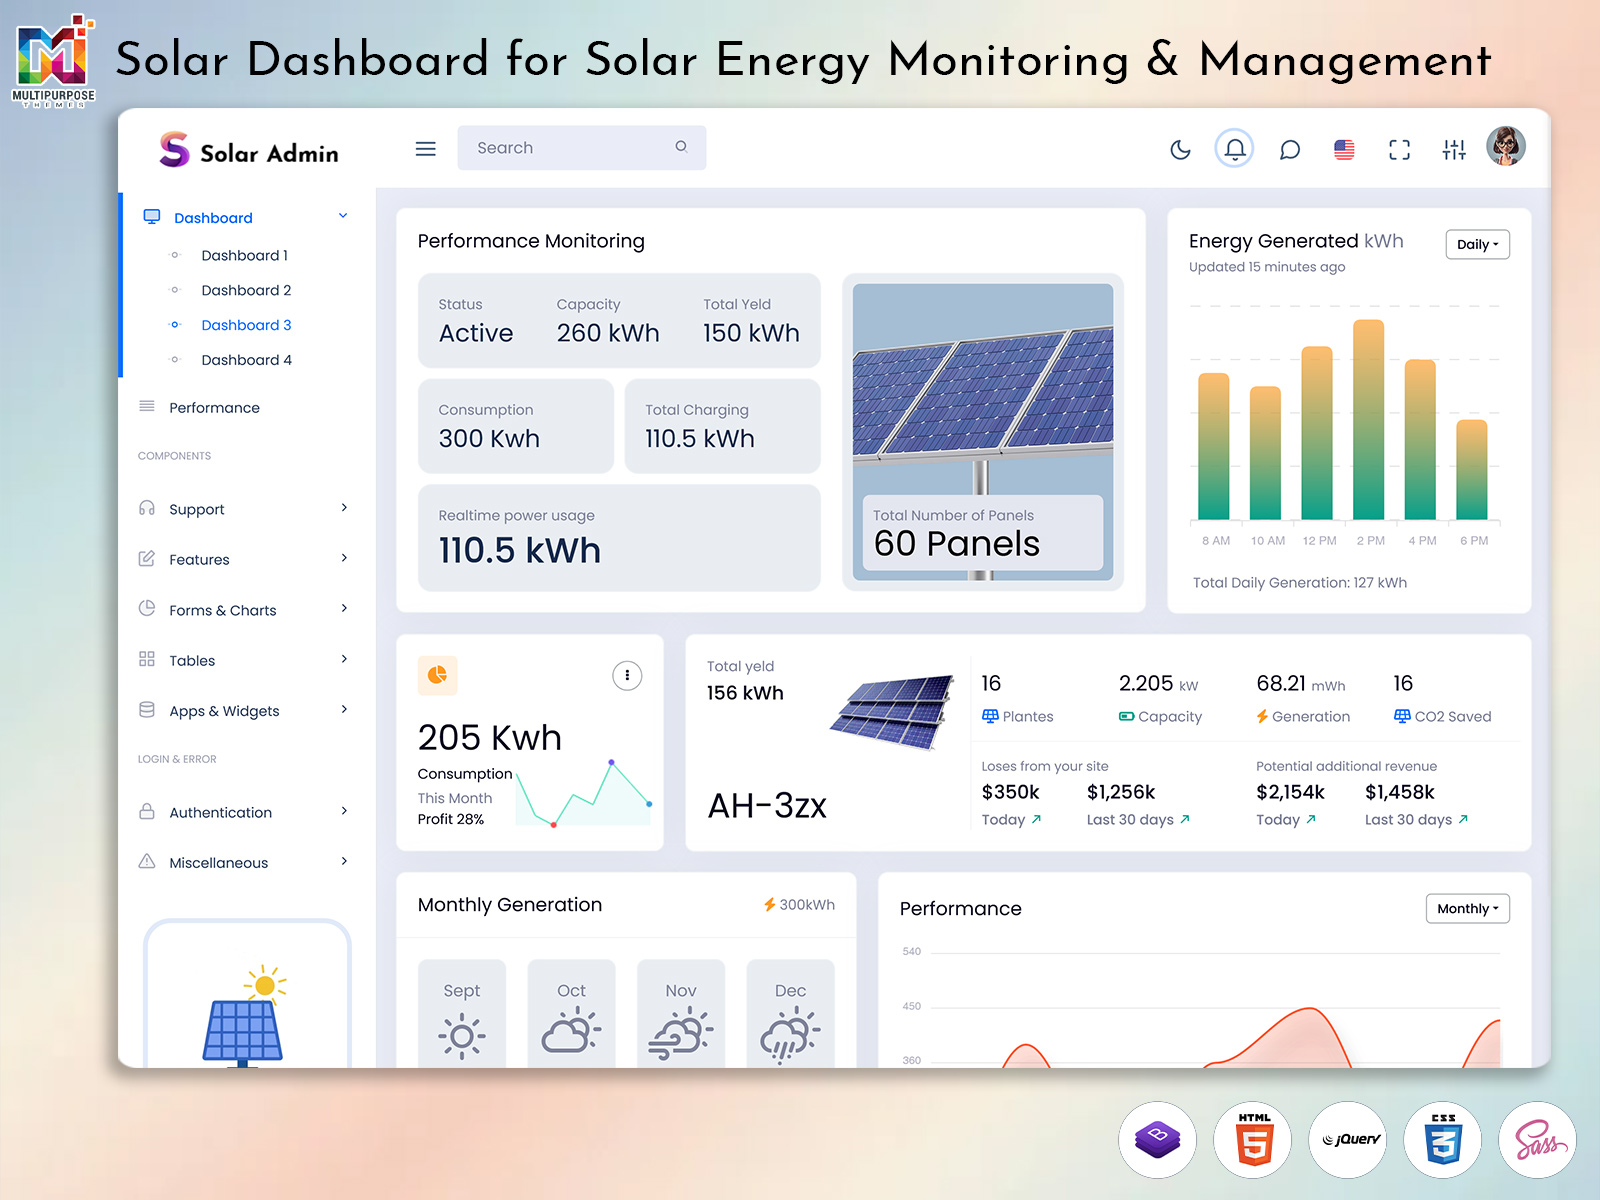
A modern solar dashboard interface can show you information in an easy-to-follow way. This makes it simpler to see how your solar system is working. You can check performance details at a glance. It helps you keep track of energy production. You get a view of your system’s health and output. This way you can make decisions, about your energy use.
Having organised cards, easy to read charts, responsive design and easy navigation can help you find your solar information. Customisable views can also help different users focus on the important data. It means that everyone gets to identify what is important to him or her personally. The data becomes easier to interpret and process. Users get to change the way things look depending on their needs. Some might want to see numbers others might prefer charts or graphs. The same data can be shown in ways. This helps everyone work better. It also saves time because users do not have to search through everything. They see what they need. It makes the system more useful, for everyone.
A good interface for your dashboard could also enable you to achieve a professional and user-friendly method for presenting the information contained within it. It is important that your dashboard includes the capabilities of your monitoring platforms and those of your users.
Conclusion
Solar Modern Dashboards can help you organise your solar energy information. Having a dashboard can help you understand how your system is performing. Having a dashboard can help you view your generation data, historic reports, performance and more in one place. This can help homeowners, businesses and solar professionals effectively review their installations.
Having the right Solar System Monitoring App or Solar System App can help you easily access your information. Having a well designed Solar Power System dashboard can help you have clear reports and make informed decisions regarding your energy.
When considering monitoring interfaces focus on providing accurate information, useful features, responsive and easy to navigate.
VIEW DEMO BUY NOW
FAQs
1. What Are Solar Modern Dashboards?
Multipurpose Themes Solar Modern Dashboards are interfaces that display information relating to your solar generation, performance and other available data. This includes charts, graphs and cards.
2. What Is A Solar System Monitoring App?
A Solar System Monitoring App provides you with a way to view information relating to your installation. This is dependent on its capability since it might give you information regarding the process of generation, history, and the status of the equipment.
3. What Is The Difference Between A Solar System App And A Solar Dashboard?
A Multipurpose Themes Solar System App provides you with solar related features. A Solar Dashboard provides you with a way to view and understand information. A solar app may have a dashboard as one of its features.
4. What Information Can Be Found On A Solar Power System Dashboard?
Energy generation, current generation, generation history, consumption, performance metrics, and equipment status can be seen depending on the equipment and software used for monitoring.
5. Can I Access A Solar Dashboard On Devices?
Yes, if your platform provides you with a compatible mobile app or responsive web interface. The features available will depend on your solution.
6. Who Should Use A Solar System Monitoring App?
Homeowners, commercial businesses, facility managers, solar installers and solar project operators can benefit from monitoring if the features provided suit their requirements.
7. Why Is Solar Energy Monitoring Useful?
Multipurpose Themes Solar monitoring can help you view your energy generation, compare performance and understand any changes. This can help you review your maintenance and make informed decisions.
8. What Features Should A Good Solar Dashboard Have?
Useful features may include generation summaries, charts, historic reports, key performance indicators, easy navigation, responsive design and system information.
9. Can A Solar Power System Dashboard Help Me Save On Electricity Costs?
A Multipurpose Themes dashboard can help you understand how much you are generating and consuming. This may help you make informed decisions regarding your energy usage. Actual savings will depend on factors such as system performance, energy usage, tariffs and installation costs.
10. How Do I Choose The Right Solar Dashboard UI?
Look for a dashboard with an easy to read layout, relevant performance data, responsive design and features that suit your monitoring requirements. Consider what data sources and equipment you need your dashboard to support.

Related Posts

This Post Has 0 Comments