Managing crypto is not just about buying and selling coins. It is about having the…
How to create a great Dashboard from an Ethereum Dashboard Template
Reading Time: 3 minutes
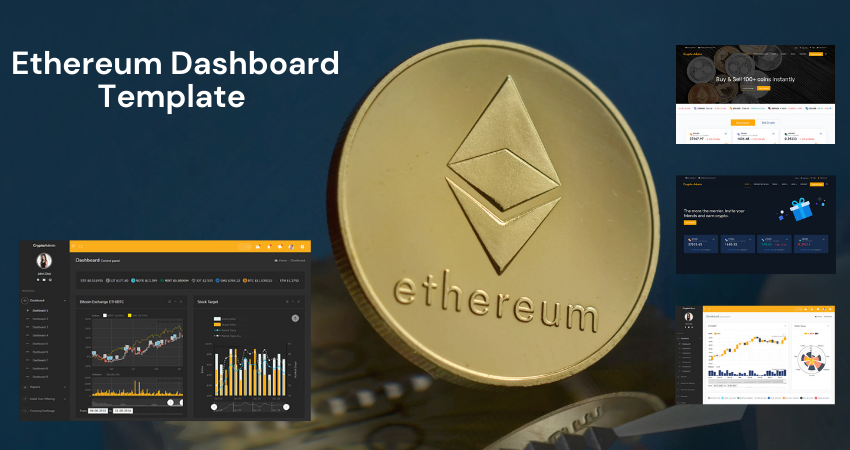
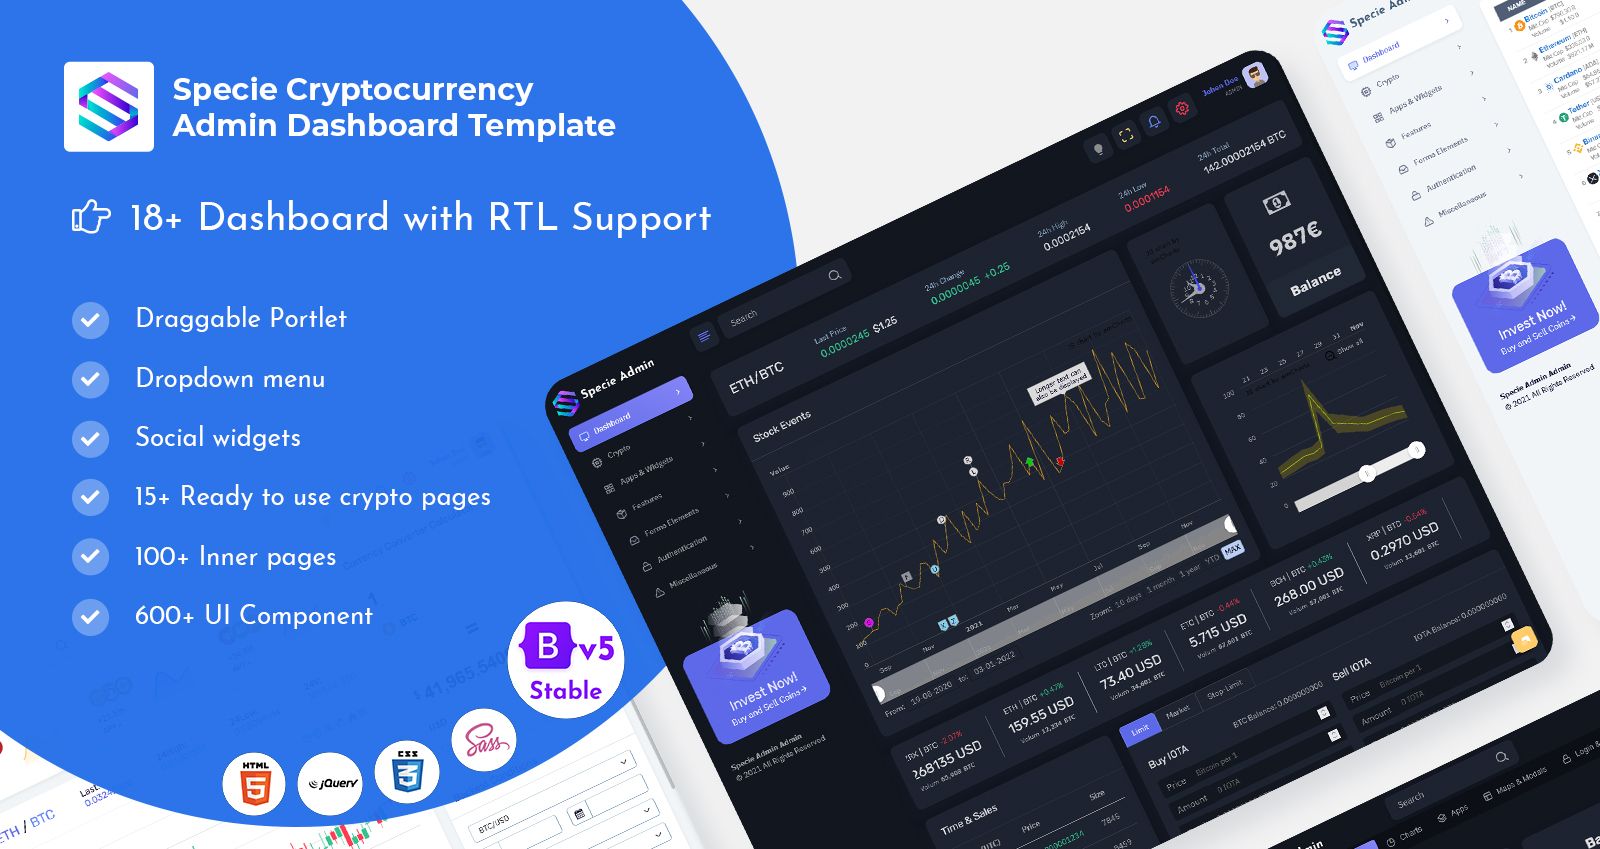
Are you working on a project that involves wallet crypto cards? Then you should think about getting hold of the best Ethereum Dashboard Template available out there to consider. By using an Ethereum admin template, you can overcome most of the work that you have to do. That’s because you are getting hold of a template that works perfectly well for your needs. While keeping that in mind, let’s learn more on how to customize your Bitcoin Dashboard Theme.
Define the dashboard’s purpose.
The Admin Dashboard, like every other view in your product, is designed to fulfill a particular function. If you get this incorrect, all of your other efforts will be for nothing. Dashboards may be classified in a variety of ways depending on their intended use.
Select the appropriate data representation.
When we speak about dashboards, we’re talking about charts. Data visualization is a difficult undertaking, particularly when you want to show different kinds of data on a Bootstrap Admin Dashboard, whether static or dynamic changes over time. This may be a difficult task. By selecting the incorrect chart style or defaulting to the most prevalent kind of data visualization, you risk confusing consumers or misinterpreting data. Take a look at internal records and reports to obtain some ideas before you start.
Use clear and consistent naming standards and date formatting, as well as truncating huge numbers.
Because the dashboard’s primary purpose is to convey the information in a single look, every detail matters. The most significant advantage of utilizing a well-defined framework is data consistency. It will be simpler for you to utilize those tools if your data is titled the same manner in each one. There is just one framework. There are no questions.
Establish the layout and flow of the project
Grids may help you construct a basic framework or skeleton for your design and achieve excellent alignment and uniformity with minimum effort. They are made up of “invisible” lines on which you may arrange your design components. This connects them together in a “system” and logically supports your composition. This is critical for Dashboard Design since you’ll need to arrange a lot of data in a logical manner.
Make use of construction components having a recognizable structure.
We can begin working with several “widgets” that will house the information, charts, and controls once we’ve set the grid. It’s simple to organize cards. The most essential aspect of cards is that they may be manipulated virtually indefinitely. Cards are an excellent option for responsive design because they operate as content containers that scale up and down effortlessly.
Increase your margins by double.
The region between pieces in a design composition is known as white space, sometimes known as negative space. The value of negative space is often overlooked by readers, but designers pay close attention to it. A copy will be difficult to read if the white space is not balanced. As a result, negative space is just as important as any other typographic feature.
Personalize it
Users want the material they see to be tailored to their specific requirements. Personalization and customization are two methods for ensuring that consumers see what is important to them.
The system is in charge of personalization. The system should be set up to recognize users and give material, experiences, or functionality that is appropriate for their position. The user is in charge of personalization. By setting the layout, content, or system functioning, a system may allow users to personalize or adapt the experience to match their individual requirements.
Make it interactive
When you need to display a lot of data for a big number of objects, a data table is an excellent option. A data table, for example, would be the ideal way to present a list of customers with their ID, status, contacts, latest action, and so on. There are several more advantages: it makes efficient use of space, allows for simple scaling and development, and users are often comfortable dealing with grids since many people are already familiar with Microsoft Excel. It’s a simple method of locating and altering things. In this post, you may learn more about data tables.
Keep these facts in mind and go ahead with creating that perfect Ethereum Dashboard. You will fall in love with the results.
Related Posts