
In today’s fast-moving digital world, education is no longer limited to classrooms and physical books.…
Why Your LMS Dashboard Looks Like a 1990s Spreadsheet (And How to Fix It)
Reading Time: 4 minutes
Picture this: You log into your learning platform, excited to check student progress. Instead of insights, you’re greeted by a wall of numbers that would make an accountant cry. Welcome to the world of poorly designed learning management system LMS Dashboard.
Here’s the truth nobody talks about. Most educational technology looks terrible. We’ve spent billions building online learning platforms, yet many LMS dashboards still resemble Excel sheets from the dial-up era. It’s time we fix that.
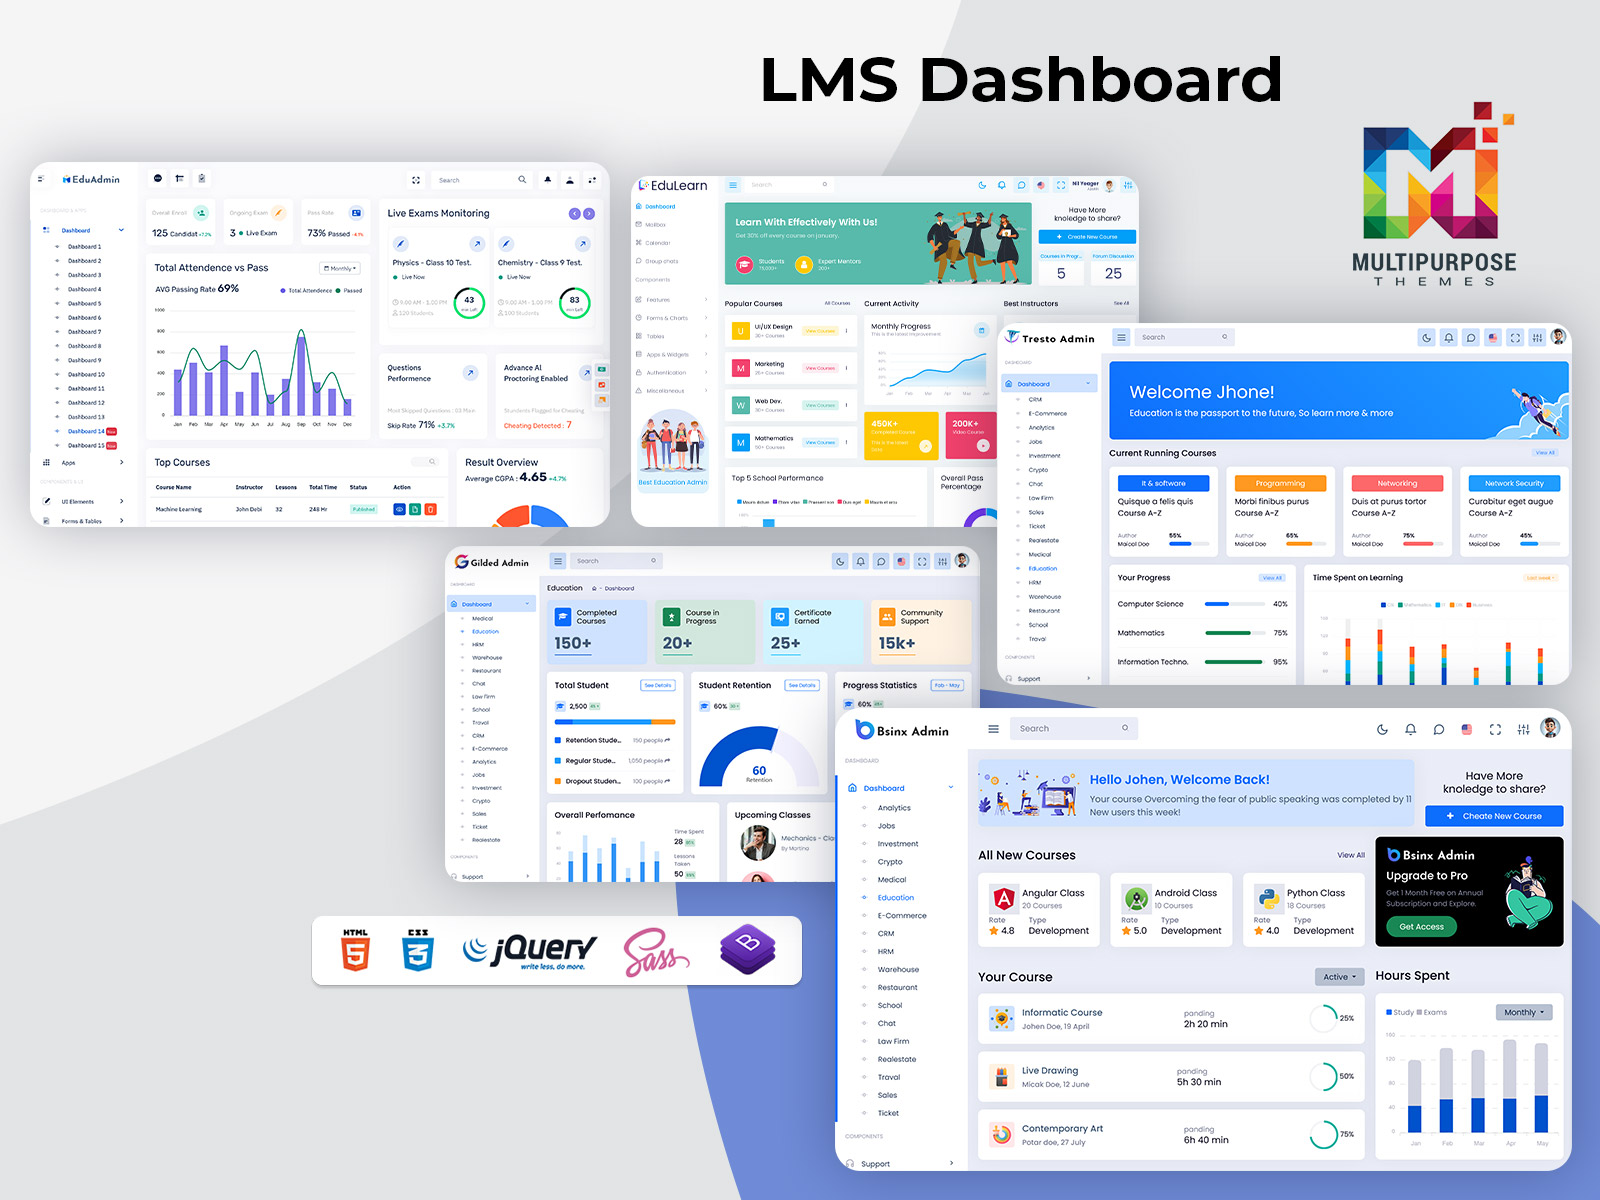
Explore LMS Dashboards of Admin Templates
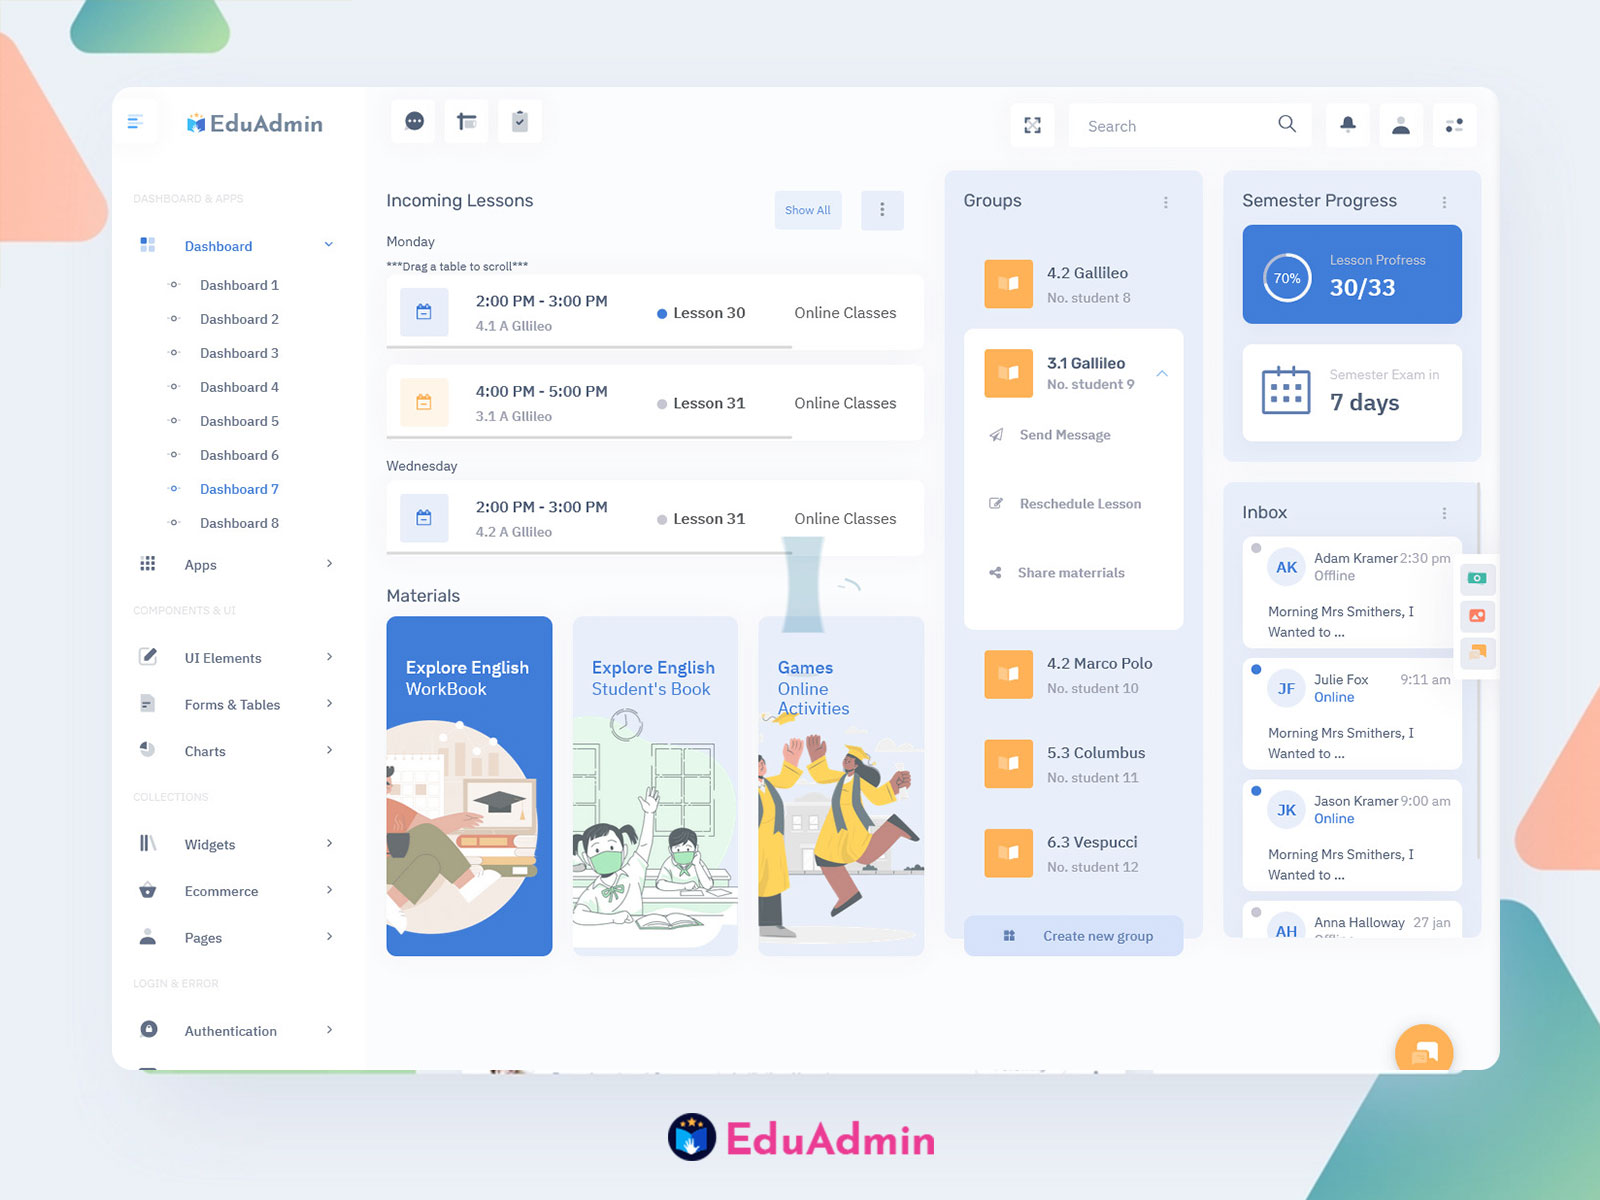
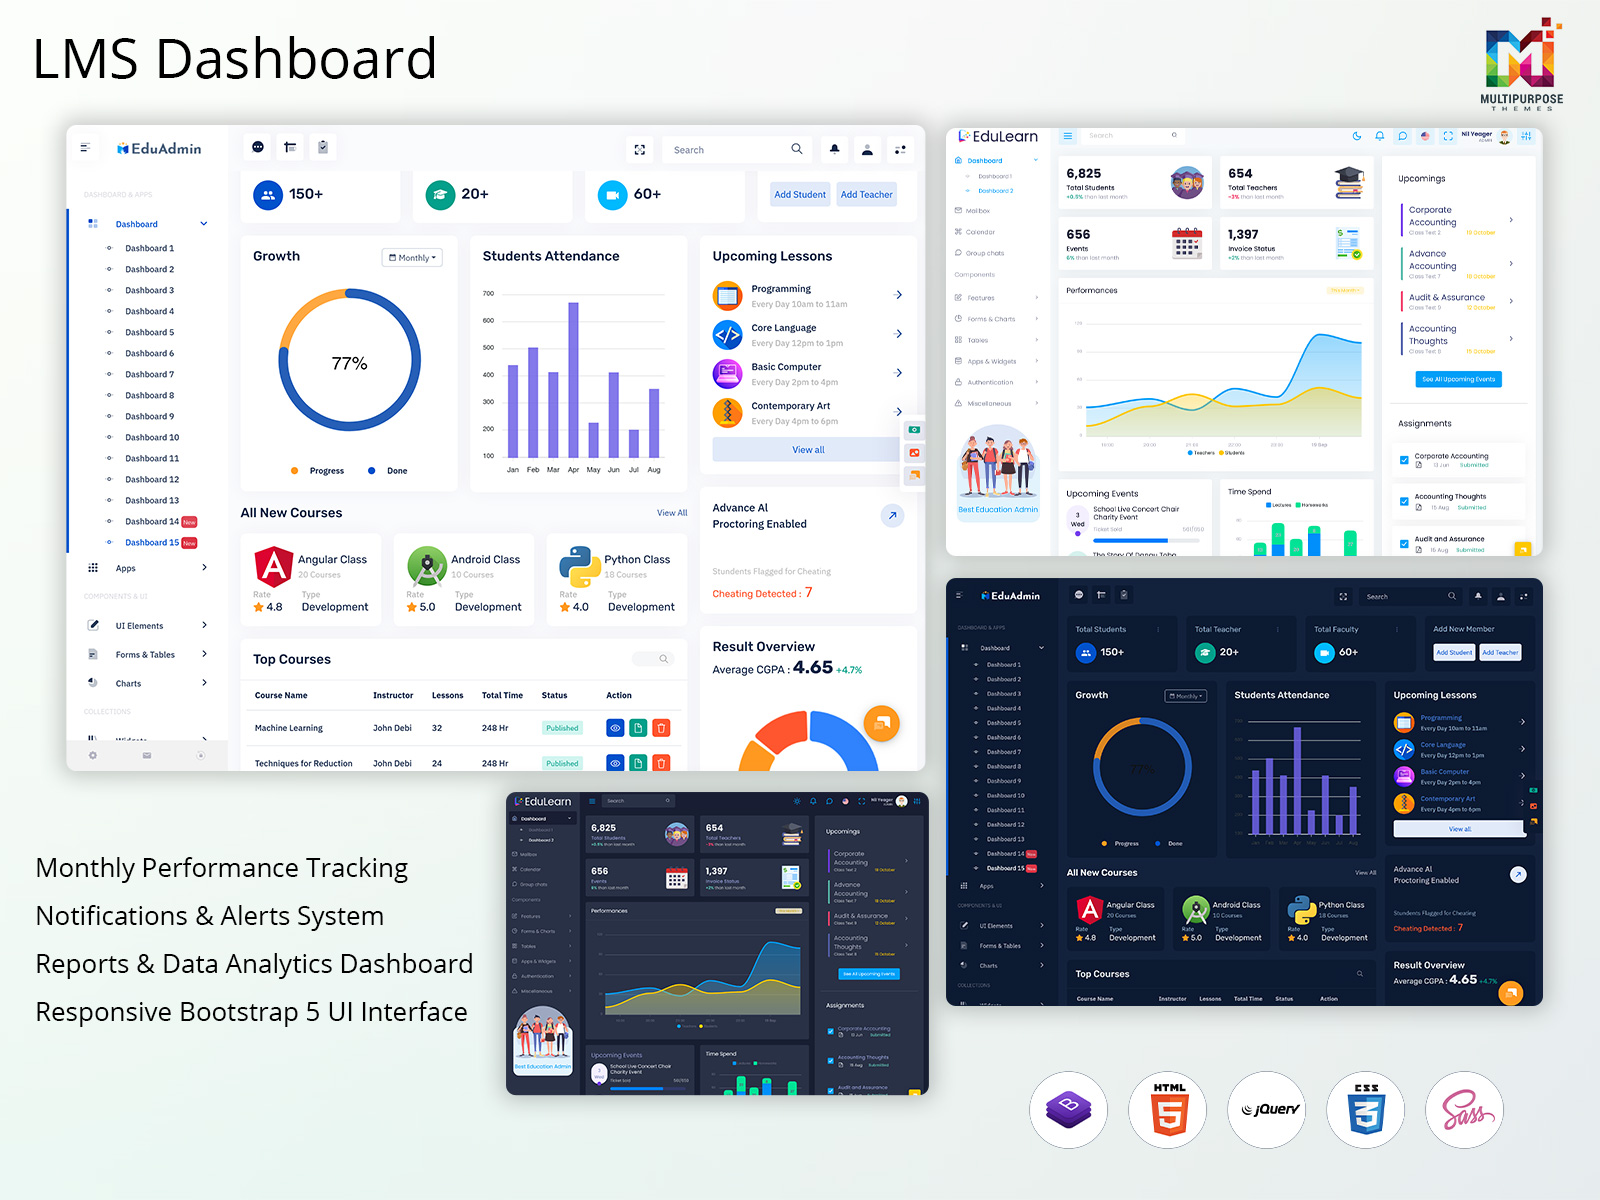
EduAdmin – LMS Dashboard
BUY NOW DEMO
EduLearn Admin – Education Dashboard
BUY NOW DEMO
Gilded Admin – Learning Dashboard
BUY NOW DEMO
Tresto Admin – Online Course Dashboard
BUY NOW DEMO
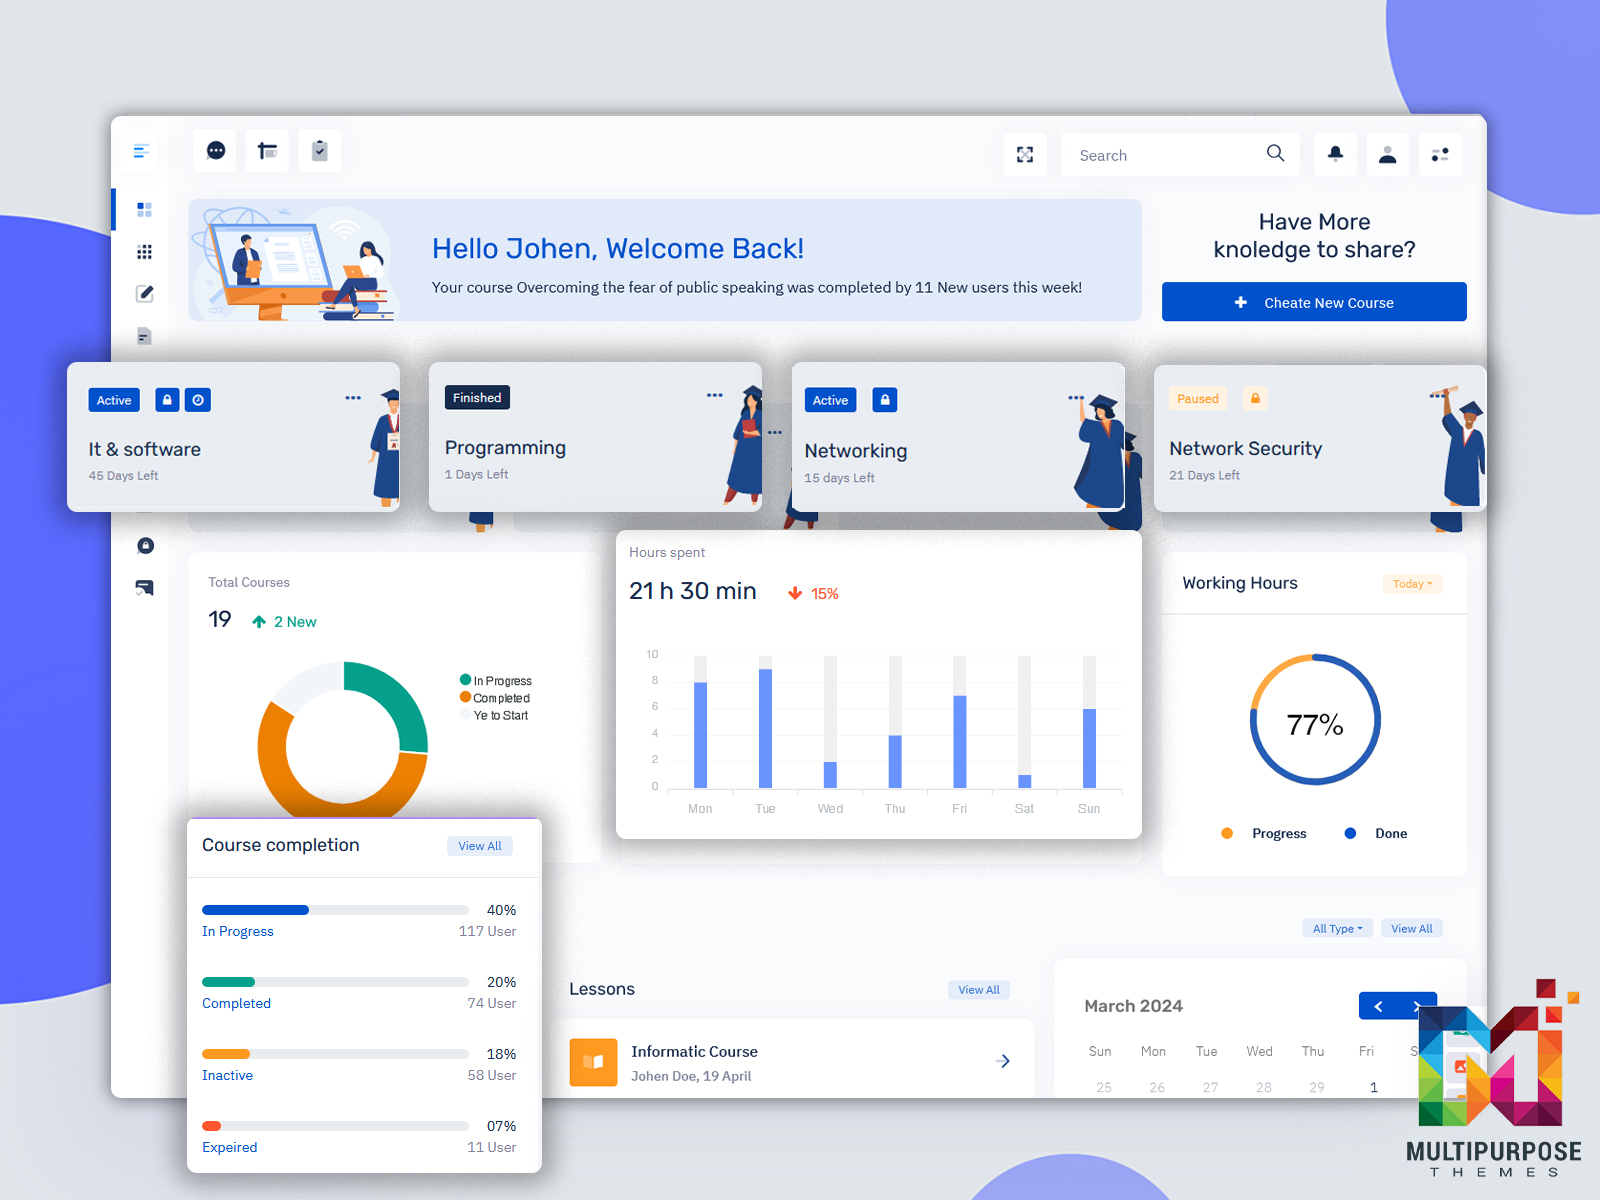
BsinX Admin – Elearning Dashboard
BUY NOW DEMO
The Dashboard Problem We’re Not Addressing
Learning platforms have exploded in popularity. Schools, companies, and independent educators rushed to digitize their courses. But in this race to go online, something critical got lost: user experience.
Your LMS dashboard should be your command center. It’s where you track learner progress, spot struggling students, and measure course effectiveness. Instead, many educators face cluttered interfaces that hide important data behind endless clicks and confusing menus.
The numbers tell the story. Research shows that instructors spend up to 40% of their administrative time just trying to find information in their learning platforms. That’s time stolen from actual teaching.
What Makes a Great Online Course Dashboard
Let’s talk about what actually works. The best learning management system dashboard designs share three core principles: clarity, speed, and actionability.
Clarity means your most important metrics live front and center. When you open your dashboard, you should instantly know how your courses are performing. Student completion rates, assignment submissions, and engagement metrics shouldn’t require a treasure hunt.
Speed matters because educators juggle multiple responsibilities. A well-designed LMS dashboard template loads quickly and presents information in digestible chunks. You shouldn’t wait fifteen seconds watching a spinning wheel just to see who submitted last week’s quiz.
Actionability separates good dashboards from great ones. Seeing that 60% of students failed an exam is interesting. Getting a notification that highlights which specific questions caused problems? That’s actionable intelligence you can use immediately.
The Visual Elements That Actually Help
Humans process visual information 60,000 times faster than text. Yet many online course dashboards remain text-heavy interfaces that make your eyes glaze over.
Smart visualization transforms raw data into insights. A simple progress bar shows course completion at a glance. Color-coded alerts highlight students who need intervention. Timeline graphs reveal when engagement drops, helping you identify problem areas in your course structure.
But visualization can backfire when overdone. Some LMS dashboard designs cram so many charts and widgets onto one screen that you can’t focus on anything. The goal isn’t to display every possible metric. It’s to surface the ones that drive decisions.
Think about your car’s dashboard. It doesn’t show you every sensor reading from your engine. It highlights speed, fuel, and warning lights. Your learning platform should follow the same philosophy.
Other Dashboards of Education
CRMi Admin University/School Dashboard
BUY NOW DEMO
VoiceX Admin University Dashboard
BUY NOW DEMO
Customization: The Feature Everyone Wants
One-size-fits-all dashboards fail because different users need different information. An instructor teaching high school algebra has completely different priorities than a corporate trainer managing compliance courses.
Modern LMS dashboard templates now offer customization options that let you build your ideal view. Want student attendance data front and center? Drag it to the top. More concerned about assignment completion rates? Make those widgets larger.
The best systems remember your preferences. You configure your Onlinecourse Dashboard once, and it stays that way. No more rebuilding your workspace every time you log in.
Some platforms take this further with role-based dashboards. Students see their own progress and upcoming deadlines. Instructors get class-wide analytics. Administrators access institution-level metrics. Everyone gets exactly what they need, nothing they don’t.
Mobile Matters More Than You Think
Here’s a statistic that might surprise you: over 70% of online learners access their courses from mobile devices at least weekly. Yet many learning management system dashboards become unusable on smaller screens.
Responsive design isn’t optional anymore. Your LMS dashboard should work seamlessly whether you’re on a laptop, tablet, or phone. Buttons should be thumb-friendly. Charts should resize intelligently. Critical information shouldn’t disappear on mobile views.
I’ve seen instructors literally skip checking student progress because logging in from their phone proved too frustrating. That’s a failure of design, not user capability.
Real-Time Data Changes Everything
Traditional learning platforms update metrics daily, sometimes even less frequently. You might not discover a student is struggling until days after the problem started.
Real-time dashboards flip this script. See assignment submissions as they happen. Get instant alerts when discussion forum activity drops. Watch attendance data update during live sessions.
This immediacy enables proactive teaching. Instead of reacting to problems after they’ve festered, you can intervene the moment patterns emerge. That struggling student in row three? You’ll know they need help before they’ve fallen too far behind.
Real-time data also benefits learners. Students using modern online course dashboard can track their own progress instantly. No more wondering “Did my assignment submit?” or “What’s my current grade?” Everything updates as it happens.
Integration: The Underrated Superpower
Your LMS dashboard shouldn’t exist in isolation. The most powerful platforms connect with tools you already use.
Calendar integration syncs deadlines with your existing schedule. Grade book connections eliminate double data entry. Communication tools let you message struggling students without switching platforms. Video conferencing links let you launch virtual office hours with one click.
These integrations save hours every week. More importantly, they reduce the cognitive load of managing multiple disconnected systems. When everything talks to everything else, your LMS dashboard template becomes a genuine productivity hub.
The Future is Already Here
Artificial intelligence is transforming learning management system dashboards from passive reporting tools into active teaching assistants.
Predictive analytics identify at-risk students before they fail. Machine learning algorithms suggest which course materials generate the best engagement. Natural language processing helps instructors understand sentiment in discussion forums.
Some systems now offer automated intervention recommendations. The Admin dashboard doesn’t just tell you that five students are struggling. It suggests specific resources and actions based on similar past situations.
This isn’t science fiction. These features exist today in cutting-edge platforms. As AI capabilities grow, expect your dashboard to become increasingly intelligent and helpful.
Your Next Steps
Start small. Identify your three biggest dashboard frustrations. Then research which modern platforms solve those specific problems. Don’t try to fix everything at once.
Great tools should feel invisible. When your LMS Dashboard works properly, you barely notice it. You just get the information you need, make decisions, and move on with teaching. That’s the goal worth pursuing.
Related Posts


This Post Has 0 Comments