

This is where an Investment dashboard can become useful. Rather than treating every investment as…
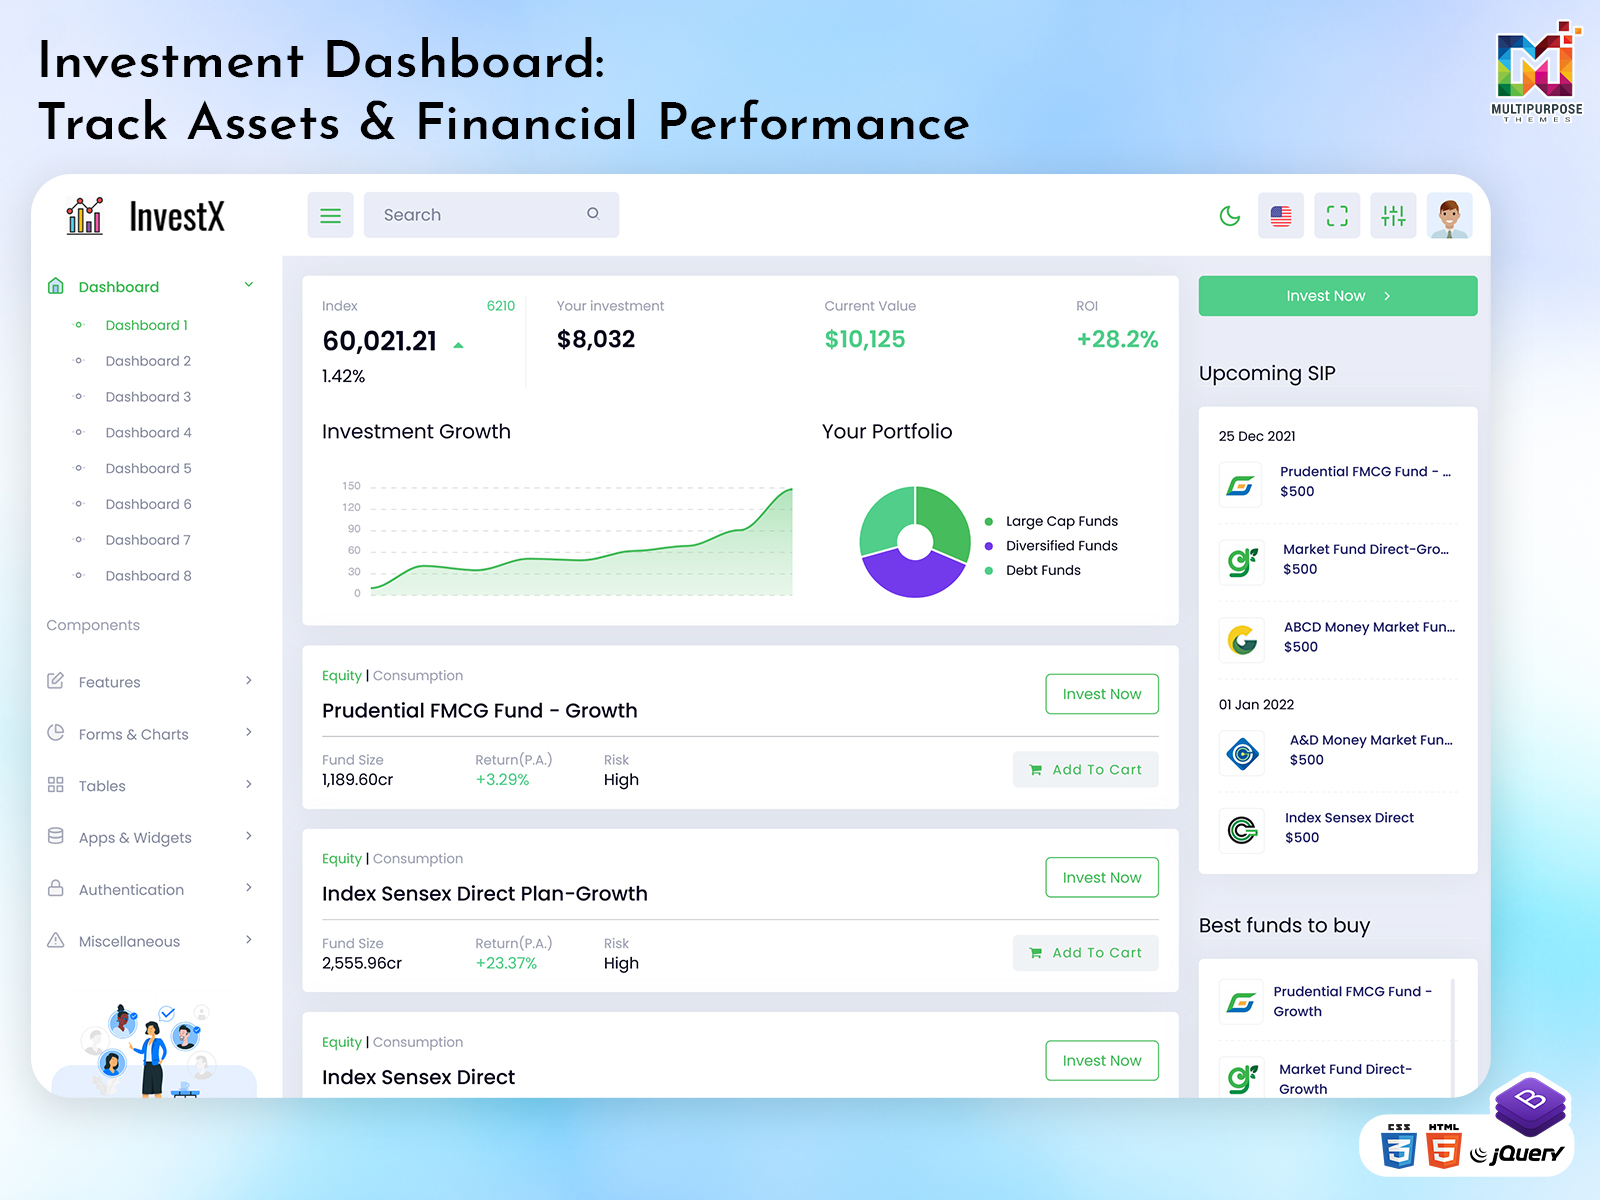
Investment Dashboard: Track Assets and Financial Performance
Reading Time: 6 minutes
Introduction
An investment dashboard helps investors and financial teams keep track of their assets and the investment dashboard keeps investors and financial teams informed about their assets. It helps them keep track of their returns. It also helps them keep track of their costs. It helps them keep track of their performance.
Watch Full Video
A financial analytics dashboard can be created to provide charts, graphs, tables and summaries to help users understand their data.
Whether you are creating an investment platform, asset management or financial management application having an organised dashboard can help users understand their data.
What is an Investment Dashboard?
An investment dashboard provides users with a view of their investment data. This can help users track their portfolios, assets and investments.
An investment dashboard can provide:
- Portfolios summaries
- Asset allocation
- Investment history
- Profit and loss
- Market data
- reports
Having an asset management dashboard can help developers create investment management applications.

VIEW DEMO BUY NOW
Key Features of an Investment Dashboard
Provides users with a view of their data.
- Portfolios
- Asset allocation
- Investment history
- Profit and Loss
- Financial Charts
- Comparison
- Transactions
- User Management
- Responsive
Provides users with a view of their investment data.
Financial Analytics Dashboard
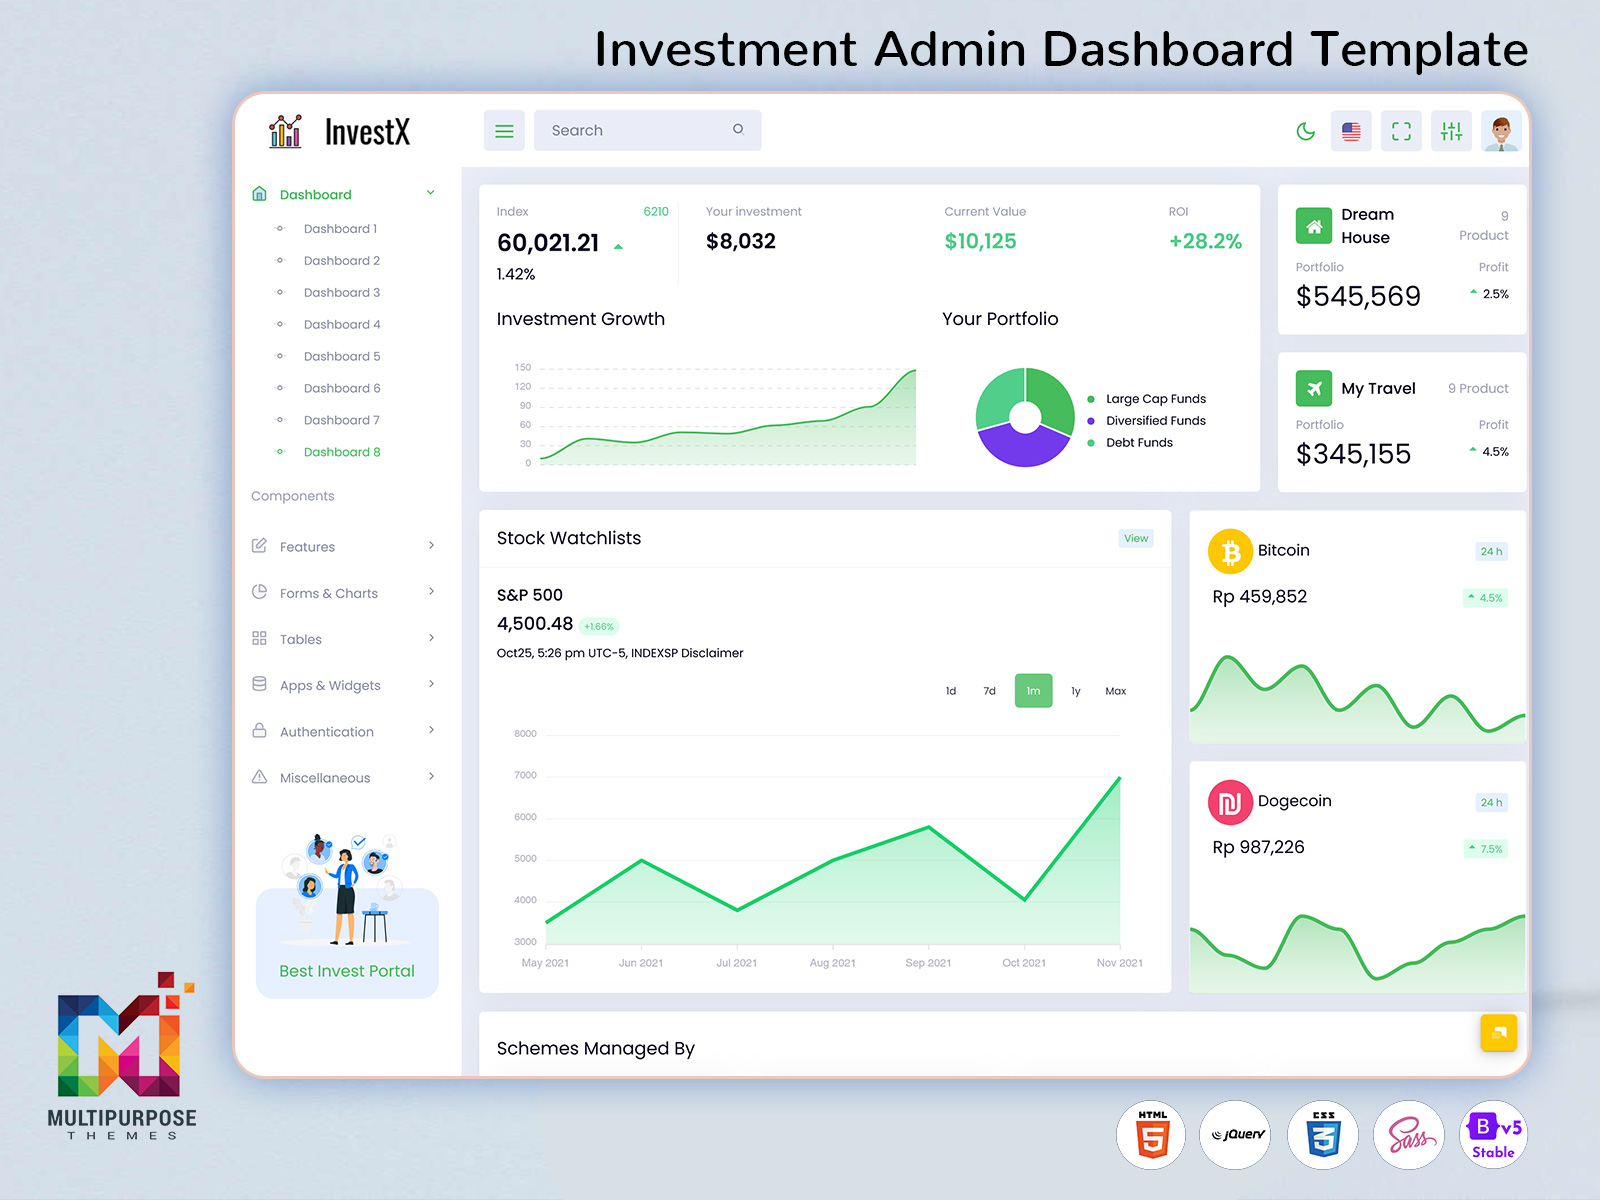
A financial analytics dashboard helps people look at their data in a way. It displays numbers so that anyone can get what they mean. This makes it easier for users to make decisions based on what they see. Users can get reports and visual data to help them understand their financial data.
This can provide:
- Portfolios value and investment summaries
- Asset allocation charts
- Profit and loss
- Investment growth
- Transactions
- Investment comparisons
Visual data can help users identify any changes and understand their investment activity. Users can review their data to assist with making decisions based on their goals.

VIEW DEMO BUY NOW
Asset Management Dashboard
Managing assets can be difficult without data. An asset management dashboard can help users manage their investment data.
This can include:
- Overview of assets
- Types of assets
- Portfolio distribution
- Asset history
- Performance
- reports
This can be helpful for investment managers, financial teams and businesses.
Investment Tracking Software
I find that investment tracking software can help users manage their investment activity and portfolio data especially when they want to keep a picture of their assets. The dashboard of investment tracking software lets users easily review their data.
This can include:
- Investment history
- Portfolios value
- Historical investment data
- Asset performance
- Profit and loss
- Transactions
Users can easily review their data to see any changes in their portfolios. This will depend on the data sources and integrations.
Financial Performance Dashboard
A financial performance dashboard gives users indicators. These help users see how their investments are doing. The dashboard shows which parts are working and which parts are not. I find the dashboard helpful because the dashboard makes tracking progress, over time easier. Users can check their performance at any time. This helps them make decisions, about their money.
These can include:
- Total portfolio value
- Investment returns
- Asset allocation
- Loss
- Portfolio growth
- Transactions
Depending on the type of investment platform you have you can decide what data to include.
Investment Types
An investment dashboard can be created to provide users with their investment data. This will depend on what type of platform you have and what data you are connecting.
Common investments include:
- Stocks & Shares – Track your stock investment, investment history and see how your portfolios have changed.
- Mutual Funds – Manage your mutual fund investments. See how they are doing.
- Bonds – Track your bond investments, when they mature and see related financial data.
- Exchange Traded Funds – Review your ETF holdings. See how they fit into your portfolios.
- Real Estate – Manage your property investments. See how much they are worth.
- Assets – You can include various investment types depending on your business.
Having a central dashboard can help users understand what types of assets they have.
Benefits of an Investment Dashboard
An investment dashboard can help users manage their data in a way. This can benefit individuals, businesses and financial teams.
- Centralised data – See investment data and portfolios.
- More visibility – Understand how your assets are allocated and how your portfolios are performing.
- Easy reporting – See data in charts and reports.
- Manage your investment types – Easily manage your investment types.
- Compare – Compare your investment data.
- Save time – Saves time searching for data.
- Customisable – See data based on your platforms needs.
Helps users manage their investment data efficiently.
Who can use an Investment Dashboard?
An investment dashboard can help users and organisations manage their data.
- Individual Investors – Manage your investment data. Track your portfolios.
- Investment Managers – Investment Managers should understand how your assets are allocated and how your investments are performing.
- Financial Advisors – Financial Advisors should provide clients with portfolio details and reports.
- Financial Companies – Manage your investment related data.
- Developers – Create investment tracking and financial management applications.
- Startups – Create financial technology platforms with custom dashboards.
- Businesses – Manage your asset data. See financial data.
The dashboard can be customised depending on the user. What your application requires.
How to Choose the Right Investment Dashboard Template
When creating an investment or financial management application choosing a dashboard template that fits investment goals and financial management goals can be very useful. The Investment Dashboard should provide users with a view of their data. Consider:
- Easy to read – Choose a dashboard that’s easy to read.
- Data visualisation – Choose a dashboard that has charts and graphs.
- Investment Management – Ensure the dashboard can provide investment and asset data.
- Reporting – Choose a dashboard that has tables and reports.
- Responsive – Ensure the dashboard works on screen sizes.
- Customisable – Choose a dashboard that has a design.
- Navigation – Ensure key sections can be easily found.
A good dashboard template can help you create an application with an easy to use interface.
Best Practice for Creating an Investment Dashboard
The Investment Dashboard must provide users with a view of their data. The Investment Dashboard should be simple to use.
- Key metrics – Provide users with metrics such as total portfolio value, investment returns and asset allocation.
- Easy to read charts – Provide users with easy to read charts to understand trends.
- Group investments – Group your investments by asset type.
- Consistent – Ensure the design is consistent.
- Filter – Allow users to filter data by asset type and date.
- Easy navigation – Ensure users can easily navigate between portfolios, reports and transactions.
- Responsive – Ensure data can be easily viewed on screen.
- Secure – Ensure the application is secure with access and authentication.
Following practice can help you create an easy to use dashboard.
Customising an Investment Dashboard
Every investment platform will have requirements. Some applications will focus on portfolios whereas others will be for asset managers or financial organisations.
Customising your dashboard can help developers create a design that suits your users and application.
For example if you are creating an investment application you may want to provide users with portfolio value, investment history and investment returns. Whereas if you are creating an asset management application you will need sections for asset types, allocation, reports and transactions.
Developers can customise the dashboard by adding widgets, charts, tables, menus and reports.
Conclusion
An Investment Dashboard can help you manage your portfolio data track your asset performance and view your data in one place. With features such as investment tracking, asset allocation, financial analytics and reports it can help users understand their data.
A Financial Analytics Dashboard or Asset Management Dashboard can be created to help with investment types and financial management applications. It can also give developers the opportunity to create custom platforms with a layout and useful data visualisation.
If you are creating an investment platform or financial management application choosing the design for your dashboard can help improve the user experience and make it easier to manage your investment data.
FAQs
What is an Investment Dashboard?
An Multipurpose Themes Investment Dashboard provides users with a view of their portfolios, asset allocation, investment activity and financial performance.
What is a Financial Analytics Dashboard?
A Financial Analytics Dashboard can help users understand their data, with charts, reports, performance summaries and other visual data.
How can an Asset Management Dashboard help me?
An Multipurpose Themes Asset Management Dashboard can help users manage their asset data review their portfolio allocation and track their investment performance.
What is Investment Tracking Software?
Investment tracking software can help users track their investment activity, portfolio data, transactions and performance.
What should a Financial Performance Dashboard include?
It may include portfolio value, investment returns, profit and loss asset allocation, portfolio growth and transaction summaries.
Can I customise an Investment Dashboard?
Yes developers can customise the Multipurpose Themes dashboard adding charts, tables, widgets and reports to meet the requirements of your application.

Related Posts

This Post Has 0 Comments