



Cryptocurrency platforms generate a large amount of information every day. Prices change quickly, wallets receive…
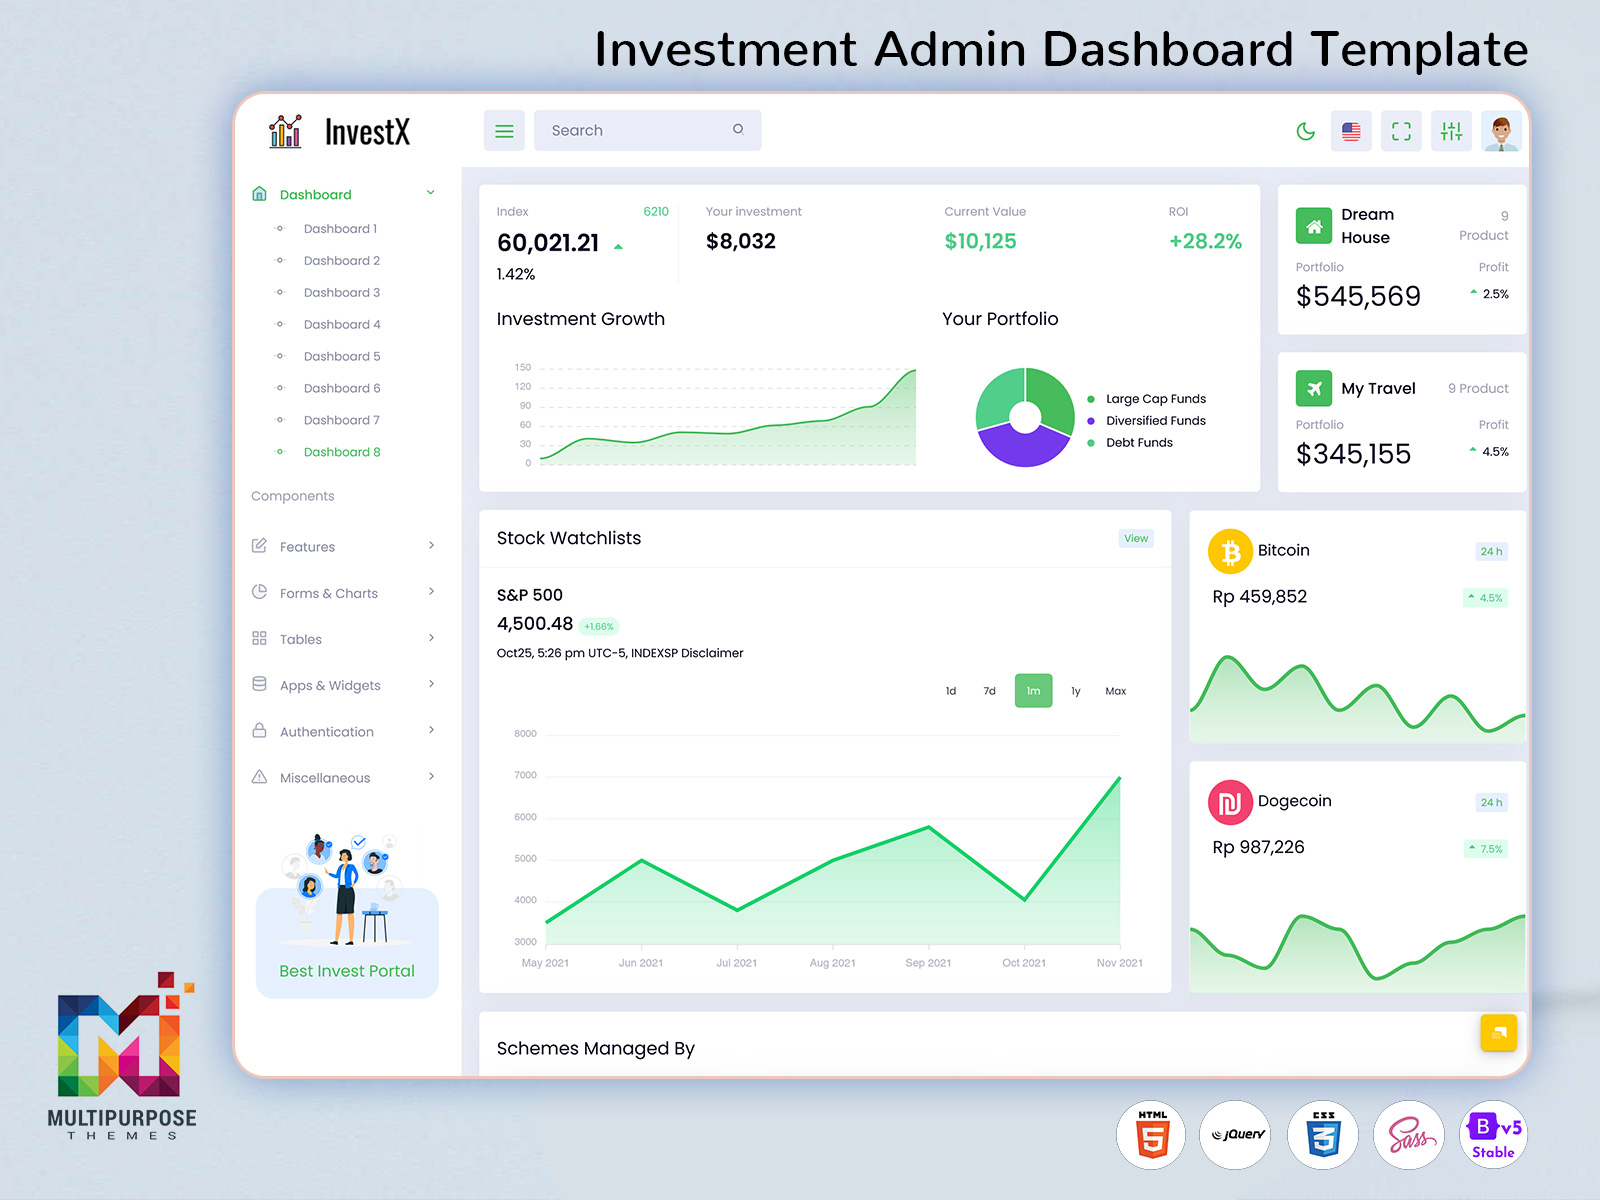
Investment Dashboard: Simplify Investment Data & Analysis
Reading Time: 8 minutes
This is where an Investment dashboard can become useful. Rather than treating every investment as a separate item, it can bring relevant information into a connected workspace. An investor can see what is currently held, how the overall position has changed, where money is concentrated, and which areas may deserve a closer look.
Watch Full Video
The real strength of a dashboard is therefore not the number of charts it contains. It is the context it gives to those numbers. A percentage change may look positive on its own, for example, but it tells a very different story when considered alongside the investment period, original amount, asset allocation, and movement of the wider portfolio.
A greater perspective in regard to such issues is beneficial for financial platforms, wealth management, investments, and even for individuals investing money. Users will not be continuously searching for pieces of information but analyzing the meaning behind it instead.
What is an Investment Dashboard?
An investment dashboard is basically a computer screen where various elements related to investment are displayed together. It helps one see their investments, transactions, asset allocations, market movements, changes over time, and much more.
The important point is that an investment dashboard does not simply combine information. It gives that information structure.
Imagine an investor holding shares in several companies, investing in different mutual funds, and maintaining money across more than one account. Each individual investment may be easy to understand, but viewing them independently does not necessarily show how the entire financial position looks.
A dashboard can place these elements into a broader context. The user can move from an overall portfolio view toward individual holdings when something requires closer attention.
This distinction becomes especially important when portfolios become larger. Manually reviewing every investment may encourage investors to focus on whichever information is easiest to find rather than what is most important. A well-organized interface can instead guide attention toward meaningful changes.
The investment company’s dashboard can also play the role of a bridge between the intricate financial information and the ultimate users. The data may be technically correct but not necessarily understandable in case it is badly structured. Thus, the dashboard provides for the restructuring of such data
A Portfolio dashboard, for instance, can focus on the complete investment position rather than individual securities. A Stock market dashboard can provide a more market-oriented environment for monitoring selected companies and securities. A Mutual fund dashboard can organize fund-related information separately so users can examine those investments without mixing them with unrelated holdings.
The purpose is not to tell an investor what to buy or sell. Instead, the dashboard should make relevant information easier to find, compare, and interpret.
That difference is important. Good financial software supports informed thinking; it should not create the impression that a visual interface can replace research, financial planning, or professional advice.
VIEW DEMO BUY NOW
When Managing Investment Data Becomes Challenging
The need for a dashboard often becomes apparent when investment information starts spreading across too many places.
An investor may receive transaction confirmations through email, check prices through one application, download statements from another service, and maintain personal calculations in a spreadsheet. None of these tools necessarily has a problem individually. The difficulty appears when the investor tries to understand everything together.
This creates a hidden cost: context switching.
Every time the user switches sources, he has to recall what he was searching for and manually analyze the data to establish whether the numbers pertain to the same period and investment. If a person is handling a bigger portfolio, this could turn into a tedious task.
A dashboard can reduce this friction by creating a consistent starting point.
It can also help separate three different questions that investors frequently mix together:
- What do I currently own?
- What has changed?
- What requires further investigation?
These questions sound similar, but they require different information.
Knowing the current value of a holding answers the first question. Historical movement helps with the second. Additional analysis, allocation information, or market context may be needed for the third.
This is one reason a good investment interface should not attempt to place every available number on the first screen.
Features
The most useful features are those that help users understand relationships between information, rather than simply displaying more information.
1. Portfolio Context
A portfolio-level view can show how individual investments contribute to the overall financial position. This prevents users from judging every holding in isolation and encourages them to consider the wider composition of their investments.
2. Historical Comparison
Current figures provide only a snapshot. Historical comparison adds a timeline to the information. Users can examine how values, allocations, or selected investments have changed instead of assuming that today’s position tells the entire story.
3. Investment Categorization
Classification of investments by the type of asset, industry, account, geographical location, or any other categorization method will show patterns that are hard to detect when not organized.
An example could be an investor who owns a number of various securities but finds out that they all have exposure to the same industry. In this case, the individual investments might look diverse, but not the whole group of assets.
4. Watchlist Separation
Not everything an investor monitors is something they own.
A Stock market dashboard can separate watchlisted securities from actual holdings. This distinction keeps research activity from being confused with the current portfolio and gives users a cleaner way to follow potential investments.
5. Transaction Context
A transaction list becomes more useful when it can be connected to the investment it relates to. Users may want to understand when an asset was purchased, how much activity has occurred, and how previous transactions relate to the current position.
6. Allocation Perspective
A Portfolio dashboard can show how the investment position is distributed across different categories. The value of this feature is not simply visual presentation. It allows users to recognize concentration and distribution patterns that may otherwise remain hidden.
7. Personalized Views
Different users have different priorities. A long-term investor may care more about portfolio composition and historical movement, while an active market participant may want a faster view of selected securities.
Allowing the interface to reflect these differences can make the dashboard more relevant without adding unnecessary complexity.
VIEW DEMO BUY NOW
Using Dashboards for Focused Market Monitoring
Following the stock market can generate an enormous amount of information. Prices move, companies publish announcements, sectors behave differently, and investors may maintain long watchlists.
A Investment dashboard can make this environment easier to organize by giving users a focused place to monitor selected securities.
A dashboard that attempts to display every possible market metric can become noisy. Users may end up spending more time scanning information than understanding it.
A better approach is to organize the market view around the user’s monitoring purpose. Watchlists, selected price information, historical movement, categories, and relevant comparisons can be arranged so that the most important information receives attention first.
Benefits of Investment Dashboard
1. Reduces Information Fragmentation
An Investment dashboard can bring relevant investment information into a common environment. This reduces the need to repeatedly switch between unrelated sources and makes it easier for users to connect holdings, activity, and portfolio-level information.
2. Provides Portfolio Context
Individual investment figures do not always explain the condition of the overall portfolio. A dashboard can place holdings within a wider allocation view, helping users understand how particular assets contribute to the complete investment position.
3. Makes Monitoring More Structured
Instead of checking investments randomly, users can organize their monitoring around selected categories, watchlists, time periods, and portfolio views. This creates a more consistent process for reviewing financial information.
4. Helps Identify Concentration
Looking at investments individually can hide concentration across sectors, categories, or other classifications. A dashboard can group related holdings, making patterns more visible and giving users an opportunity to investigate whether the portfolio reflects their intended approach.
5. Simplifies Investment Review
A structured interface can reduce the effort required to locate information during routine reviews. Users can move from a broad summary toward individual details without rebuilding the same information manually each time.
6. Supports Better Financial Conversations
Advisors and investment professionals can use organized portfolio information as a foundation for discussions with clients. Having a common view of holdings and historical activity can make conversations more specific and easier to follow.
7. Creates a Record of Investment Activity
By bringing transactions and portfolio changes into an organized environment, a dashboard can help users understand how their current position developed. This historical record can be useful when reviewing past activity and evaluating future requirements.
MultiPurpose Themes: Simplifying Investment Data with a Smart Dashboard
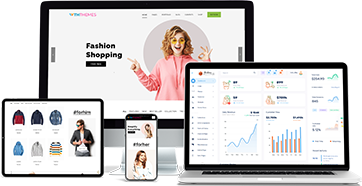
Multi Purpose Themes provides an Investment Dashboard designed to organize complex investment information into a clear and structured interface. The dashboard can bring together portfolio information, investment performance, market data, charts, tables, and other relevant financial details, helping users review their investments from a broader perspective. With organized sections and visual elements, users can monitor selected investments, compare performance, review portfolio distribution, and examine important changes without having to manage information across multiple screens. This type of dashboard can be useful for investment platforms, financial businesses, advisors, and other applications that need a practical way to present investment-related information in an accessible format.
Conclusion
An Investment dashboard should do more than collect financial numbers on one screen. Its real purpose is to provide context—helping users understand what they own, how their investment position has changed, where their money is distributed, and which areas may require further examination.
A Stock market dashboard can create a focused environment for monitoring selected securities, while a Mutual fund dashboard can organize fund-related information in a way that makes multiple schemes easier to review. At the broader level, a Portfolio dashboard can connect individual holdings to the overall investment picture.
The most effective dashboard is not necessarily the one with the most charts or the largest amount of data. It is the one that answers useful questions clearly and helps users move from information toward informed evaluation.
Investment decisions will always require judgment, research, and consideration of individual circumstances. A dashboard cannot remove that responsibility. What it can do is make the information behind those decisions more organized, accessible, and easier to understand.
Frequently Asked Questions
1. What information should appear first on an Investment dashboard?
The first screen should focus on information that users need most frequently, such as their overall investment position, important changes, portfolio composition, and items requiring attention. The exact arrangement should depend on whether the dashboard is designed for individual investors, advisors, analysts, or investment businesses.
2. Can an Investment dashboard show stocks and mutual funds together?
Yes, a Multi Purpose Themes platform can be designed to display different investment categories together. However, stocks and mutual funds have different characteristics, so the interface should avoid treating them as identical. Separate views can provide category-specific information while still contributing to a broader portfolio picture.
3. Why is portfolio context important when reviewing investments?
An individual investment may perform differently depending on how large its position is within the complete portfolio. Portfolio context helps users understand the relationship between individual holdings and overall allocation rather than judging every investment purely by its individual return or movement.
4. Is a Stock market dashboard useful for long-term investors?
Yes. A Multi Purpose Themes Stock market dashboard does not have to be used only for frequent trading. Long-term investors can use it to organize watchlists, follow selected companies, review historical movement, and maintain a structured market-monitoring process without constantly searching for the same information.
5. What makes a Mutual fund dashboard different from a normal portfolio screen?
A Mutual fund dashboard can be designed specifically around fund-related information and classifications. This allows users to organize schemes, review fund-specific details, and distinguish their fund investments from other asset types while still keeping them connected to the wider portfolio.
6. Can an Investment dashboard help identify portfolio concentration?
Yes. If the dashboard groups holdings by relevant categories such as sector, asset type, or another classification, users can more easily recognize where a significant portion of their investment is concentrated. This information can then be investigated as part of a broader portfolio review.
7. Should an Investment dashboard provide investment recommendations?
Not necessarily. A dashboard’s primary role can be to organize and present information. Recommendations involve additional considerations such as financial objectives, risk tolerance, circumstances, research, and suitability. Keeping information presentation separate from investment advice can create a clearer and more responsible user experience.

Related Posts

This Post Has 0 Comments