Businesses create information throughout their activities. Customer interactions orders, website visits, marketing campaigns, financial transactions,…
Analytical Charts Dashboard for Effective Data Visualization
Reading Time: 7 minutes
What is an Analytics Dashboard?
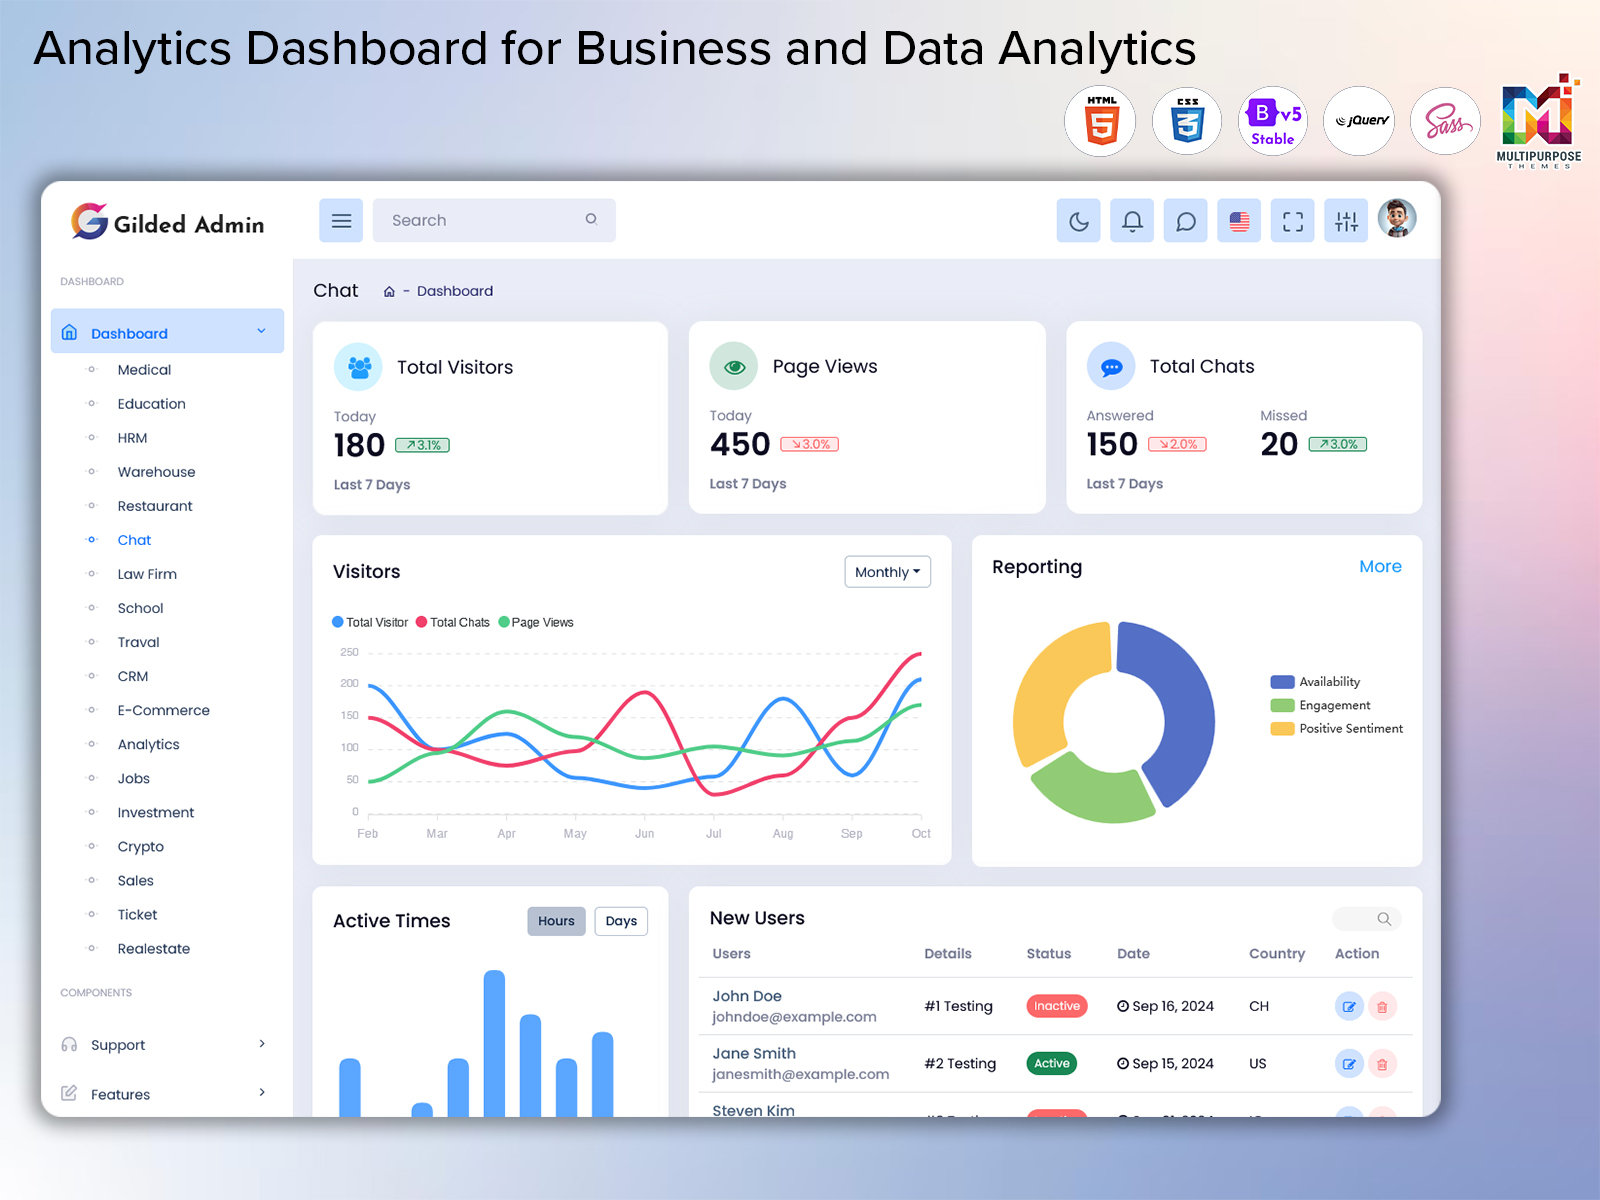
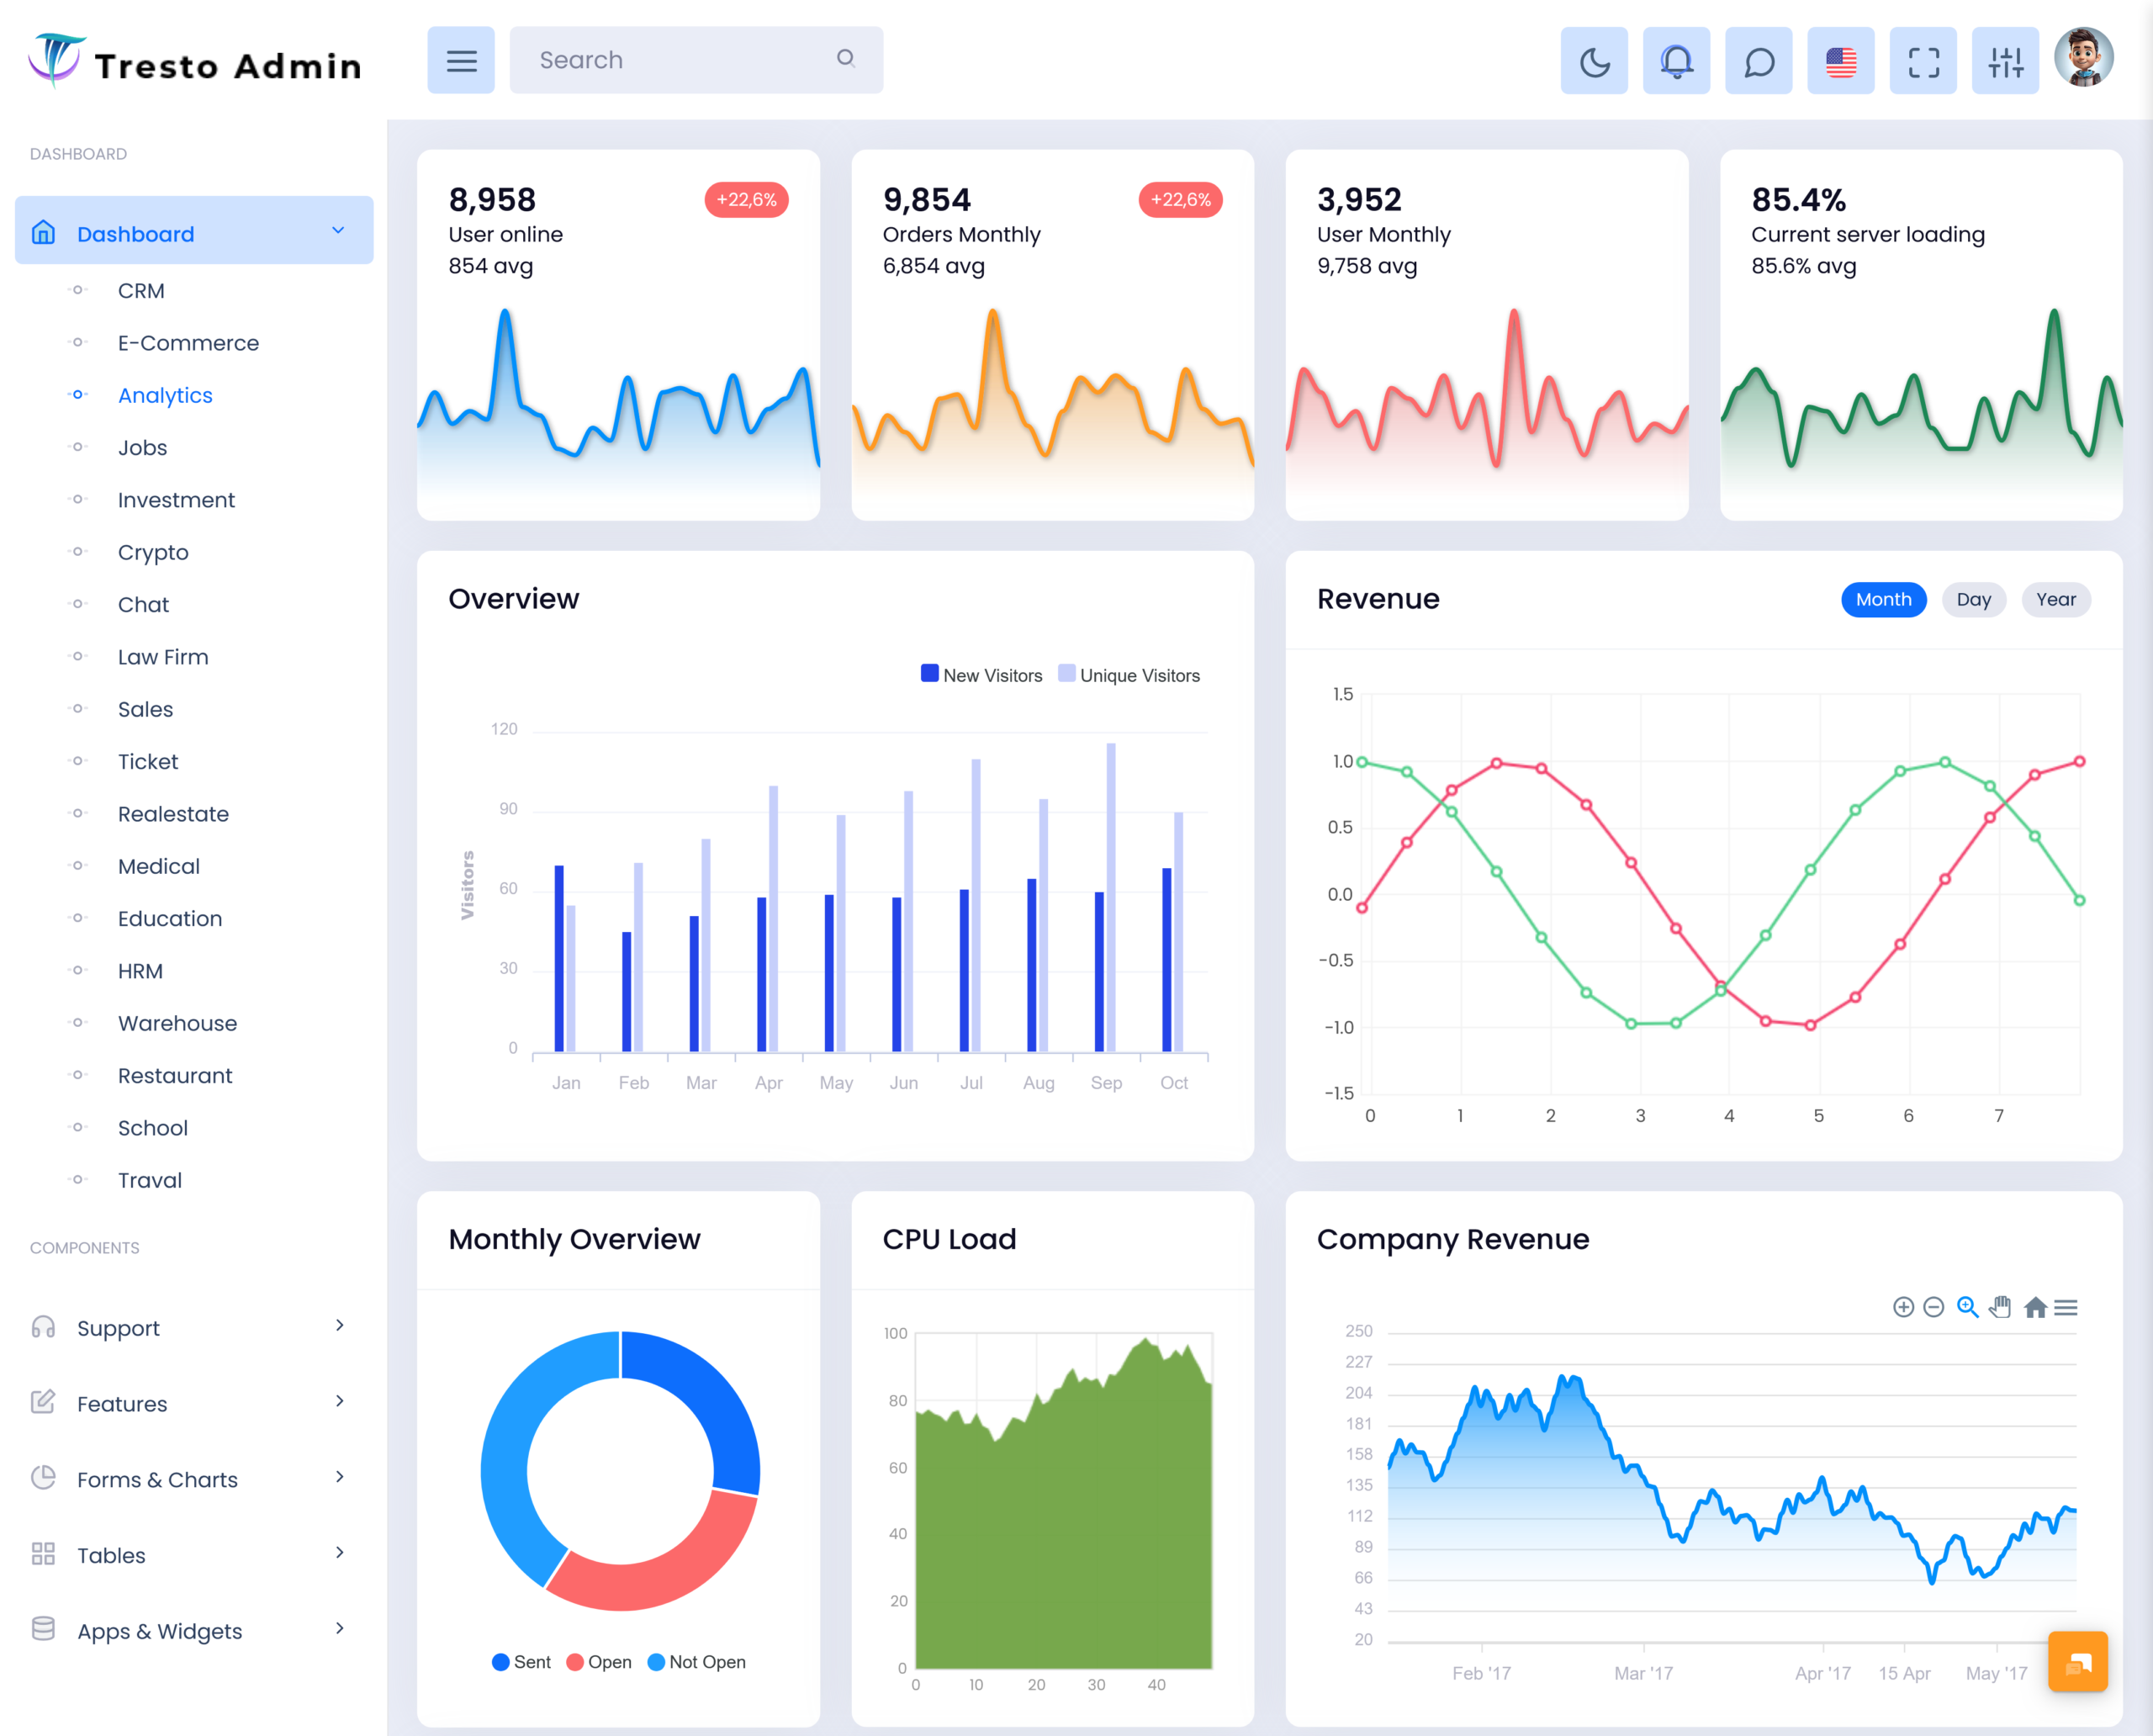
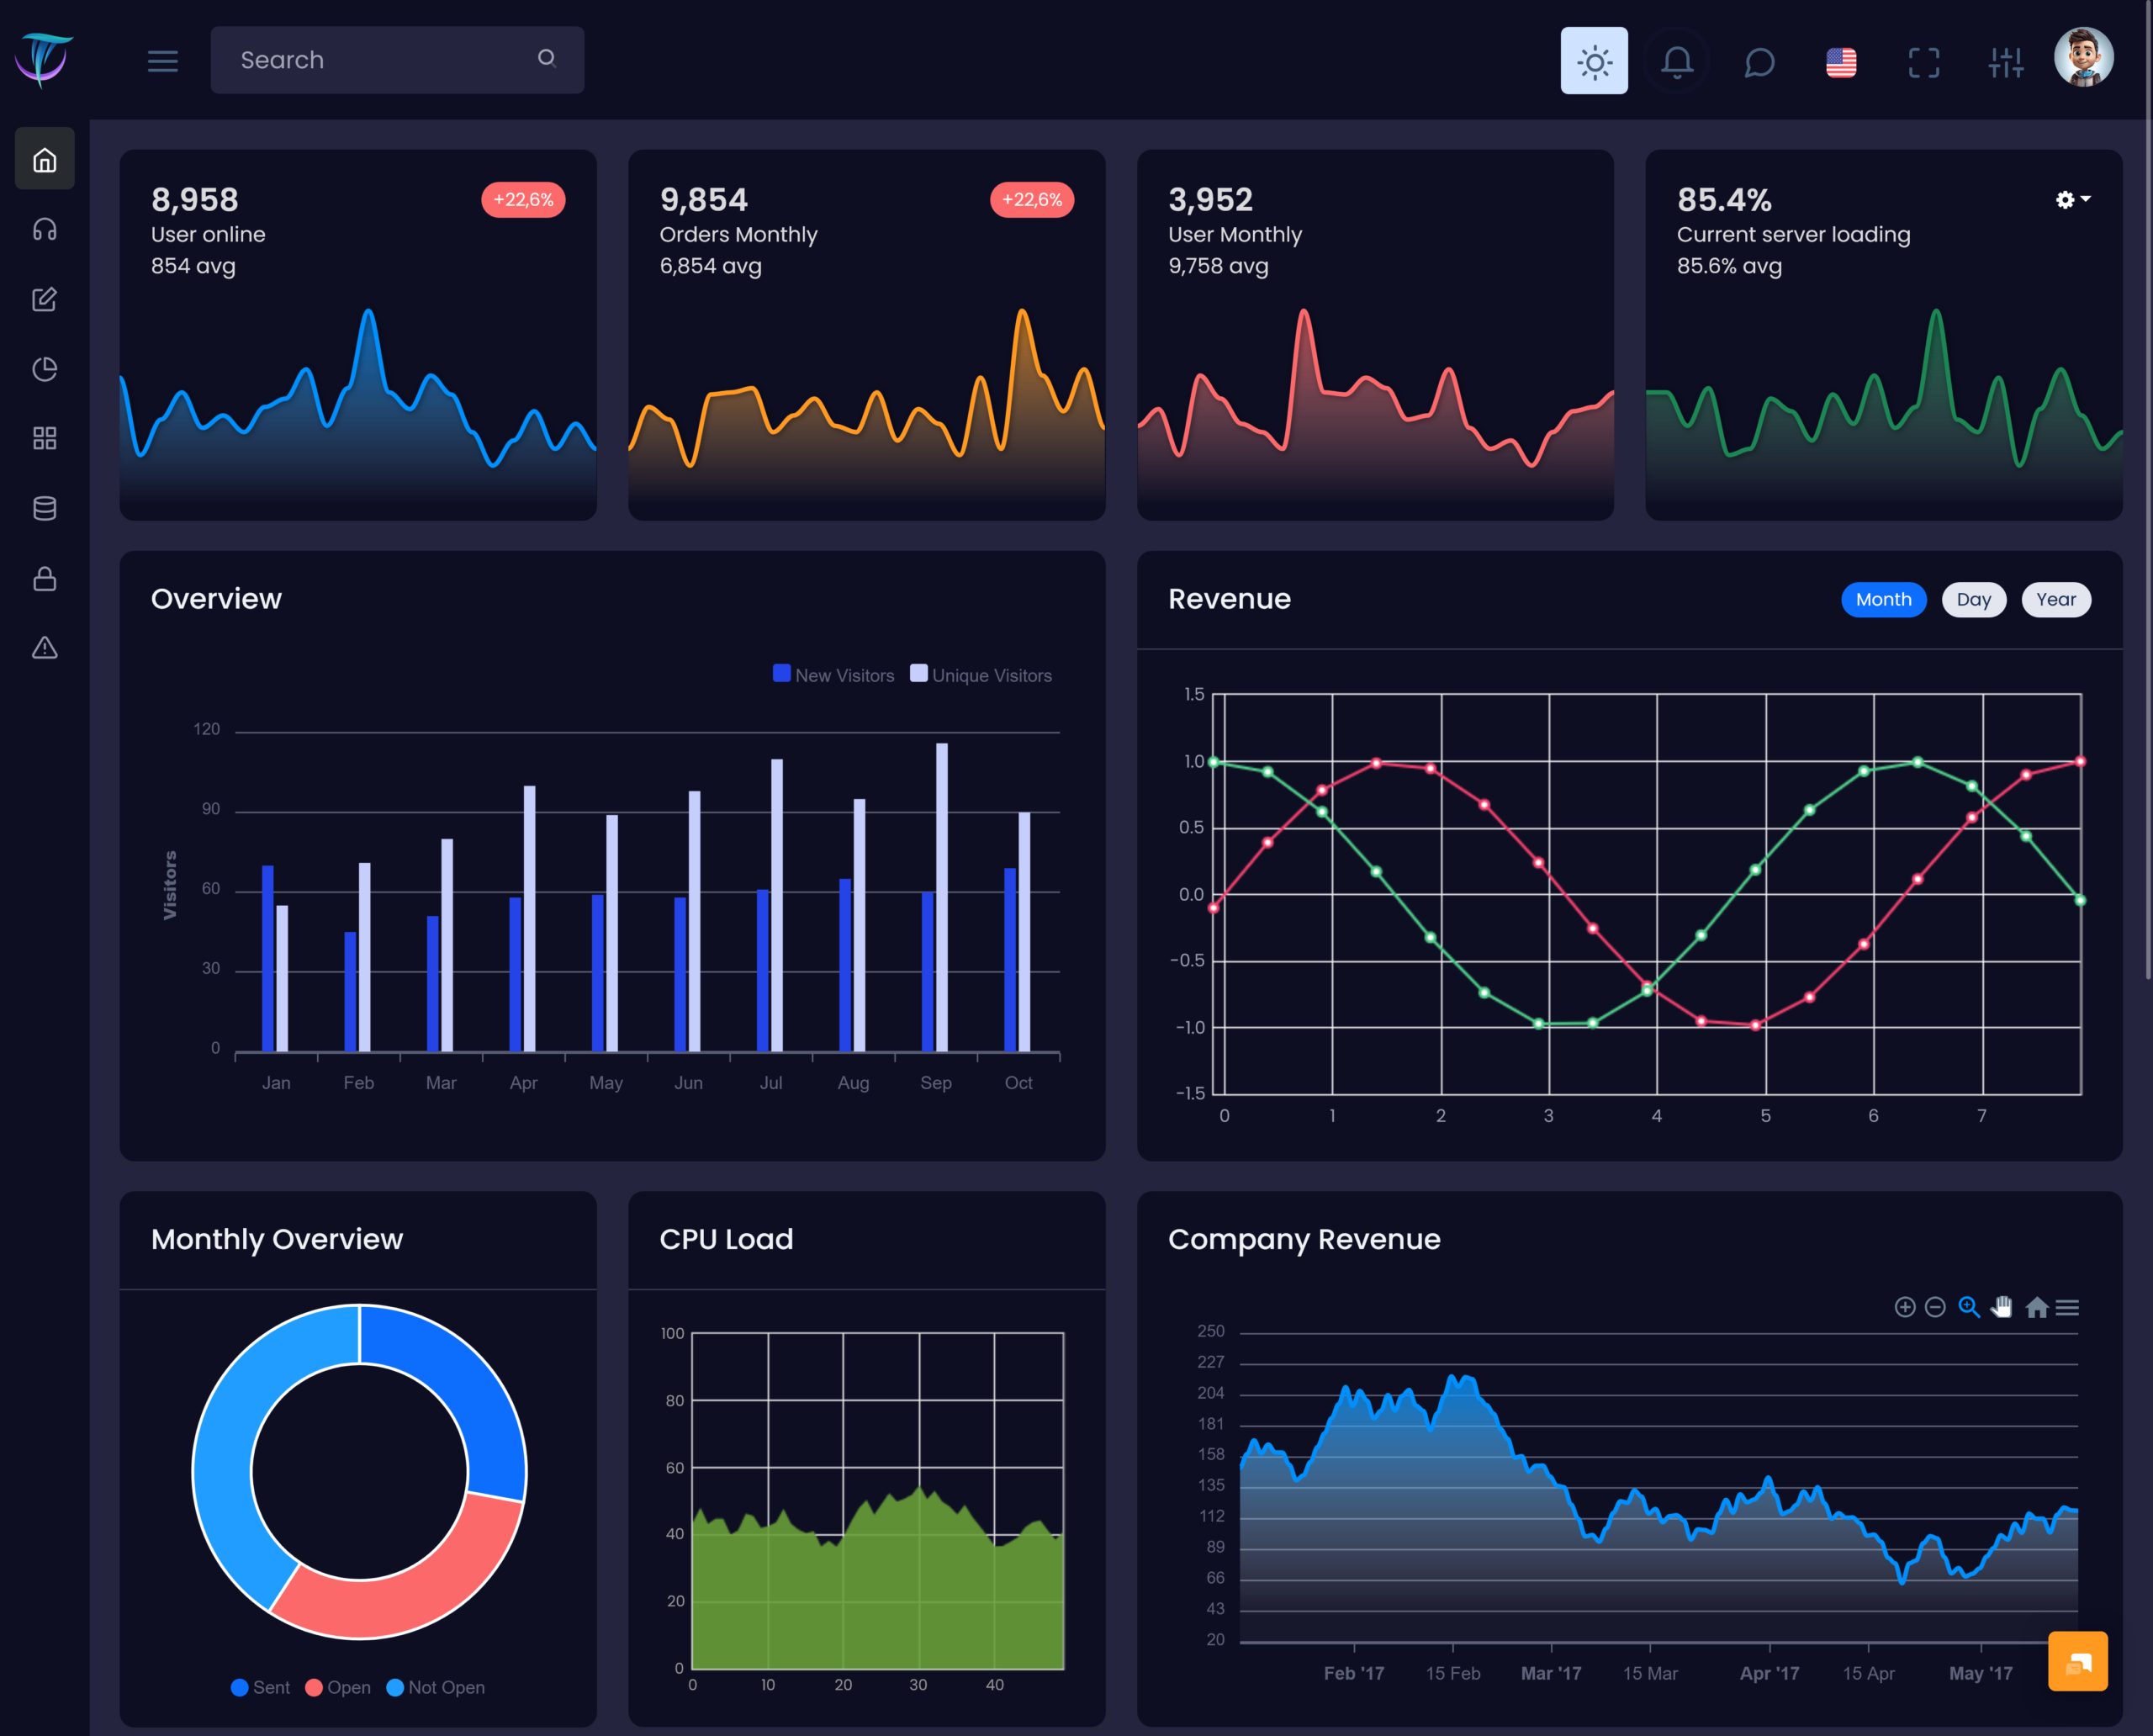
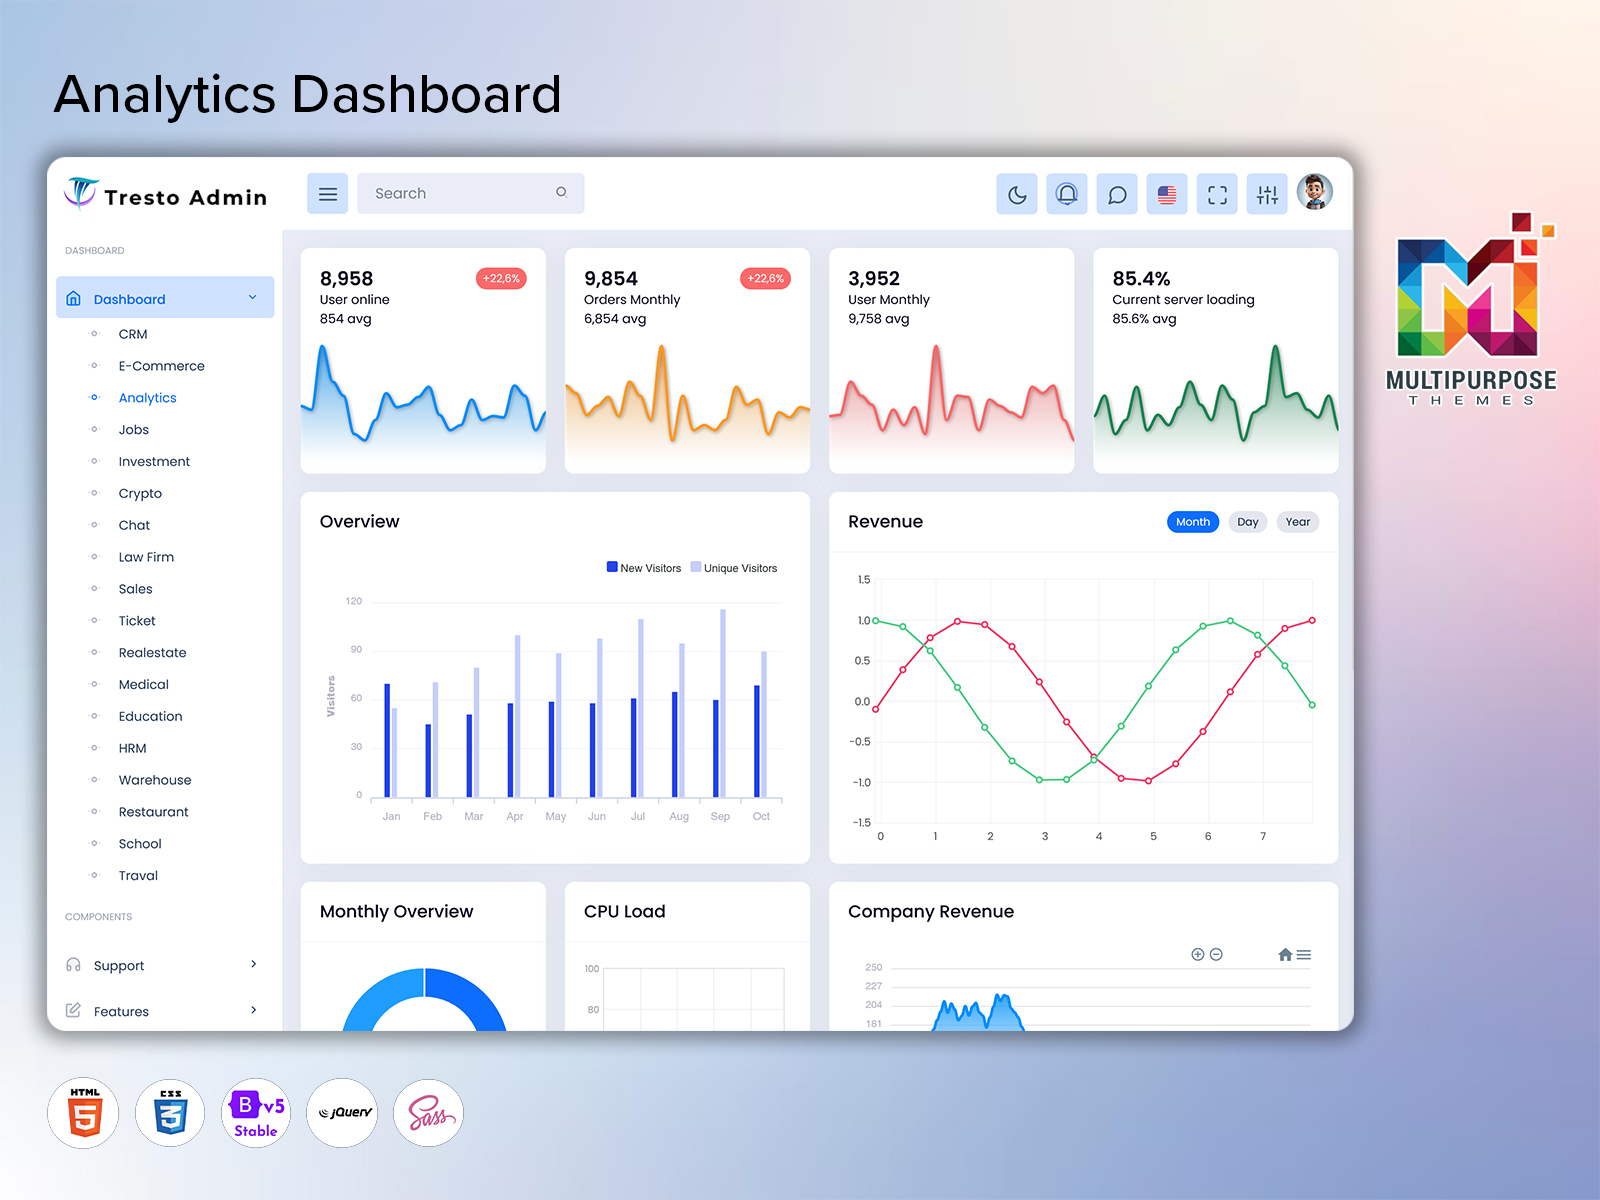
This analytics dashboard is a virtual platform which helps businesses to collect , organize and understand the bulk of data with this easy to use dashboard. Instead of reviewing complex reports manually analyse spreadsheets. Organizations can use this dashboard to analyse necessary data, identify trends and make faster decisions.
Watch Full Video
Modern businesses generate data from multiple sources, including sales activities, customer interactions, marketing campaigns, website performance, and operational processes. Managing this information manually can be time-consuming and may lead to missed opportunities. An analytics dashboard brings this data together and presents it in an easy-to-understand format.
The major purpose of this dashboard is to convert raw information into meaningful insights. With virtual elements like graphs, charts , reports etc. organizations can instantly understand performance levels and identify areas which need improvement.
How Analytics Dashboard Helps Businesses Make Data-Driven Decisions
In this competitive era business cannot depend only on the assumptions or traditional reporting methods. Every organization should know every update related to their business , how its words, its growth ,loss and all this dashboard provides these all things at one place.
An Analytics Dashboard provides a centralized platform where companies can monitor important business information from one place. It reduces the need to collect reports from different departments and helps decision-makers access updated information quickly.
For sales teams, Sales Dashboards provide better visibility into sales activities, customer engagement, revenue performance, and business growth. Managers can understand sales trends, evaluate team performance, and identify opportunities that require immediate attention.
Why Visual Data Representation is Important for Modern Businesses
Data is valuable only when businesses can understand and use it effectively. Large amounts of information can become difficult to manage if they are presented only through traditional reports or spreadsheets.
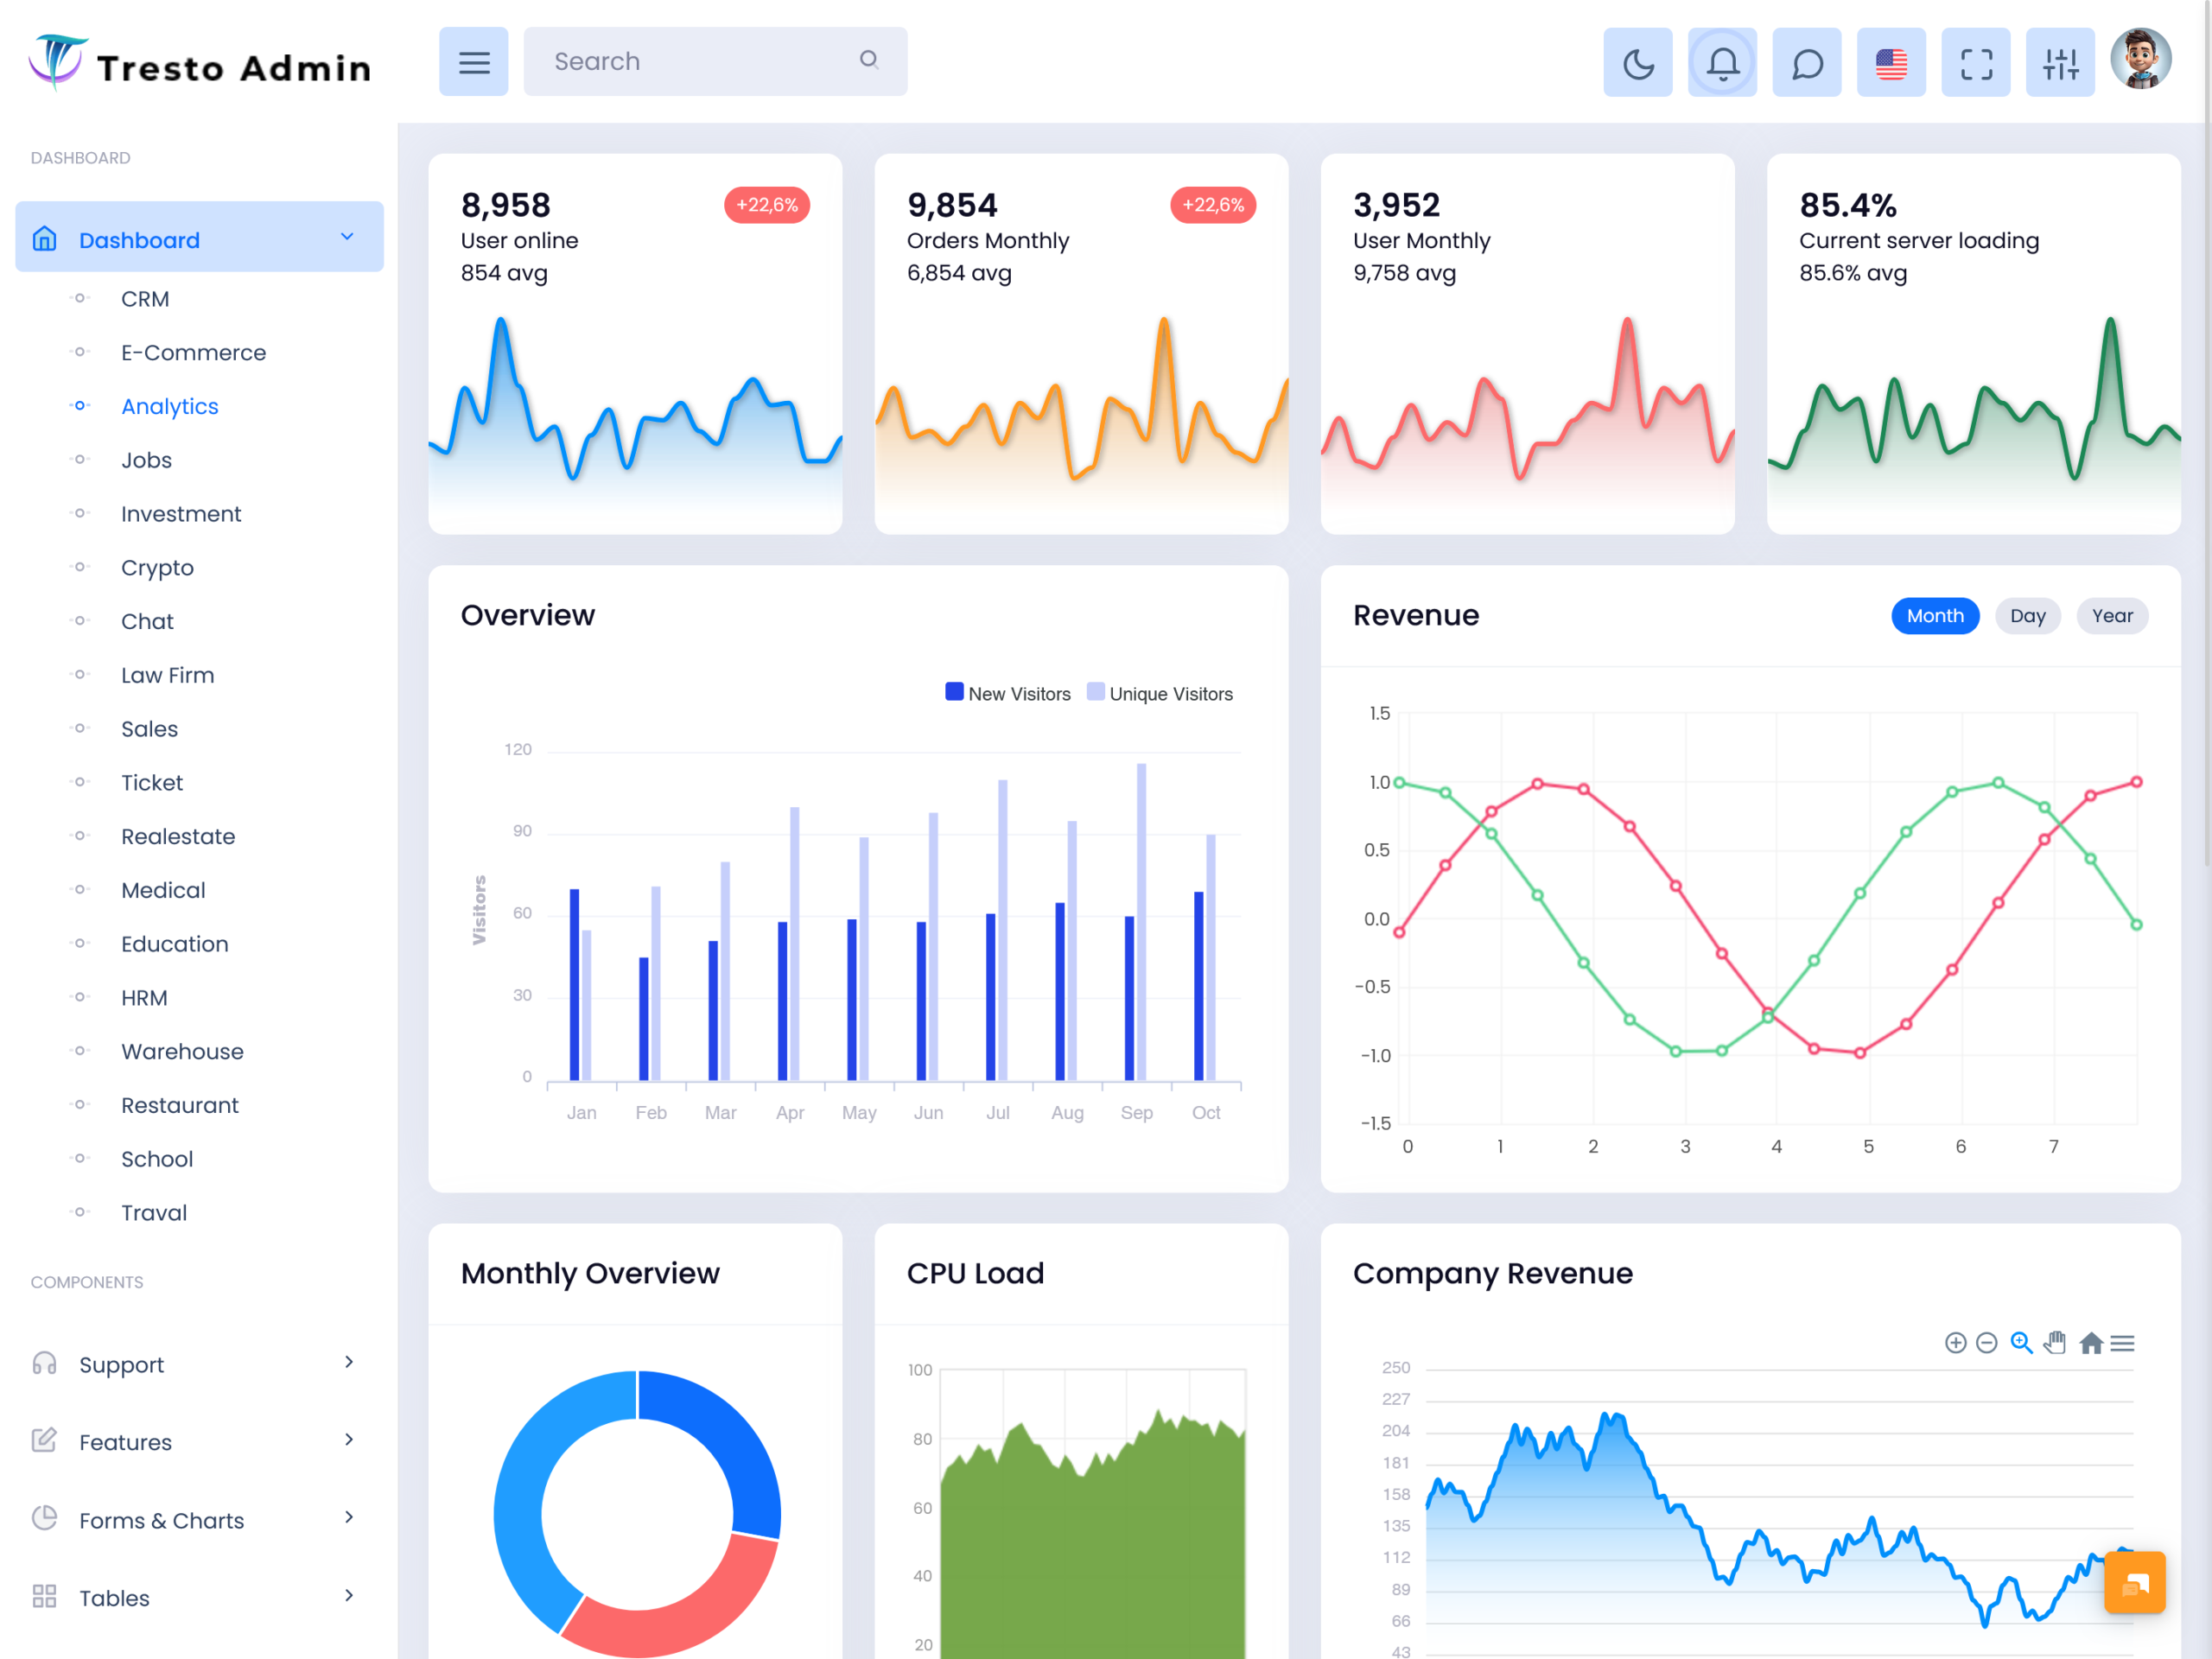
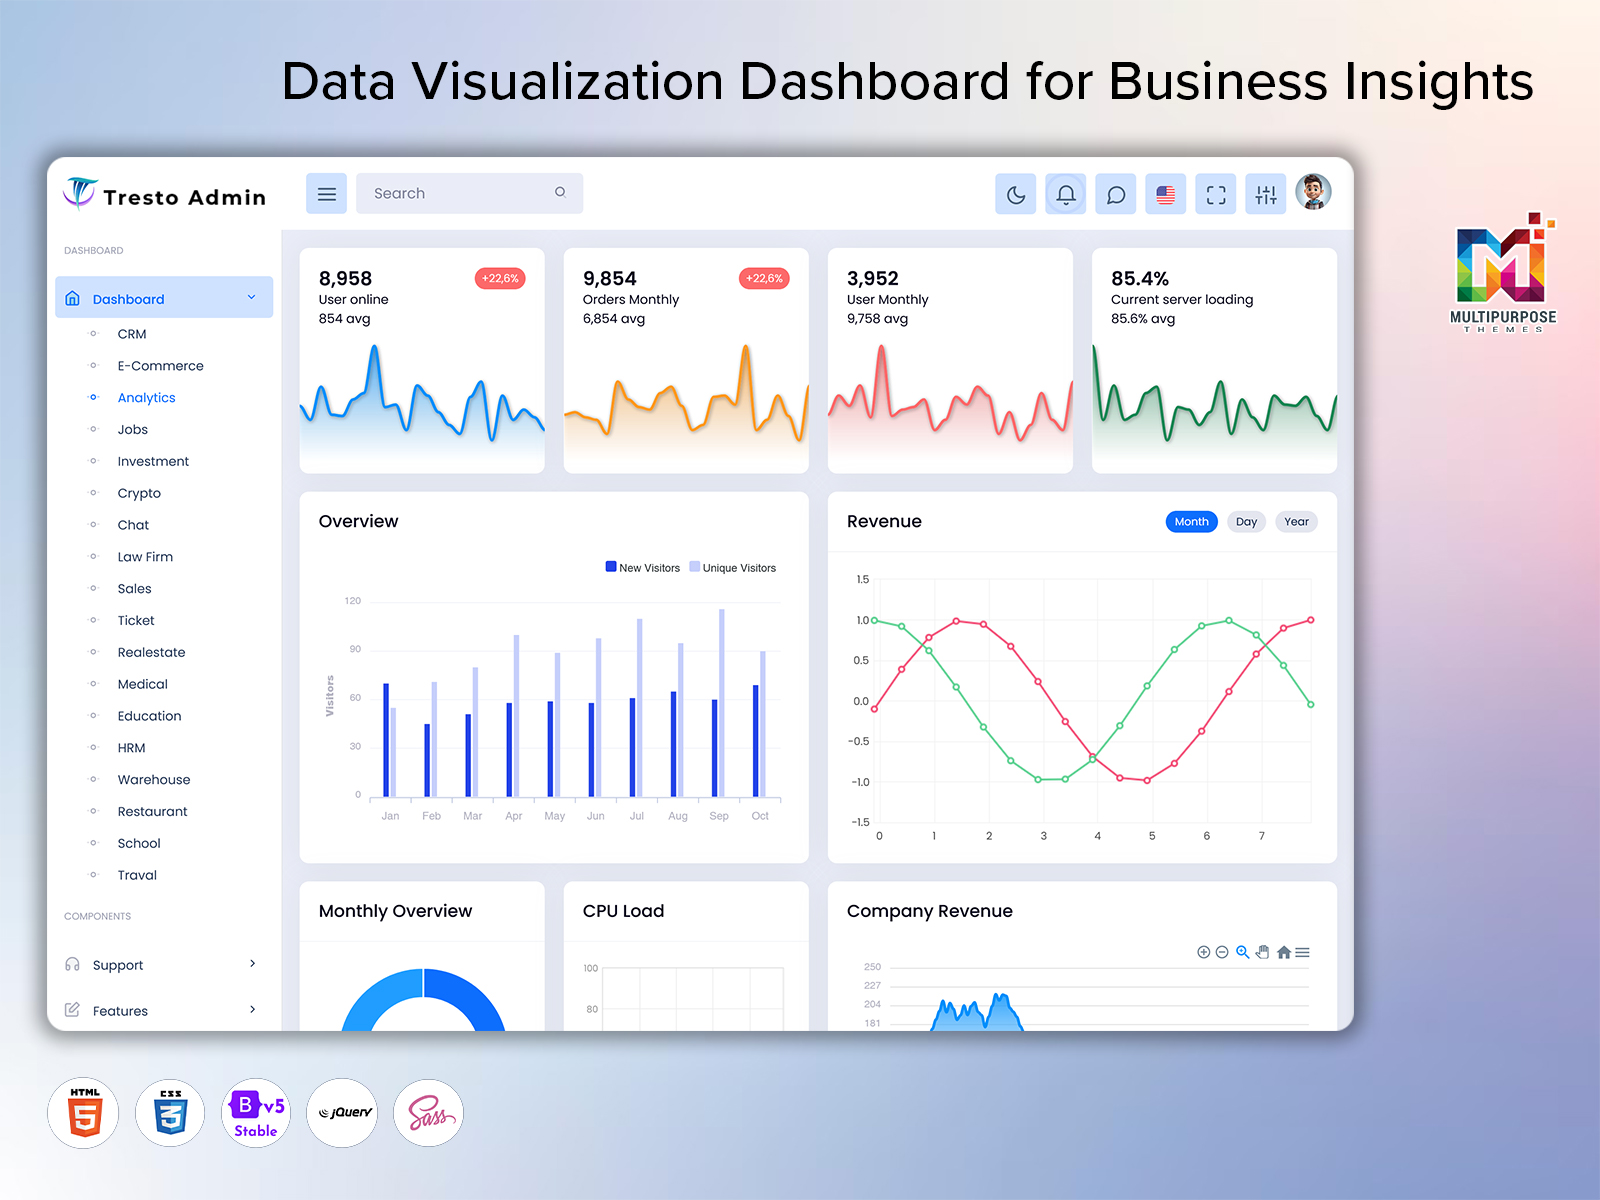
This is where visual data representation becomes important. An analytics dashboard uses charts, graphs, and Analytical Charts to simplify complex information and make it easier to understand. Users can quickly identify patterns, changes, and important business indicators.
Visual reporting helps teams save time because they do not need to manually analyze every piece of information. Instead, they can view important insights through organized dashboards and focus on improving business performance.
The Role of Analytics Dashboard in Business Growth
Business growth depends on understanding performance, identifying opportunities, and responding quickly to changing market conditions. Without proper insights, companies may struggle to understand what is working and where improvements are needed.
An analytics dashboard acts as a decision-support system by providing a clear overview of business activities. It helps organizations monitor important performance indicators and evaluate whether their strategies are delivering expected results.
For growing businesses, managing multiple data sources can become challenging. An analytics dashboard simplifies this process by bringing important information together in one place. This creates better visibility and allows managers to focus on strategic improvements.
Features of Analytics Dashboard
1. Real-Time Data Monitoring
An Analytics Dashboard helps businesses monitor important information continuously and understand current performance without waiting for manual reports. It collects updated data and presents it through a clear interface, allowing teams to identify changes quickly. Real-time monitoring improves decision-making and helps organizations respond faster to business opportunities and challenges.
2. Analytical Charts and Data Visualization
Analytical Charts make complex business information easier to understand by presenting data in visual formats. Instead of reviewing lengthy reports, users can identify patterns, comparisons, and performance changes quickly. Effective visualization improves data interpretation and allows managers to understand important business insights without spending excessive time analyzing information.
3. Sales Performance Tracking
Sales Dashboards help sales teams monitor revenue activities, customer engagement, and overall sales performance from one platform. They provide better visibility into sales progress and help managers evaluate strategies more effectively. By understanding sales patterns, businesses can improve planning, identify opportunities, and create better approaches for increasing conversions.
4. Customizable Dashboard Layout
A flexible Dashboard Layout allows businesses to organize information according to their specific requirements. Users can arrange important metrics, reports, and visual elements in a way that supports their workflow. A customized layout improves usability and ensures that teams can quickly access the information they need for better decisions.
5. Business Performance Analysis
An Analytics Dashboard helps organizations evaluate their overall performance by combining data from different business activities. It provides insights into growth trends, operational efficiency, and important performance indicators. This helps decision-makers understand business conditions clearly and develop strategies based on accurate information rather than assumptions.
6. Interactive Reporting System
An analytics dashboard provides an interactive reporting experience that allows users to explore information more effectively. Instead of depending on static reports, teams can review different data points and understand performance changes. Interactive reporting improves flexibility and helps businesses analyze information according to their specific goals and requirements.
7. Data-Driven Decision Support
Dashboard Analytics supports smarter decision-making by converting business information into meaningful insights. It helps managers understand current performance, identify improvement areas, and plan future strategies. By using accurate data analysis, organizations can reduce uncertainty, improve efficiency, and make decisions that support sustainable business growth.
How Analytics Dashboard Improves Sales and Operational Performance
Businesses today generate large amounts of information from different activities, but collecting data alone is not enough. The real value comes from understanding that information and using it to improve business performance.
An Analytics Dashboard helps organizations connect different data sources and create a complete picture of their operations. Managers can review important metrics, identify performance gaps, and take corrective actions when required.
Sales departments benefit significantly from Sales Dashboards because they provide visibility into customer behavior, revenue patterns, and sales progress. Sales managers can understand which strategies are performing well and where additional efforts are needed.
Operational teams can also use dashboard analytics to improve workflow efficiency. By reviewing performance information, businesses can identify unnecessary delays, optimize resources, and create better processes.
Benefits of Analytics Dashboard
1. Improves Business Decision-Making
This analytic dashboard helps businesses to make better decisions by offering instant and organised information. Managers can review performance of the business , identify the main trends, and understand business conditions quickly. Instead of depending on assumptions.
2. Saves Time in Data Analysis
An analytics dashboard reduces the time required to collect and analyze business information manually. With organized reports, visual data, and Analytical Charts, users can understand important details faster. This allows teams to focus more on improving performance rather than spending hours preparing and reviewing complex reports.
3. Enhances Sales Performance
Sales Dashboards help sales teams understand customer activities, revenue progress, and sales trends more effectively. Managers can monitor performance, identify successful strategies, and improve sales planning. By having clear visibility into sales information, businesses can increase efficiency and create better opportunities for revenue growth.
4. Provides Better Data Visibility
An Analytics Dashboard brings important business information together in one centralized platform. It removes the difficulty of managing multiple reports and provides a clear overview of different performance areas. Better visibility allows teams to understand business operations and take timely actions whenever improvement is required.
5. Improves Team Collaboration
A centralized dashboard helps different departments work with the same updated information. Teams can easily access important reports, understand business goals, and coordinate their activities more effectively. This improves communication between departments and creates a more connected working environment where decisions are based on shared data.
6. Supports Performance Tracking
Through Dashboard Analytics, organizations can continuously monitor important performance indicators and evaluate progress. Businesses can compare results, identify areas needing improvement, and measure the success of their strategies. Regular performance tracking helps companies maintain focus on their goals and improve their processes over time.
7. Creates Scalable Business Management
This analytics dashboard supports businesses when they grow , it provides a flexible way to manage bulk information . A well designed organised dashboard layout helps companies out and new data sources and reporting requirements easily. This makes the dashboard useful for both small business and large organisations.
Why Businesses Should Invest in an Analytics Dashboard
In the modern business environment, data has become one of the most valuable resources. However, collecting information is not enough; organizations need effective solutions to understand and use that data properly.An Analytics Dashboard provides businesses with a structured way to monitor performance, analyze trends, and improve decision-making. It transforms complex information into simple visual reports that are easier for teams and managers to understand.
Traditional reporting methods often require manual effort and consume valuable time. Employees may spend hours collecting data from different sources before they can create meaningful reports. A dashboard reduces this workload by automatically organizing information into a clear format.The use of Analytical Charts improves the way businesses understand performance. Visual representation makes it easier to identify changes, compare results, and recognize opportunities for improvement.
Conclusion
An Analytics Dashboard is an essential tool for businesses that want to understand their data and improve decision-making. It helps organizations transform complex information into meaningful insights through visual reports, performance tracking, and organized data presentation.With features like Dashboard Analytics, Analytical Charts, Sales Dashboards, and an effective Dashboard Layout, businesses can monitor performance, identify trends, and create better strategies for growth.
A modern dashboard reduces manual reporting efforts, improves team collaboration, and provides better visibility into business operations. Whether an organization wants to improve sales performance, track operational activities, or analyze business trends, an analytics dashboard provides the required insights.
Frequently Asked Questions (FAQs)
1. What is an Analytics Dashboard?
A Multi Purpose Themes Analytics Dashboard is a digital platform that collects and displays important business information in an easy-to-understand format. It helps organizations monitor performance, analyze trends, and make better decisions using real-time or updated data. Businesses use analytics dashboards to understand sales activities, customer behavior, operational performance, and other important metrics from one centralized location.
2. Why do businesses need an Analytics Dashboard?
Businesses need a Multi Purpose Themes Analytics Dashboard because large amounts of data can become difficult to manage without proper organization. A dashboard simplifies complex information and presents it through visual reports and charts. It helps managers understand business performance, identify improvement opportunities, and make faster decisions based on accurate information.
3. How do Analytical Charts help in data analysis?
Analytical Charts help users understand complex information by converting numbers and reports into visual formats. Charts make it easier to identify patterns, compare performance, and recognize important changes. Instead of reading long reports, businesses can quickly understand key insights and use them for planning and decision-making.
4. Can small businesses use an Analytics Dashboard?
Yes, small businesses can use an Analytics Dashboard to improve their operations and understand business performance. Dashboards are not limited to large companies. Small organizations can use them to monitor sales, track customer activities, analyze growth patterns, and make better decisions without depending on complicated reporting systems.
5. Why is Dashboard Layout important for analytics systems?
A proper Dashboard Layout is important because it determines how easily users can access and understand information. A well-organized layout places important data in the right position, reduces confusion, and improves user experience. Good dashboard design allows managers and teams to find valuable insights quickly.
7. How does Dashboard Analytics improve business growth?
Multi Purpose Themes Dashboard Analytics helps businesses identify trends, measure performance, and discover opportunities for improvement. By understanding accurate data, companies can create better strategies, optimize operations, and make informed decisions. It supports long-term growth by helping organizations understand their current position and plan future actions effectively.

Related Posts