

Today, almost every business runs on WebApps. From customer management systems to eCommerce platforms, from…
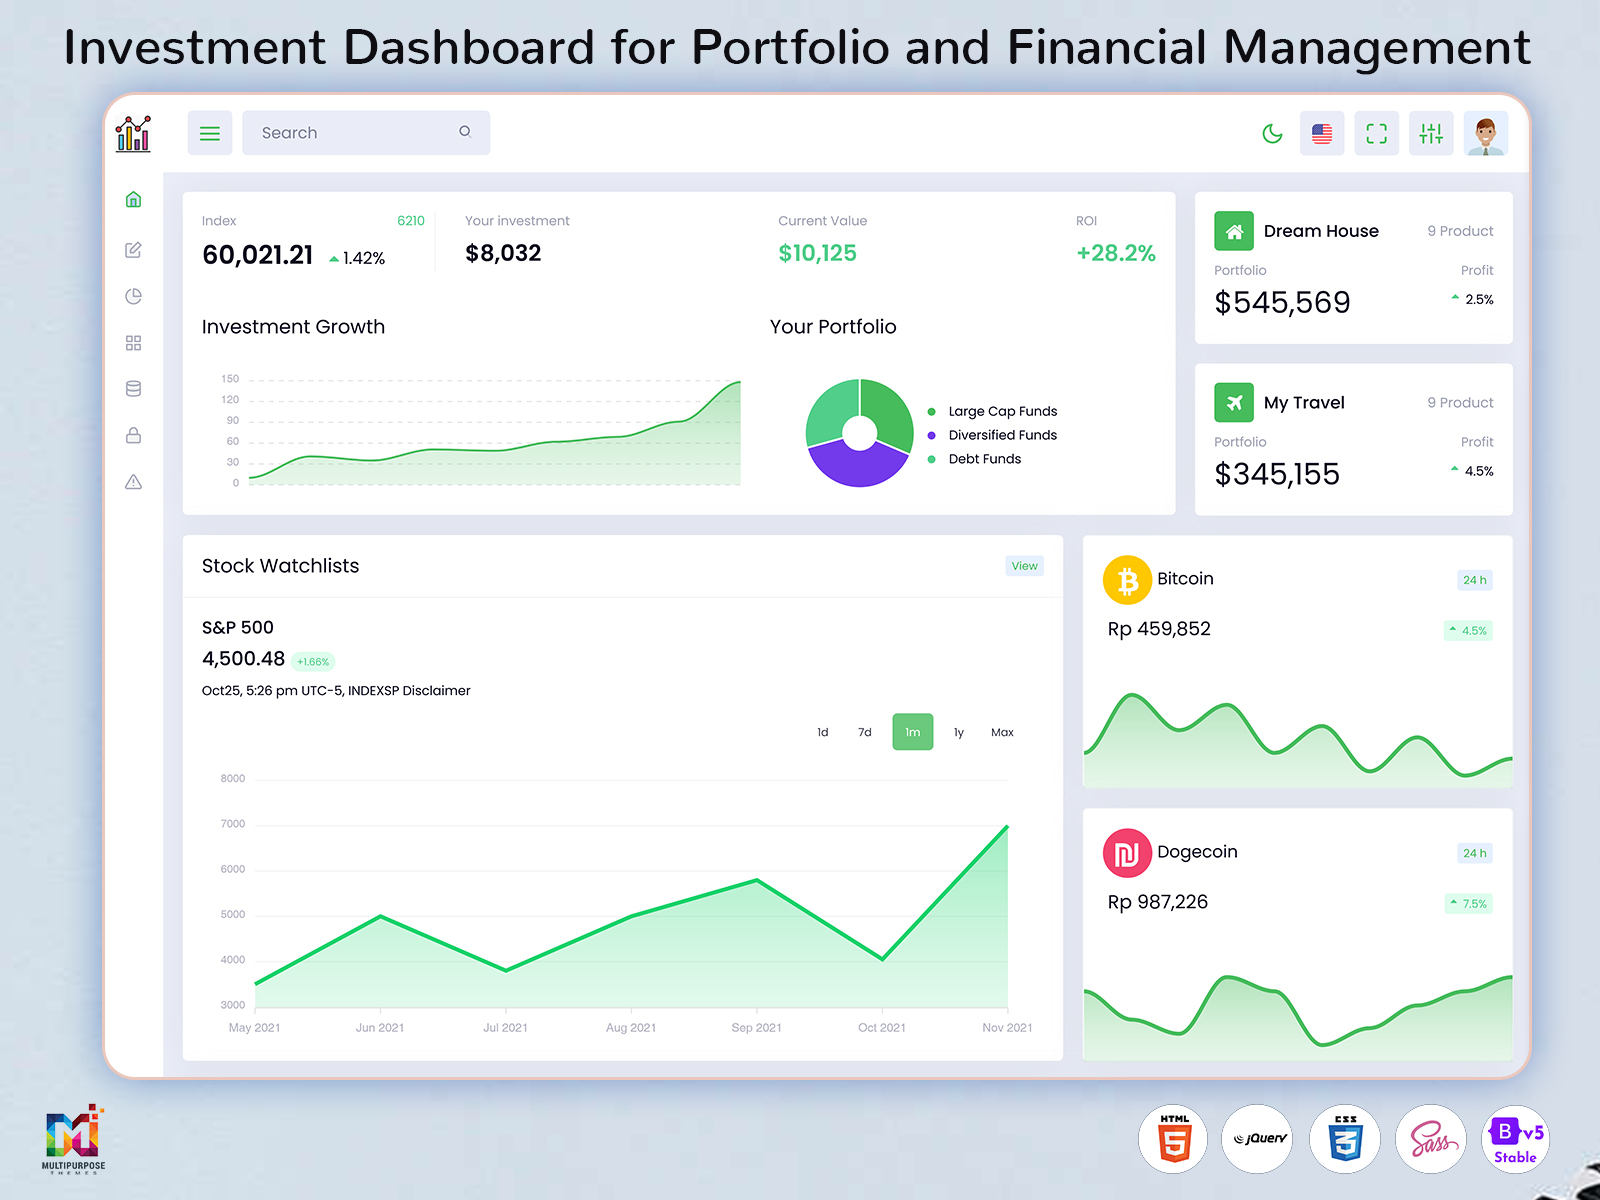
Investment Dashboard: Organizing Financial and Portfolio Management
Reading Time: 11 minutes
The management of investments requires a processing of data. Information pertaining to the records of a portfolio, descriptions of assets, transaction records and financial reports, performance statistics, and account details have to be kept in order. As financial data grows and diversifies it can become scattered, turning a simple review of an investment into a demanding procedure.
Watch Full Video
An Investment Dashboard is a space where this information can be processed. Than viewing a series of unrelated documents an Investment Dashboard arranges the data in a way that investors, financial directors, consultants and asset managers expect. I find an Investment Dashboard, for anyone working with financial data.
The intent is not simply to display figures but to interpret their meaning and relevance in a unified context. When the figures are organized and described the interface becomes an accessible spot, for portfolio reviews financial reports, documentation and general communication and the interface feels easier to use because of those organized figures.
What Is an Investment Dashboard?
The Investment Dashboard helps you keep all investment and portfolio information in one place. This tool gathers your records and numbers so you can see them easily. Information pertaining to assets, transaction records, portfolio distribution, financial reports, performance statistics, and related figures can be viewed and reviewed. As an investment grows and accumulates its data will become more difficult to order and review. An individual can keep track of assets and spend considerable time organizing and comparing figures. An investment firm can have several users reviewing the same information in different formats. An Investment Dashboard makes it easier to handle this data. It gives users a place to look over the details of an investment. Everyone can see the information, in one spot. This helps teams stay on the page. It also saves time when reviewing investment facts. The dashboard keeps things simple and clear.
A dashboard can be used to get a look at a portfolio. It allows you to explore assets in more detail. You can also access documents and transaction records related to an investment. I find the Financial Analytics Dashboard very useful. The Financial Analytics Dashboard works closely with the Investment Dashboard. Together the Financial Analytics Dashboard and the Investment Dashboard help organize data making research and analysis easier. This combination makes it easier to understand investment performance and make decisions. Rather than simply displaying the value of an investment its statistics can be analyzed in conjunction with comparable figures and historical records in order to better understand its performance. An Asset Management Dashboard can be utilized to categorize investments, helping to maintain order as new assets are acquired or new portfolios are formed.
Investment dashboards can be structured to suit different user groups. An individual investor reviewing a personal portfolio will have different requirements to an investment firm that manages multiple portfolios. A dashboard interface can be developed to prioritize certain procedures or data sets depending on the users that will employ it.
The purpose of an Investment Dashboard is organization. I think financial expertise is still vital. Investment data management becomes easier. I see that information if viewed alone can be put together linked and examined.
Making Investment Information Easier to Review
Reviewing investment information is harder when data is not centralized. Statements, transaction records, asset descriptions, market research and supporting documents all hold investment details that must be examined next to each other. An investment dashboard can bring these numbers together giving an overview of an investment portfolio and its statistics. Users can then look at an investment, from a view or click a link to study particular investment details more closely. Unlike a spreadsheet or a single financial statement a dashboard brings order to the data. It makes investment reviews easier, by showing only what matters. The dashboard keeps the view clean and organized. It helps you see the picture without getting lost in details. Everything stays in place so you can focus on what’s important.
For example I see that a portfolio director may want to review the categorization of an investment before diving, into the details of each asset. I also see that a financial analyst may want to review an overview of an investment before clicking a link to look at the supporting transaction records of a sub‑category. An interface that displays figures in a structured format can also be supplemented by Investment Tracking Software that allows users to sort and review data points that would otherwise require extensive research.
A dashboard should be structured to simplify the information review process. Users will have to deal with several tasks and responsibilities, and will have to view different data sets at varying levels of detail. Displaying all relevant data at the same level of detail will overwhelm users and create unecessary complexity. Portfolio statistics, for instance, should be presented in an easily-accessible manner, and expanded upon when a user wishes to examine it further.

VIEW DEMO BUY NOW
Features of an Investment Dashboard
1. Portfolio Structure
An area of the Investment Dashboard can be set aside for portfolio organization. On the Investment Dashboard transaction records, assets and other data can be sorted by account, category, portfolio and other criteria. This will give users an overview of an investment, allowing them to see how its contents are distributed.
2. Asset Categorization
An Asset Management Dashboard can be utilized to sort holdings by category. This will place similar assets together, giving users a better understanding of the contents of a portfolio. Categorization will continue to be relevant as an investment grows and acquires more assets.
3. Financial Performance Reporting
A Financial Performance Dashboard can be utilized to organize performance statistics. Users can select relevant data points before following a link to analyze the figures further.
4. Transaction Record Management
Transactions will definitely affect an investment. An Investment Dashboard can be used to organize these records helping with audits, reviews and everyday organization.
5. Financial Data Visualization
Data points, when organized visually, can be easier to follow and analyze. A Financial Analytics Dashboard can be implemented to provide a series of statistical displays that can be expanded to reveal additional insights. The data points should also be cross-referenced to provide necessary context and comparative analysis.
6. Detailed Asset Views
While an overview of an investment is useful some users may need to review specific assets. Viewing an individual holding will not disrupt the context of an investor’s review, and will provide the necessary information without presenting irrelevant data.
7. Structured User Access
An Investment Dashboard can be used by different people. Each person will have their ideas about what they want to see. Administrators, financial directors, investors and analysts all need things from an investment dashboard. The way the dashboard looks can change to fit the needs of each person. It can show the information and the right tools, for each user.

VIEW DEMO BUY NOW
Creating a Practical Investment Management Workspace
An effective Investment Dashboard will function as a financial review tool. Figures and statistics will be organized in a manner that facilitates analysis and comparison. An investor will not benefit from reviewing an isolated set of data points, but will instead need to examine how these sets relate to one another. Cross-referencing will be particularly important when analyzing an investment’s performance, as the figures must be examined alongside market research and transaction records. An interface that displays related data sets in proximity to one another will streamline the review process.
A dashboard is particularly useful for organizations that manage multiple portfolios. While these entities have different fund allocations and financial objectives, they will both benefit from an interface that streamlines the management of its data. If an investment firm utilizes a single dashboard for its portfolio management needs its directors will be able to access an overview of these portfolios. They will be able to follow a link to analyze each portfolio’s transactions, assets, performance, and other relevant data points.
Investment Tracking Software can be utilized to manage and store investment data within a dashboard. This will centralize the information for users, reducing the amount of navigation required to access relevant data. If a financial analyst checks the transaction records of a portfolio on a basis they will be able to go to the right part of the system and look at the numbers. The program will help with the analysis by showing data and statistics that help the analyst get a better idea of the numbers.
The distinction between tracking and analyzing is also important. The former is concerned with the process of record-keeping, while the latter involves utilizing relevant data sets to identify patterns. An Investment Dashboard will have to provide both, giving users an overview of relevant statistics while also allowing them to follow a link and analyze the figures in greater detail. If a user has concerns regarding a specific portfolio allocation they can first review the overview before following a link to analyze the associated transaction records.
A similar approach can be taken when generating reports and documentation. Reports pertaining to an investment’s performance can be compiled in a Financial Performance Dashboard. Users can follow a link to access the supporting documentation, retrieving the necessary information without disrupting the report generation process.
An Asset Management Dashboard can also help an organization keep its asset records in order. Categories will help sort holdings, allowing directors to allocate funds accordingly. Records pertaining to a single asset can be accessed, edited, and retrieved, facilitating the management of larger portfolios.
An Investment Dashboard can assist organizations in providing a consistent interface for financial operations. Portfolio reviews, transaction records, and report generation can be performed in a manner that does not require excessive navigation. Users will also have greater awareness of the data sets that are relevant for their operations. While financial documentation and records management will remain a responsibility a dashboard will reduce the complexity of the process.
From a developer’s perspective the primary consideration should be the presentation of financial data. A suitable template will establish the page layout and navigation structure, allowing developers to add cards, reports, charts, profile management tools, and additional features. The template will also have an appropriate color scheme and interactive elements that can be edited to suit the requirements of the investment application.
The result will be an interface that supports the financial management needs of its users without overwhelming them. This will reduce the complexity of the application, improving its usability and encouraging continued use.
Benefits of an Investment Dashboard
1. Centralizes Financial Information
An Investment Dashboard will consolidate information pertaining to an investment. This will reduce the navigation required to access relevant data sets, as the records, transactions, assets, and performance statistics will be displayed in one location.
2. Simplifies Portfolio Reviews
A structured dashboard will give an investor or financial director an overview of an investment. General statistics will be provided, and specific data points will be followed by links that lead to related records. This will enable a user to review a portfolio without having to sort through unrelated figures and statistics.
3. Improves Asset Organization
An Asset Management Dashboard will be vital in sorting and categorizing holdings. As a portfolio grows its contents will need to be organized, separating different classes of assets and categorizing them according to the preferences of an investor.
4. Supports Consistent Reporting
Financial directors may need to generate performance reports or review this documentation on a regular basis. A consistent dashboard theme will make it easier for analysts and directors to compile reports, as the relevant information will be consistently displayed and organized.
5. Reduces Manual Information Searching
Users may need access to a series of financial records, statements, or other documents. An Investment Dashboard will reduce the manual searching required to locate these records, providing a consistent data set that is easily navigated.
6. Provides Better Data Context
Financial figures become more valuable when examined in context rather than in isolation. An interface that cross-references financial statistics will support analysts, directors, and investors, as they will have access to relevant data points.
7. Creates a Scalable Workspace
As an investment grows its portfolio will have more assets and require additional management. A well-structured dashboard will scale with the operation, supporting greater amounts of data while still providing a consistent interface that is simple to navigate.
How Investment Dashboards Fit Different Financial Workflows
An Investment Dashboard is not a standardized tool, as it caters to the specific needs of the applications that implement it. A single investor will have different requirements to an investment firm that manages multiple portfolios. The former will need assistance with personal portfolio management, while the latter will need to maintain client-specific data sets, manage multiple portfolios, and analyze performance statistics.
For most users a dashboard will be the primary interface for financial management. It will consolidate the relevant information, enabling a consistent review of an investment’s performance, portfolio contents, transaction records, and supporting documentation. Within an organization a dashboard can be used to organize a portfolio, access its performance reports, and make adjustments as required. An Investment Tracking Software interface can be utilized to store and manage this data, providing a consistent space in which to review and analyze records and statistics. This feature can be supplemented by a Financial Performance Dashboard, which will allow directors and analysts to access performance reports and statistics. The Asset Management Dashboard will provide the tools to sort and categorize assets, and will become more important as a portfolio grows.
From a development perspective the most important consideration should be the intended use. A clean layout with appropriate navigation will be more important than attempting to display every available statistic. Navigation will reduce the complexity of the interface, as users will be able to follow links and access the data sets that they need rather than sifting through irrelevant information.
Why Multipurpose Themes Can Be Considered for Investment Dashboard Projects
Multipurpose Themes offers a selection of investment dashboard and financial admin dashboards along with HTML admin dashboard templates that can be used for a variety of applications. Its current collection of investment dashboard templates includes financial admin dashboards, and its larger selection of admin templates also includes dashboard and financial interfaces that developers can customize. The company maintains a collection of admin dashboards for apps, including investment-specific solutions.
Conclusion
An Investment Dashboard will support the management and analysis of an investment, providing a consistent overview of its performance and portfolio. Statistics, records, and reports can be viewed and analyzed, and related data sets can be accessed through intuitive navigation. A Financial Dashboard can be utilized for financial analysis and auditing, while an Asset Management Dashboard will help categorize and organize an investment’s holdings. Investment Tracking Software will store and manage this data, and a Financial Performance Dashboard will give analysts and directors the tools to analyze and generate performance reports. The key consideration should be the ability to structure the interface and provide the necessary tools for financial management. Rather than displaying isolated figures an investment interface should make it easier for users to find, analyze, and compare data sets.
VIEW DEMO BUY NOW
Frequently Asked Questions (FAQs)
1. What Is the Purpose of an Investment Dashboard?
An Multipurpose Themes Investment Dashboard is used to consolidate investment data, providing a consistent overview of an investment’s portfolio, assets, transactions, performance statistics, and reports. This will make it easier for directors, analysts, or independent investors to access relevant data without navigating multiple unrelated documents.
2. Can an Investment Dashboard Manage Different Asset Categories?
An Investment Dashboard can be structured to sort assets into categories. An Asset Management Dashboard, in particular, will display these categories, helping to maintain order as new investments are made.
3. How Does Investment Tracking Software Help With Portfolio Management?
Investment Tracking Software will be used to manage and store investment-related data and records. This will help portfolio directors and analysts sort and analyze this information, which can become overwhelming as the investment grows. The software will become an organizational tool for reviewing a portfolio’s performance and records.
4. What Information Should a Financial Analytics Dashboard Display?
The specific information that a Multipurpose Themes Financial Analytics Dashboard will display depends on the requirements of the application. It can be used to display the relevant data sets pertaining to an investment, including performance statistics, asset categorization, transaction records, and comparative figures. The interface should make it easier for analysts to access the relevant information for their needs.
5. Is an Investment Dashboard Suitable, for Financial Companies?
Yes. Financial companies can utilize an Investment Dashboard to organize and analyze the details of an investment. The interface can be modified to support the needs of the users, and the specific data sets will depend on the application’s requirements and the data that is being managed.
6. Can an Investment Dashboard Be Customized for a Specific Business?
A dashboard can be adapted to meet the requirements of a specific business. Developers can modify the navigation and page structure, and can replace or edit existing components, tables, cards, charts, and other features. Additional logic will be required for the application’s specific functions, and will depend on the technology that is being used.
7. What Should I Consider Before Choosing an Investment Dashboard Template?
Consider the layout, responsiveness, customization options, and component availability of an Multipurpose Themes Investment Dashboard template. The navigation and structure of the interface will affect its usability, and will determine how easily users can access the relevant data sets for their needs. Developers will also have to consider the tools that will be used, the financial data that will be managed, and the specific requirements of their application. The interface should be scalable, and should be capable of managing and displaying portfolio data, assets, and reports.

Related Posts


This Post Has 0 Comments