

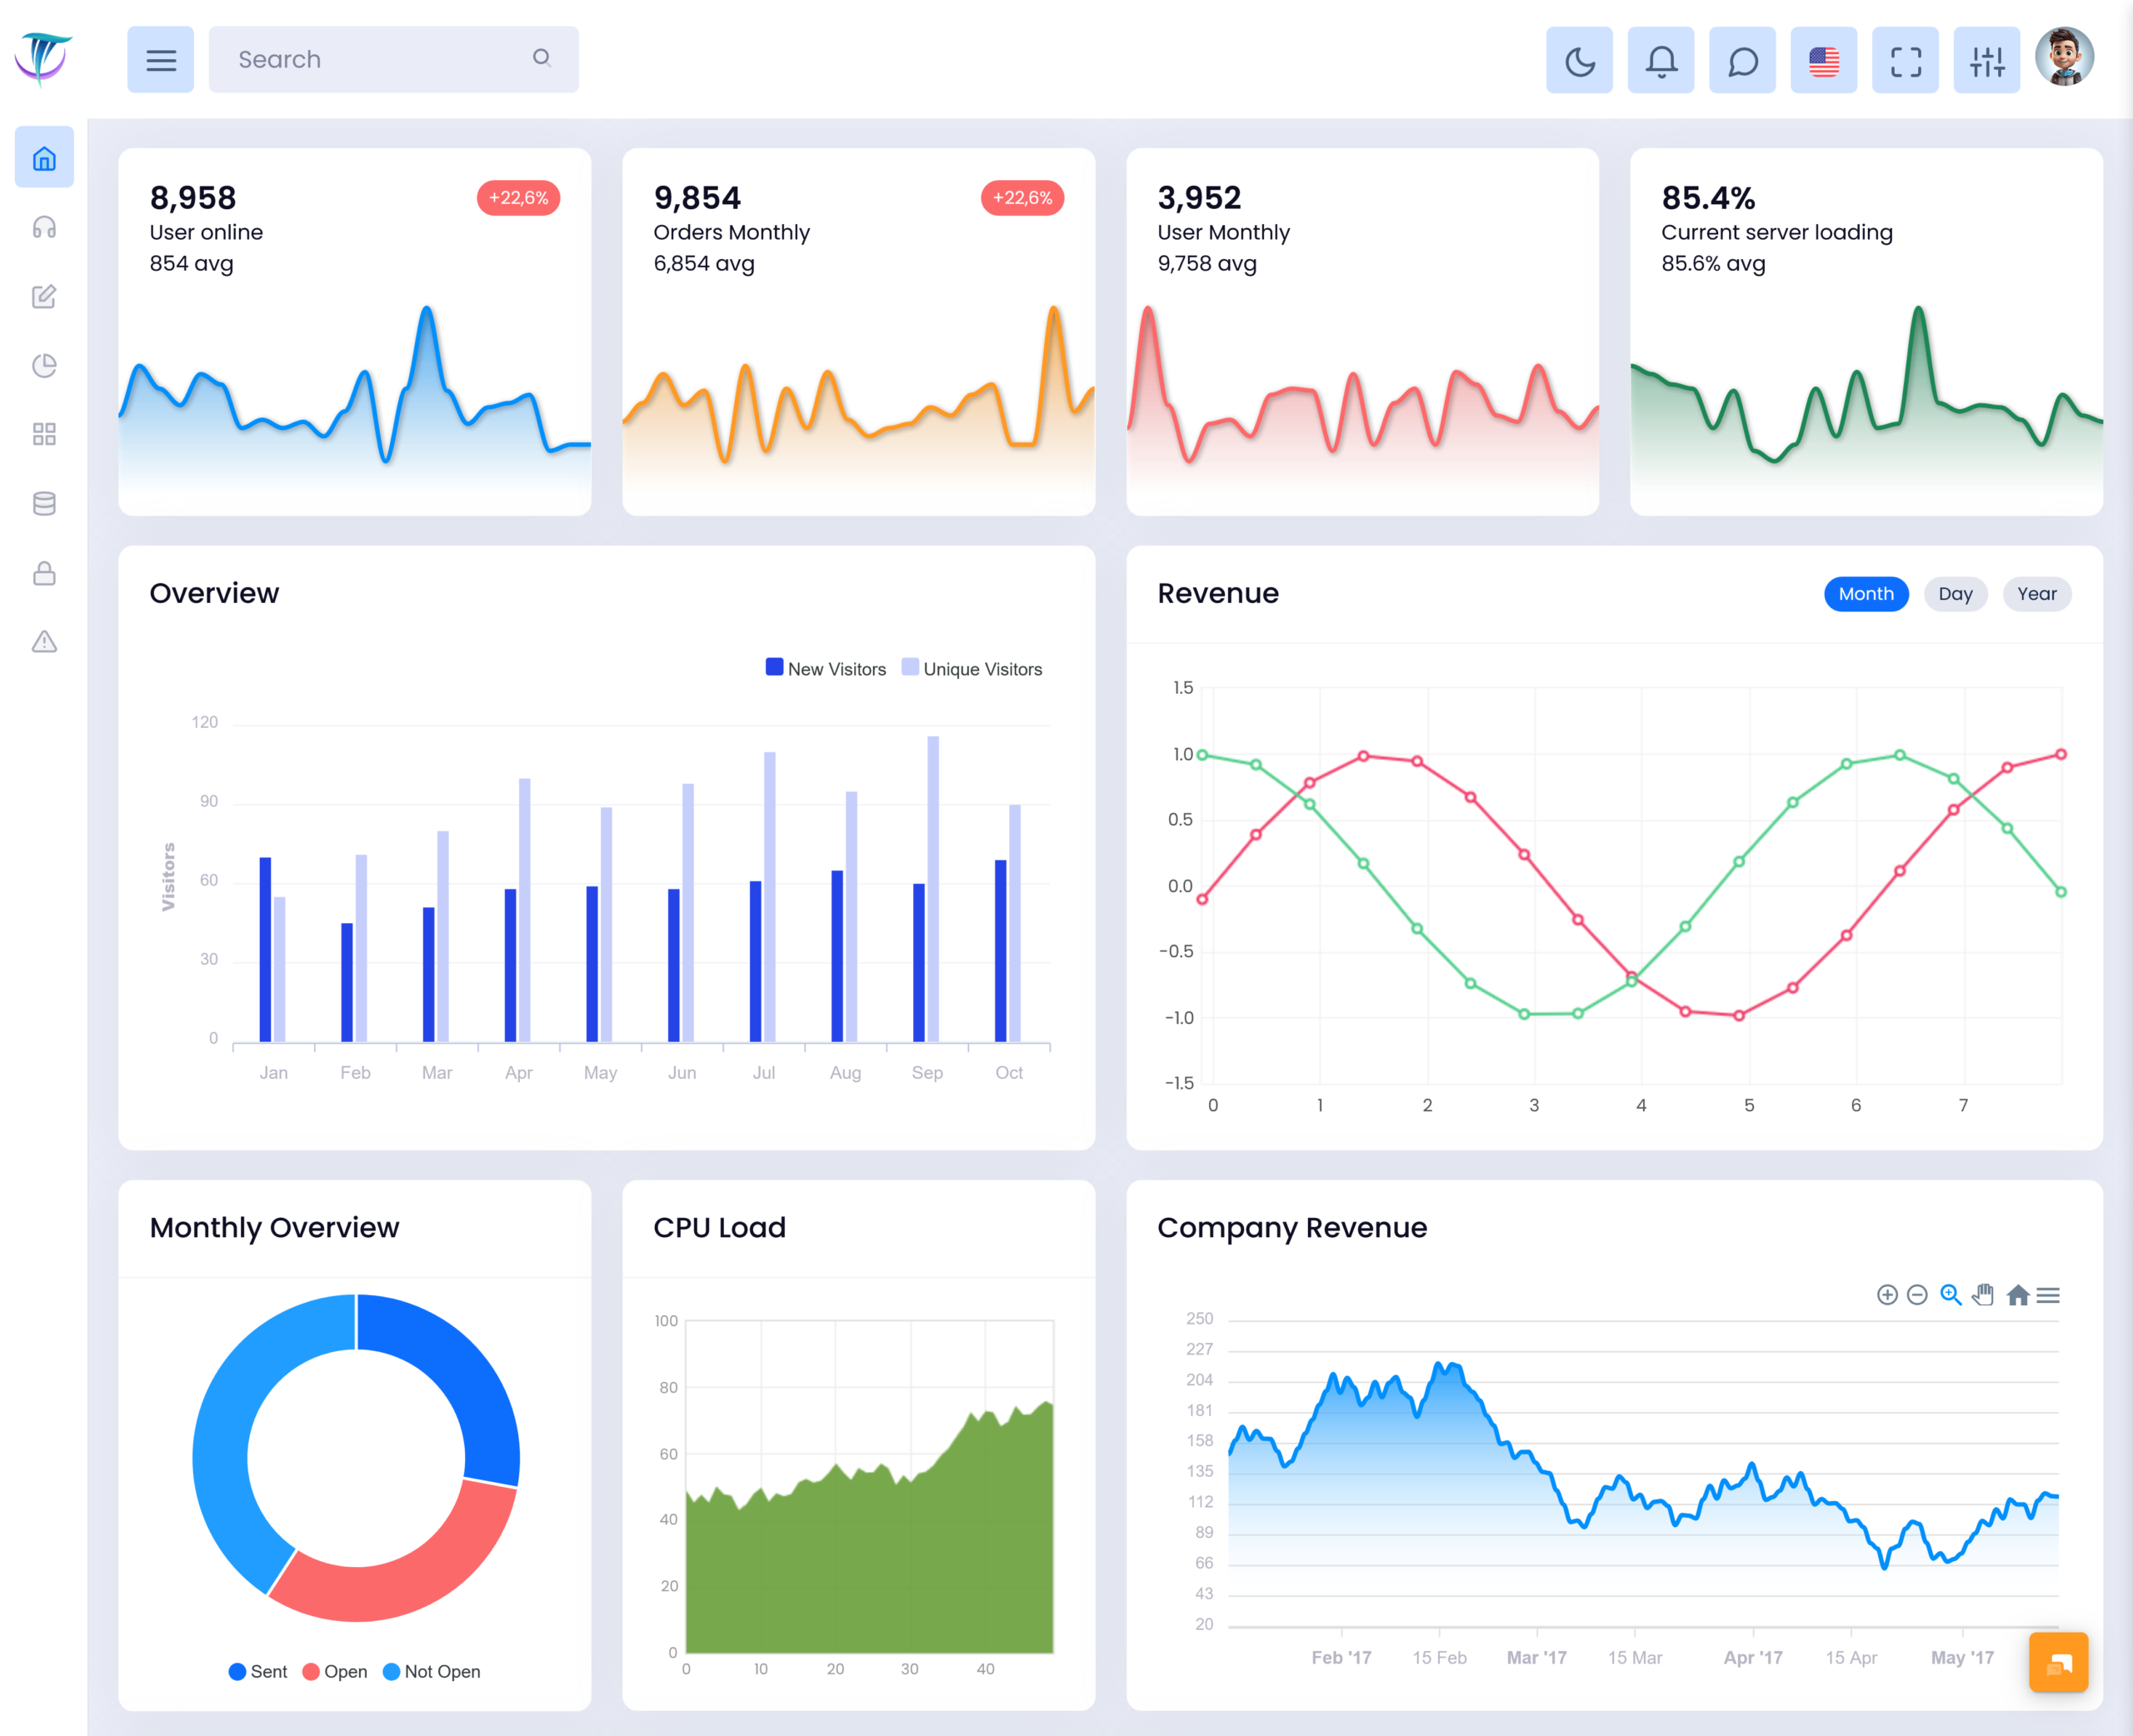
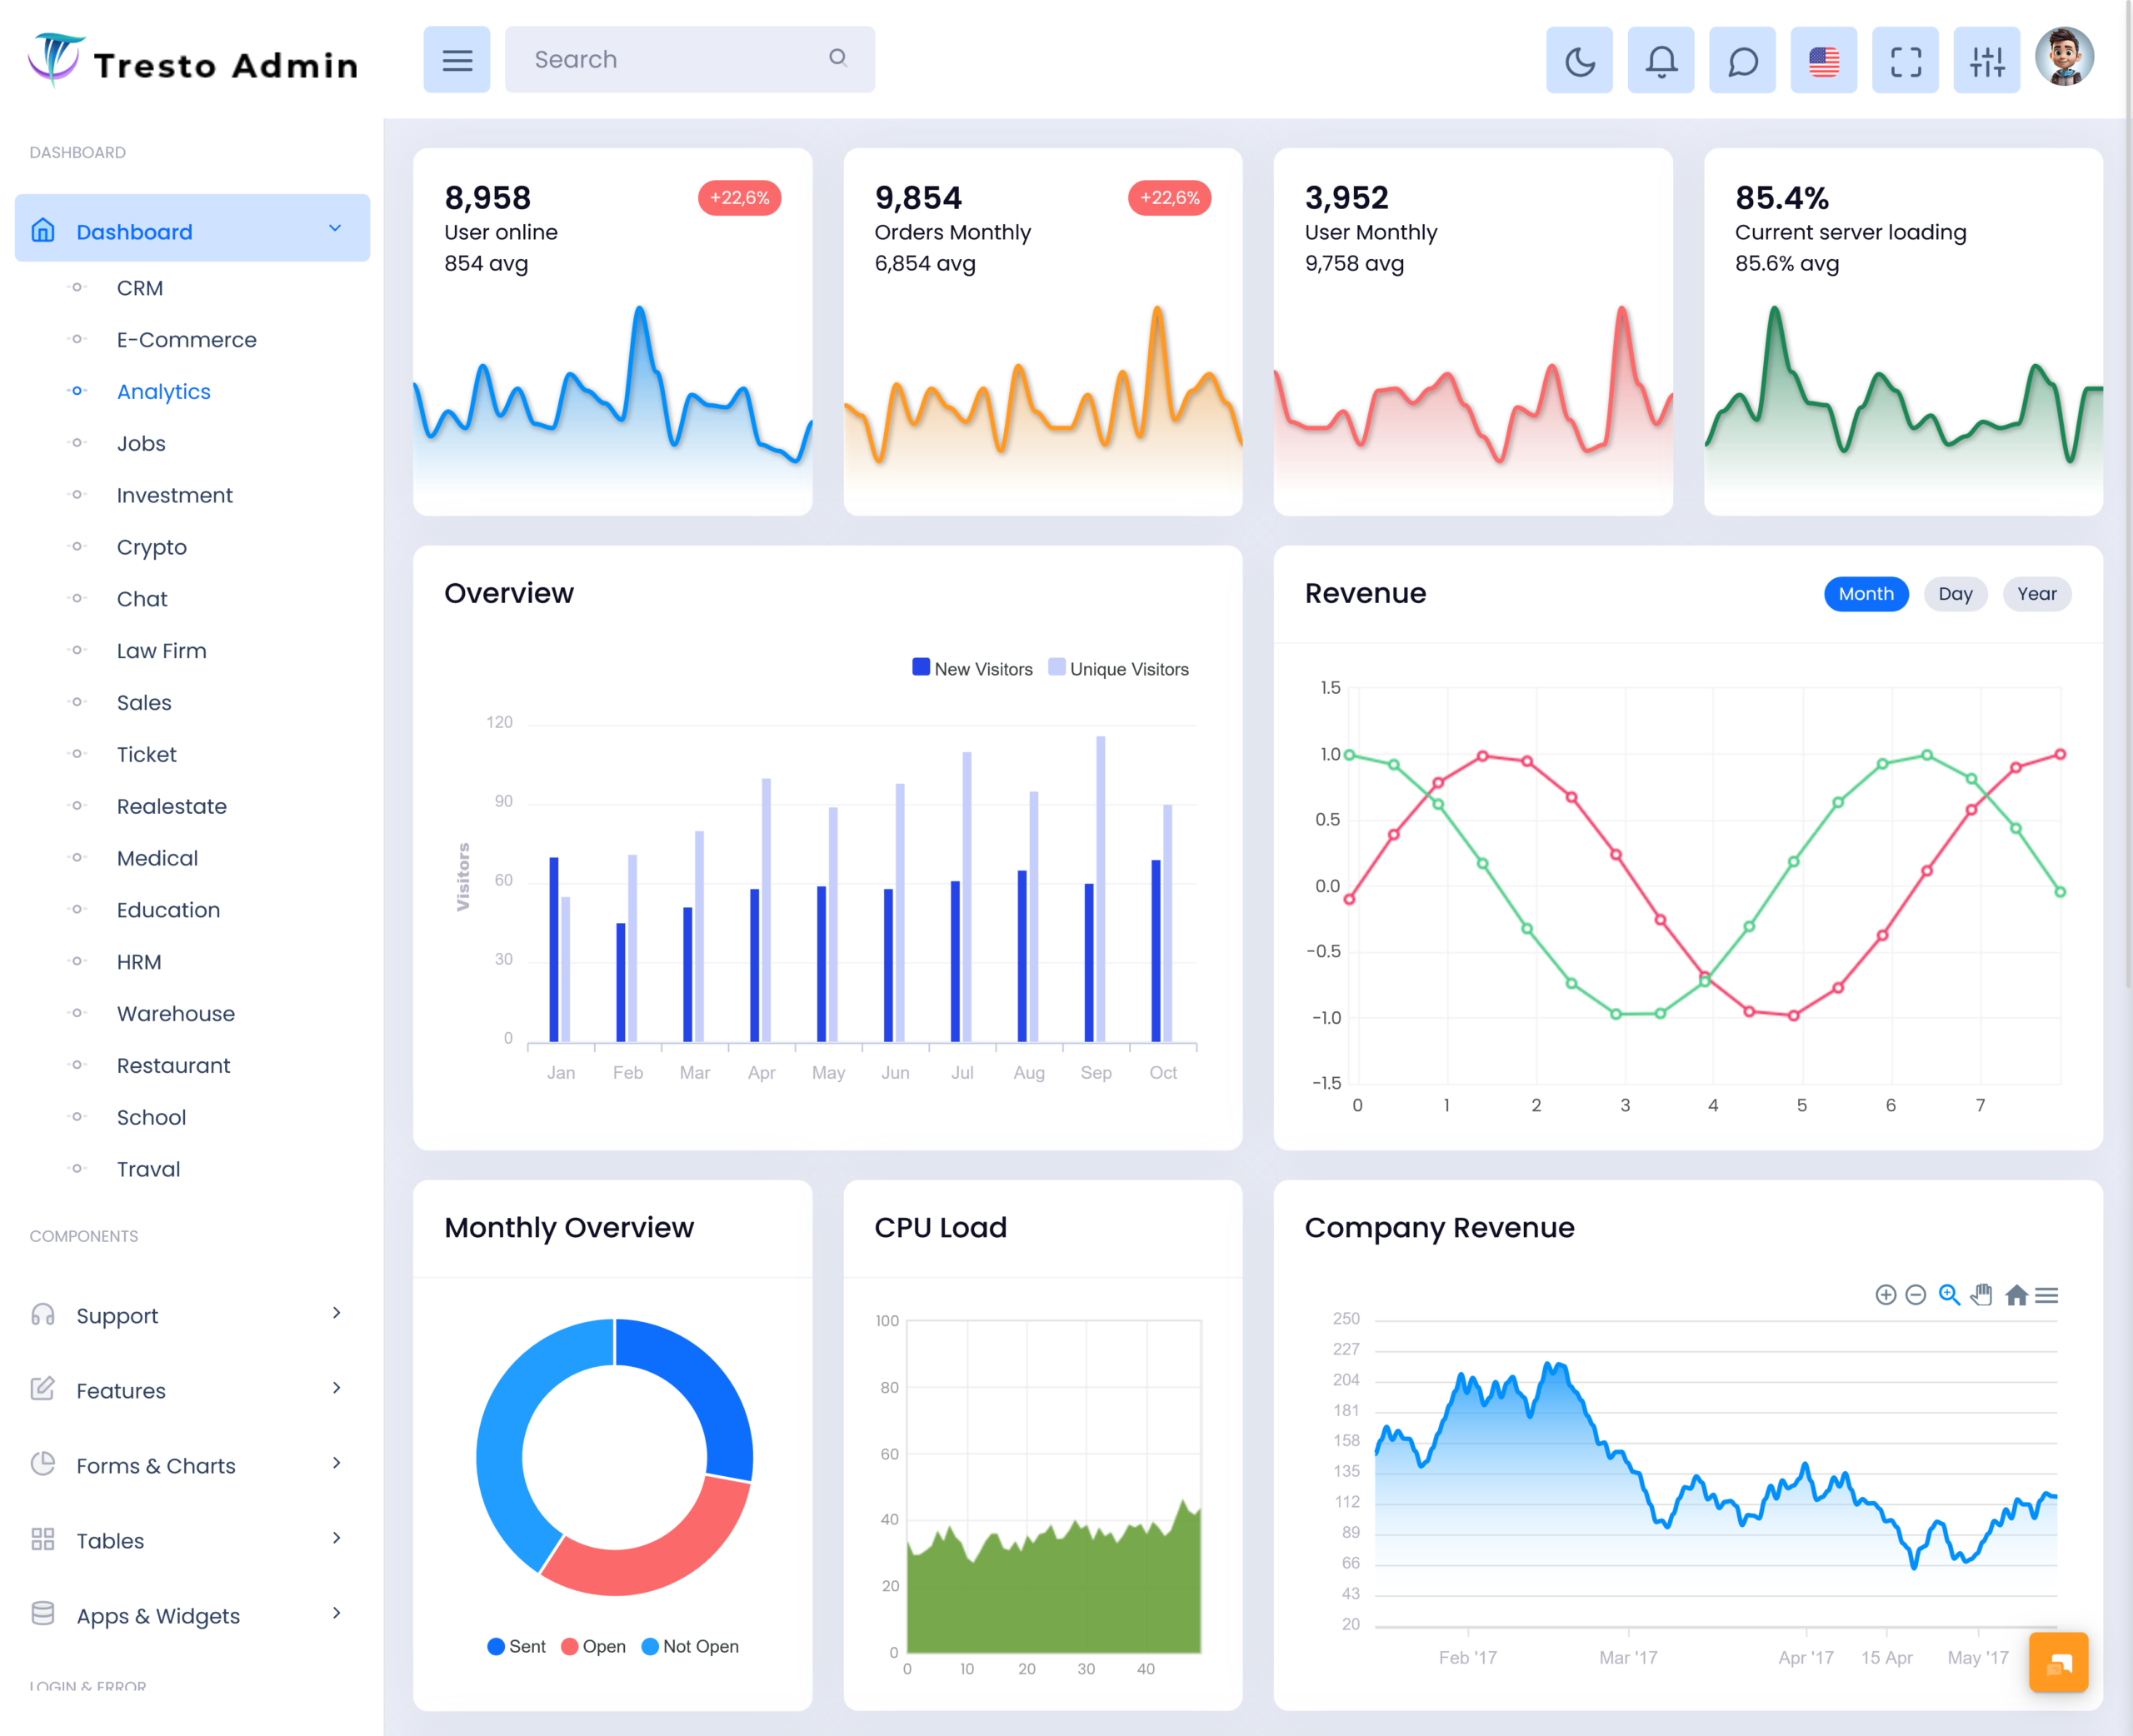
Businesses make a bulk amount of information every day.sales transactions, customer activity, website visits, payments,…
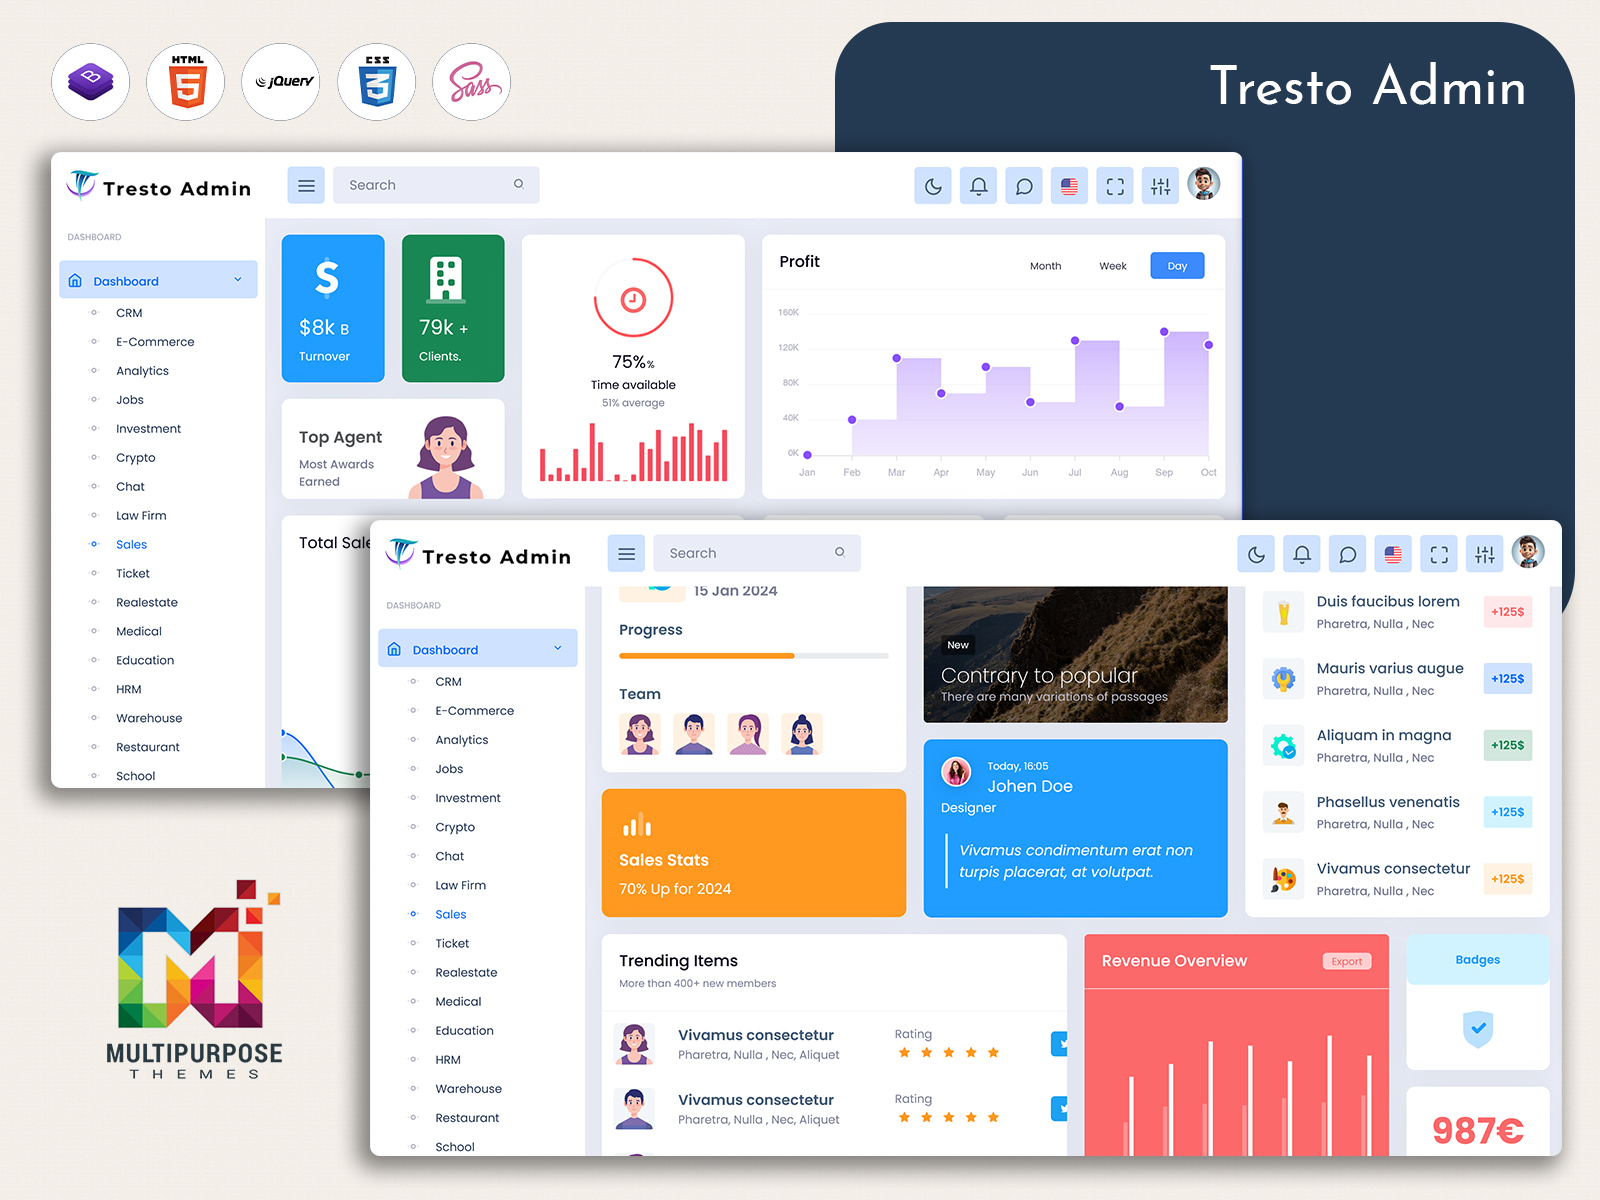
Business Intelligence Dashboard: Transform Business Data into Smarter Decisions
Reading Time: 7 minutes
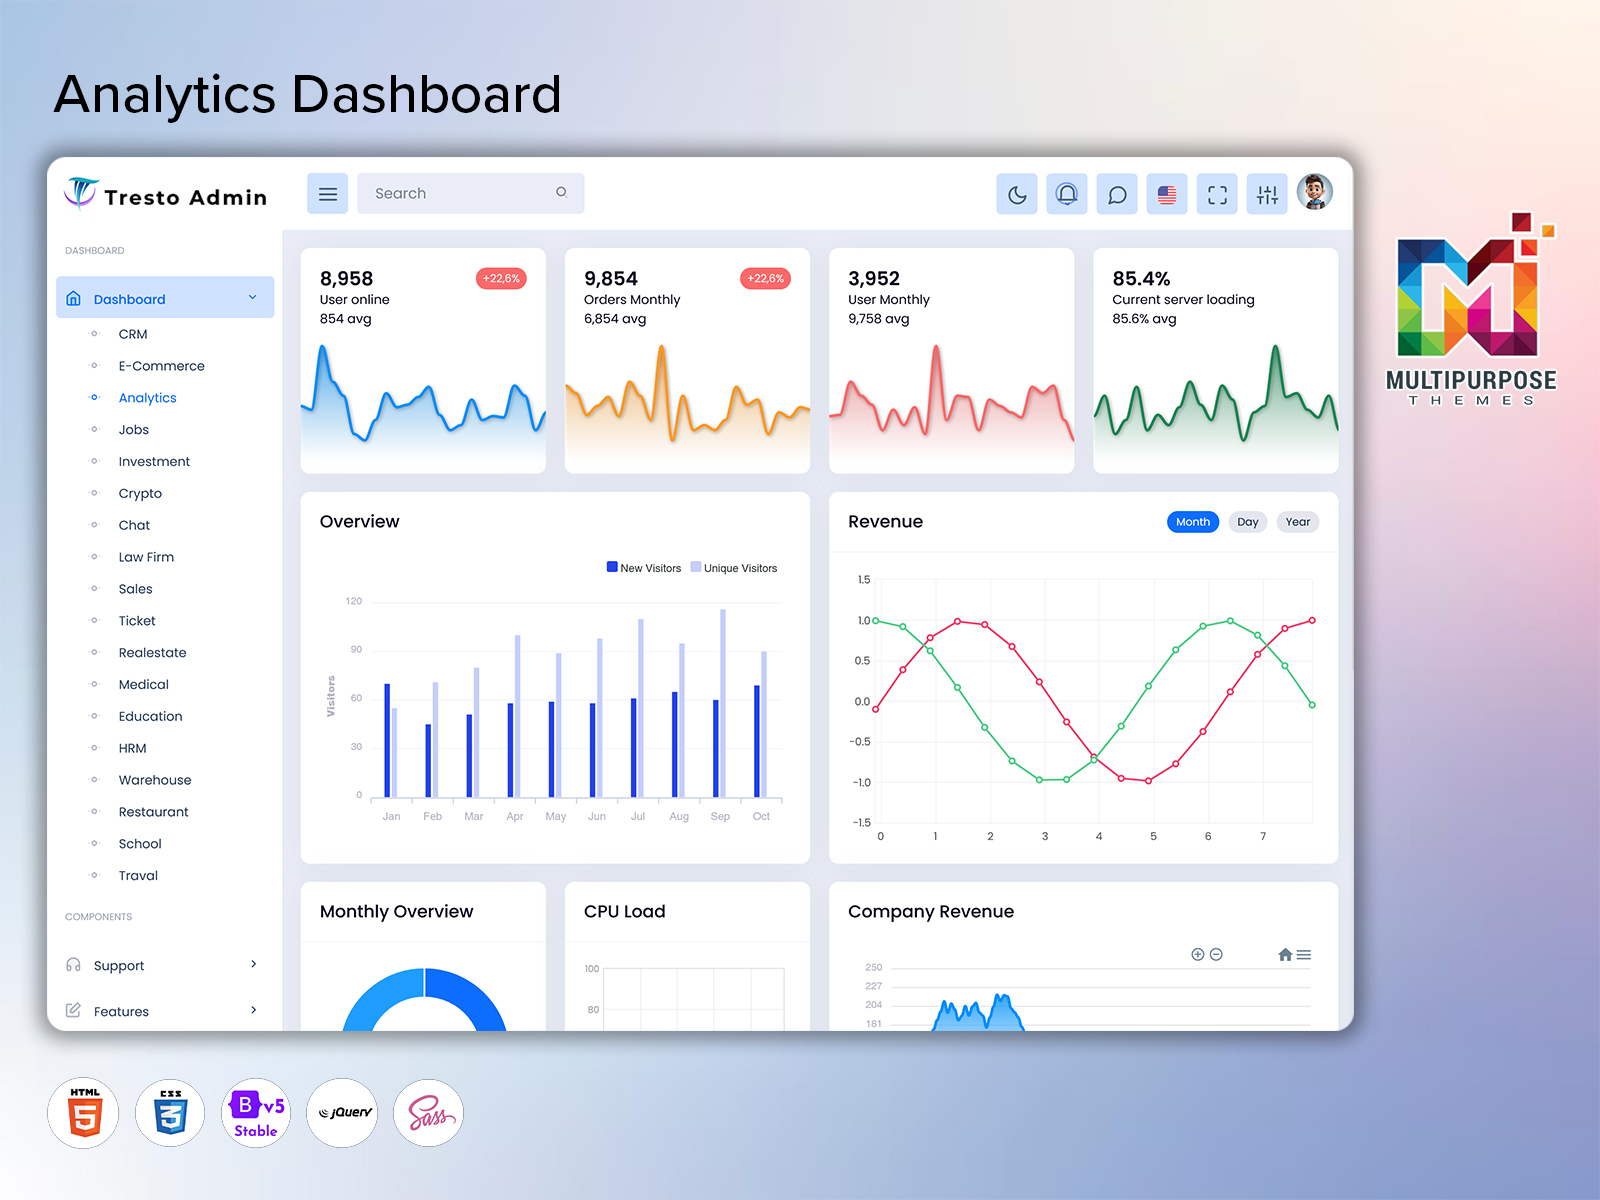
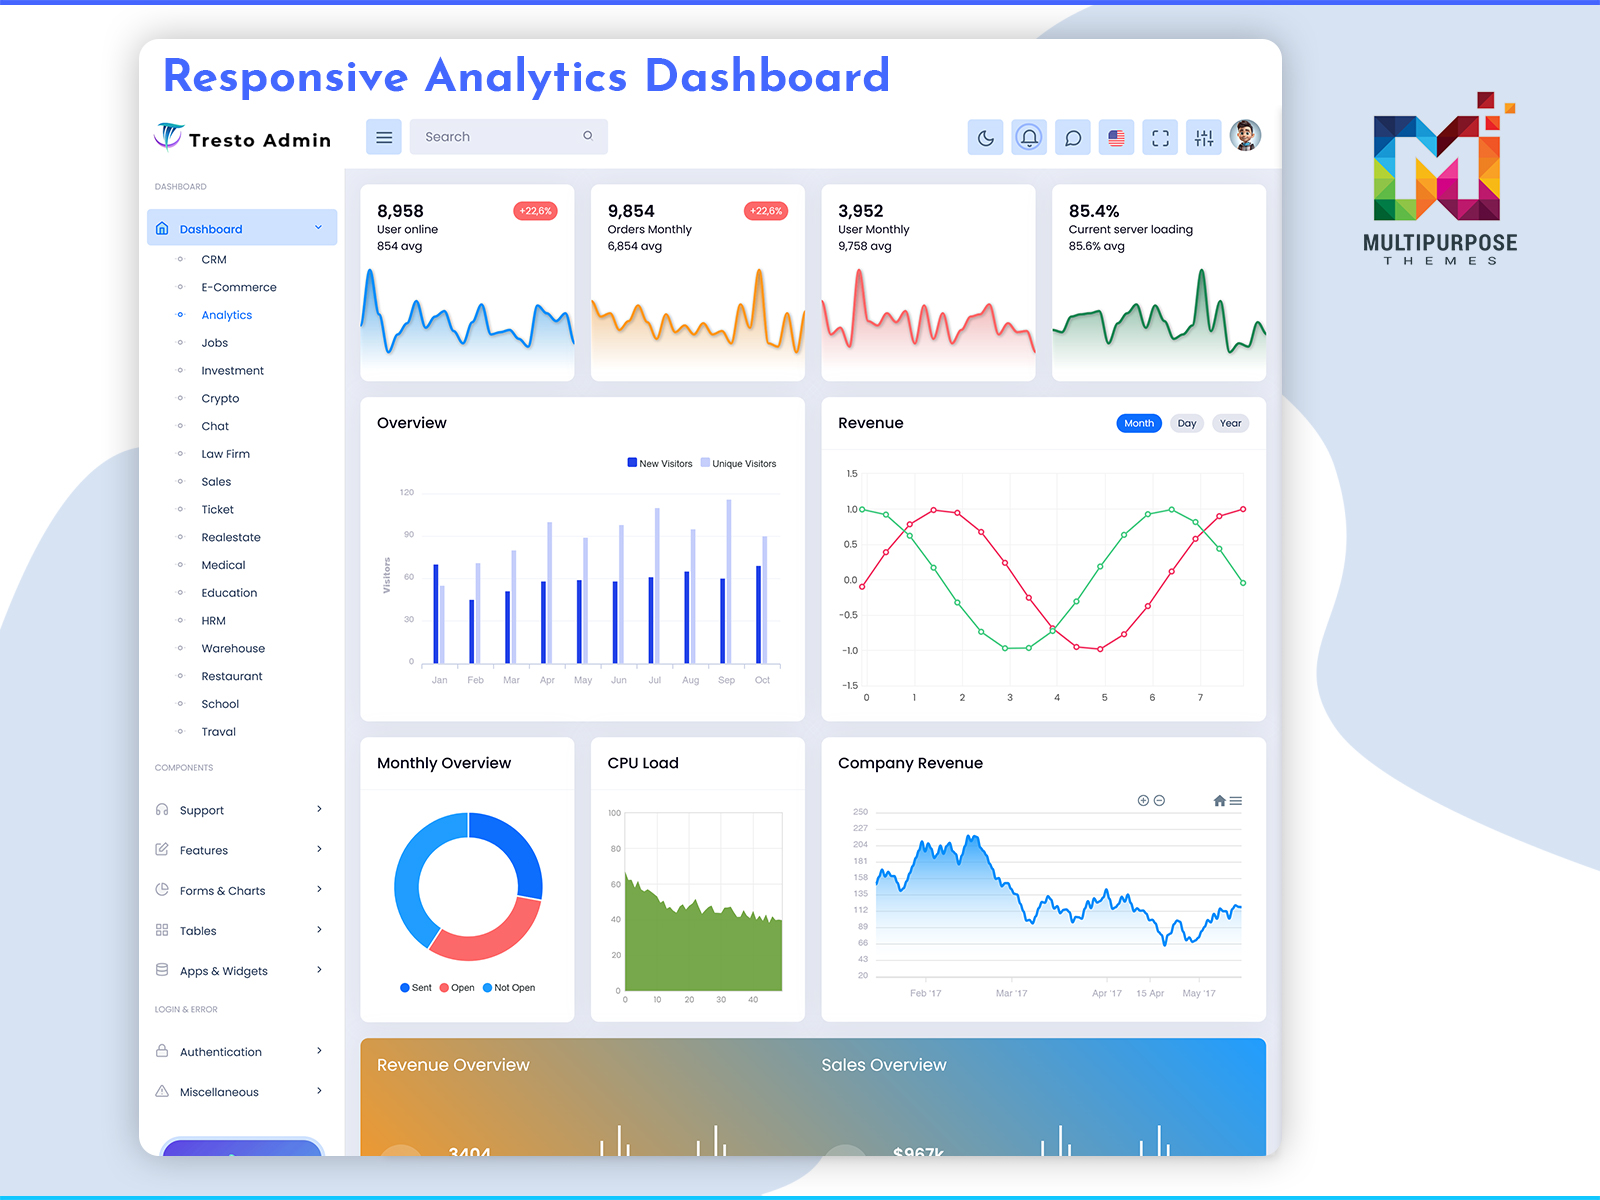
Modern businesses collect large amounts of information every day. Sales records, customer activities, financial updates, project progress, and marketing performance all create valuable data. However, raw numbers alone cannot help organizations make better decisions. They need a smarter way to organize, understand, and monitor everything from a single place. That is where an Analytical Dashboard becomes an essential business tool.An Analytical Dashboard brings important metrics together in one interactive interface, making complex information easy to understand. Instead of searching through multiple spreadsheets or reports, users can quickly access visual charts, performance indicators, and Real-Time Insights that support faster decision-making.
Watch Full Video
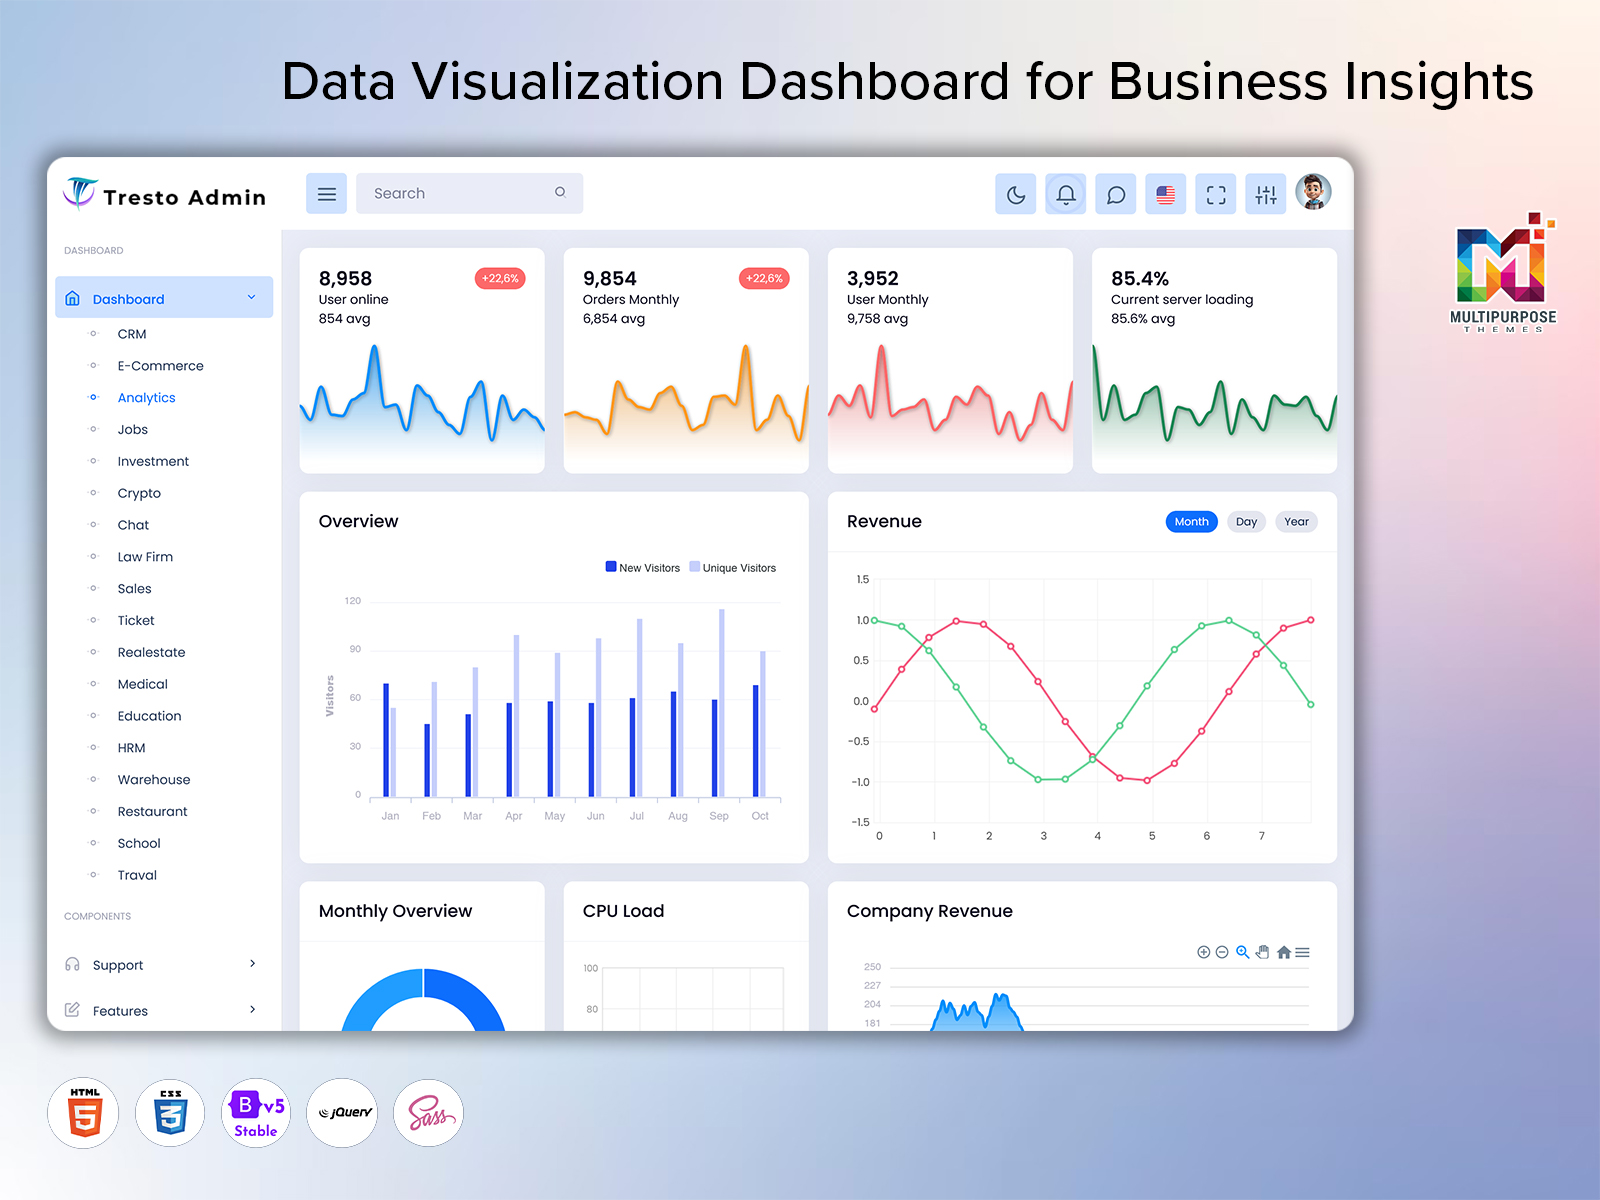
A well-designed Data Visualization Dashboard transforms business information into meaningful graphs, charts, and reports. These visual elements help users identify trends, compare performance, and detect opportunities without spending hours analyzing raw data.
Many organizations also use a Business Intelligence Dashboard to combine information from different departments, including finance, sales, customer support, marketing, and project management. This centralized approach improves collaboration, increases operational efficiency, and helps teams stay focused on business goalsWhether you manage a startup, a growing company, or a large enterprise, an Analytical Dashboard provides the visibility needed to monitor performance, track progress, and make informed decisions with confidence.
Why Industries Use an Analytical Dashboard
Every industry depends on accurate information to improve their performance and achieve business goals. Managing large amounts of data at a time and manually it can takes lot of time, also increase efforts, and slow down decision-making. An analytical dashboard solves this challenge by presenting important business information in a clear, organized and interactive format.
Companies use an Analytical Dashboard because it provides instant access to business performance from one centralized platform. Managers can review sales, customer engagement, financial updates, project progress, and operational activities without opening multiple systems. This saves valuable time while improving overall productivity.
A Business Intelligence Dashboard helps organizations connect data from different departments into one unified view. Instead of working with separate reports, decision-makers can compare performance across teams, identify growth opportunities, and recognize potential issues before they become major problems.
Another important reason why businesses use an Analytical dashboard is its ability to simplify the complex information. Interactive charts, graphs, progress bar , indicators, and visual reports make data easier to understand for executives, team leaders, and employees. This encourages faster discussions and supports more confident business decisions.
Advanced organisations also rely on real-time insights to respond quickly to changing market conditions. This dashboard monitoring daily revenue, tracking customer behavior, reviewing employee performance, or measuring project completion. It also allow businesses to take quickly action whenever required.
From healthcare and retail to finance, education, manufacturing, logistics, and technology, every industry benefits from better visibility into daily operations. An Analytical Dashboard supports smarter planning, improves collaboration, reduces manual reporting, and enables organizations to focus on continuous growth through reliable, data-driven decision-making.
How an Analytical Dashboard Works
An analytical dashboard works by collecting information from multiple business sources and displaying it in a structured,interactive interface. Instead of reviewing individually files or switching between different software, users can access important business metrics from a single dashboard. The process begins with data collection. Information is gathered from systems such as CRM systems, ERP platforms, accounting tools, marketing softwares, project management systems, and databases. Once the data is imported, the dashboard organizes it automatically into meaningful categories.
The next stage focuses on processing and analysis. The system filters, calculates, and arranges the information to generate useful business metrics. This helps users understand current performance without manually preparing reports or performing complex calculations.
A Data Visualization Dashboard then converts processed information into easy-to-read charts, graphs, tables, progress bars, and KPI cards. These visual elements allow users to compare results, monitor trends, and identify important patterns within seconds.
To support faster decision-making, the dashboard continuously updates connected information and delivers Real-Time Insights whenever new data becomes available. Business leaders can immediately view changing sales figures, customer activity, project updates, financial performance, or operational progress without waiting for scheduled reports.
A Business Intelligence Dashboard further enhances this process by combining information from different departments into one unified workspace. Executives, managers, and team members can apply filters, customize reports, compare historical performance, and explore detailed analytics based on their specific requirements.With secure user authentication, role-based access, automated reporting, and interactive visualizations, an Analytical Dashboard provides a reliable environment for monitoring business operations. This streamlined workflow enables organizations to analyze information more efficiently, improve planning, and make informed decisions using accurate and up-to-date business data.
Key Features of an Analytical Dashboard
An Analytical Dashboard combines powerful tools into one workspace, helping businesses monitor performance, organize information, and make faster decisions. Below are some of its essential features.
1. Analytics This Month
View the recent month’s business performance through an interactive charts and reports. This features helps monitor revenue, customer growth, and ongoing activities with up-to-date business metrics.
2. Analytics This Year
Get a complete yearly performance overview to evaluate long-term growth, buisness achievements, and strategic progress with clear visual reports .
3. Notifications
Receive instant alerts for important updates, pending tasks, system activities, and business events, ensuring that nothing important is missed.
4. Sales Volume
It track performance of sales using visual graphs that shows revenue trends, product demand and overall business growth in an easy-to -understand format.
5. Company Report
Access a complete summary of organizational performance, including financial data, operational updates, and key business statistics from one location.
6. Yearly Comparison
It compares performance of business across different years to identity growth trends, measure improvements, and support future planning.
7. Reviews
Analysis consumer feedback and satisfaction level through organized review data that helps improve products and services.
8. Activity
Stay informed about recent user actions, completed tasks, and business operations with a detailed activity timeline.
9. Rating
View performance ratings for products, services or teams to measure quality an identify areas that require improvement.
10. Calculator
Use the built-in calculator to perform quick calculations without leaving the dashboard, making everyday business analysis more convenient.
11. New Users
Track newly registered users and monitor audience growth through simple visual statistics and performance indicators.
12. Browsers Used by Users
Understand which browsers your visitors use most, allowing you to improve compatibility and deliver a better user experience.
13. Project Management
Manage project budgets, workloads, project lists, and project status from a centralized section that helps teams stay organized, monitor progress, and complete tasks on schedule.
14. Mailbox
Access business messages, internal communication, and important conversations directly within the dashboard for improved collaboration.
15. Contact
It stores and organises customer , employee, and business contact details in one secure location for quick access whenever required.
16. Components
Use ready-made UI components such as tables, charts, forms, buttons, and widgets to build or customize the dashboard more efficiently.
17.Map
Display business locations, regional performance, customer distribution, or operational coverage through interactive maps for better geographical analysis.
18.Authentication
It protects sensitive information with secure login & password, user roles and permission-based access, ensuring only authorized users can access specific dashboard features.
VIEW DEMO BUY NOW
Benefits of an Analytical Dashboard
An Analytical Dashboard offers several advantages that help businesses improve productivity, simplify data analysis, and make informed decisions. Here are some of the key benefits:
1. Faster Decision-Making
Access Real-Time Insights that help managers and teams make quick, data-driven decisions without waiting for manual reports.
2. Centralized Data Management
View sales, projects, customers, finances, and business activities from one dashboard instead of using multiple platforms.
3. Better Data Visualization
A Data Visualization Dashboard converts complex business information into interactive charts, graphs, and reports that are easy to understand.
4. Improved Business Performance
Monitor KPIs, identify trends, and measure progress regularly to improve overall business efficiency.
5. Enhanced Team Collaboration
Provide every department with access to the same information, improving communication and reducing reporting inconsistencies.
6. Time-Saving Automation
Reduce manual reporting by automatically updating business metrics and generating visual reports in real time.
7. Accurate Business Monitoring
Track important activities, sales performance, customer growth, and operational updates with reliable business data.
8. Smart Project Management
Manage project budgets, workloads, task progress, and project status from one organized workspace.
9. Secure Information Access
Role-based authentication helps protect sensitive business data by allowing access only to authorized users.
10. Supports Business Growth
A Business Intelligence Dashboard provides valuable insights that help organizations identify opportunities, improve planning, and achieve long-term business goals.
Conclusion
An analytical dashboard is more than just a reporting tool– it is a complete solution for monitoring, analyzing and managing business data from one centralized platform. By combining powerful analytics with an interface. It also helps organizations to simplify complex information and make smarter decisions with confidence. With features like interactive reports, project management, sales tracking, notifications, secure authentication, and real-time analytics, businesses can improve productivity while staying focused on their goals.
A Data Visualization Dashboard makes business metrics easier to understand, while a Business Intelligence Dashboard brings valuable information from different departments into one place for better collaboration and planning.Whether you run a startup, a growing business, or a large enterprise, an Analytical Dashboard provides the visibility, flexibility, and control needed to manage operations efficiently and support long-term success.
Frequently Asked Questions (FAQs)
1. What is an Analytical Dashboard?
An Analytical Dashboard is a digital platform that displays business data through charts, graphs, reports, and key performance indicators (KPIs). It helps users monitor performance, analyze trends, and make informed decisions from one centralized location.
2. What is the main purpose of an Analytical Dashboard?
The main purpose of MultiPurpose Themes dashboard is to collect, organize, and present business data in an easy-to-understand format. It enables organizations to track important metrics, evaluate performance, and improve decision-making using accurate information.
3. Why is an Analytical Dashboard necessary?
Businesses generate large amounts of data every day. An Analytical Dashboard simplifies this information, provides Real-Time Insights, reduces manual reporting, and helps teams respond quickly to changing business conditions.
4. Is this Analytical Dashboard fully customizable?
Yes. MultiPurpose Themes dashboard is designed to be highly customizable. Users can personalize layouts, widgets, reports, charts, themes, and other settings to match their specific business requirements.
5. What are the main features of this dashboard?
Key features include monthly and yearly analytics, notifications, sales volume tracking, company reports, yearly comparisons, reviews, activity logs, ratings, calculator, new user analytics, browser statistics, project management, mailbox, contact management, reusable components, interactive maps, and secure authentication.
6. Can this dashboard manage everything in one place without performance issues?
Yes. MultiPurpose Themes dashboard centralizes business information into a single interface, making it easier to manage operations, monitor performance, and access important data efficiently. When properly configured with reliable infrastructure, it delivers a smooth and stable user experience, even while handling multiple business functions.

Related Posts

This Post Has 0 Comments