

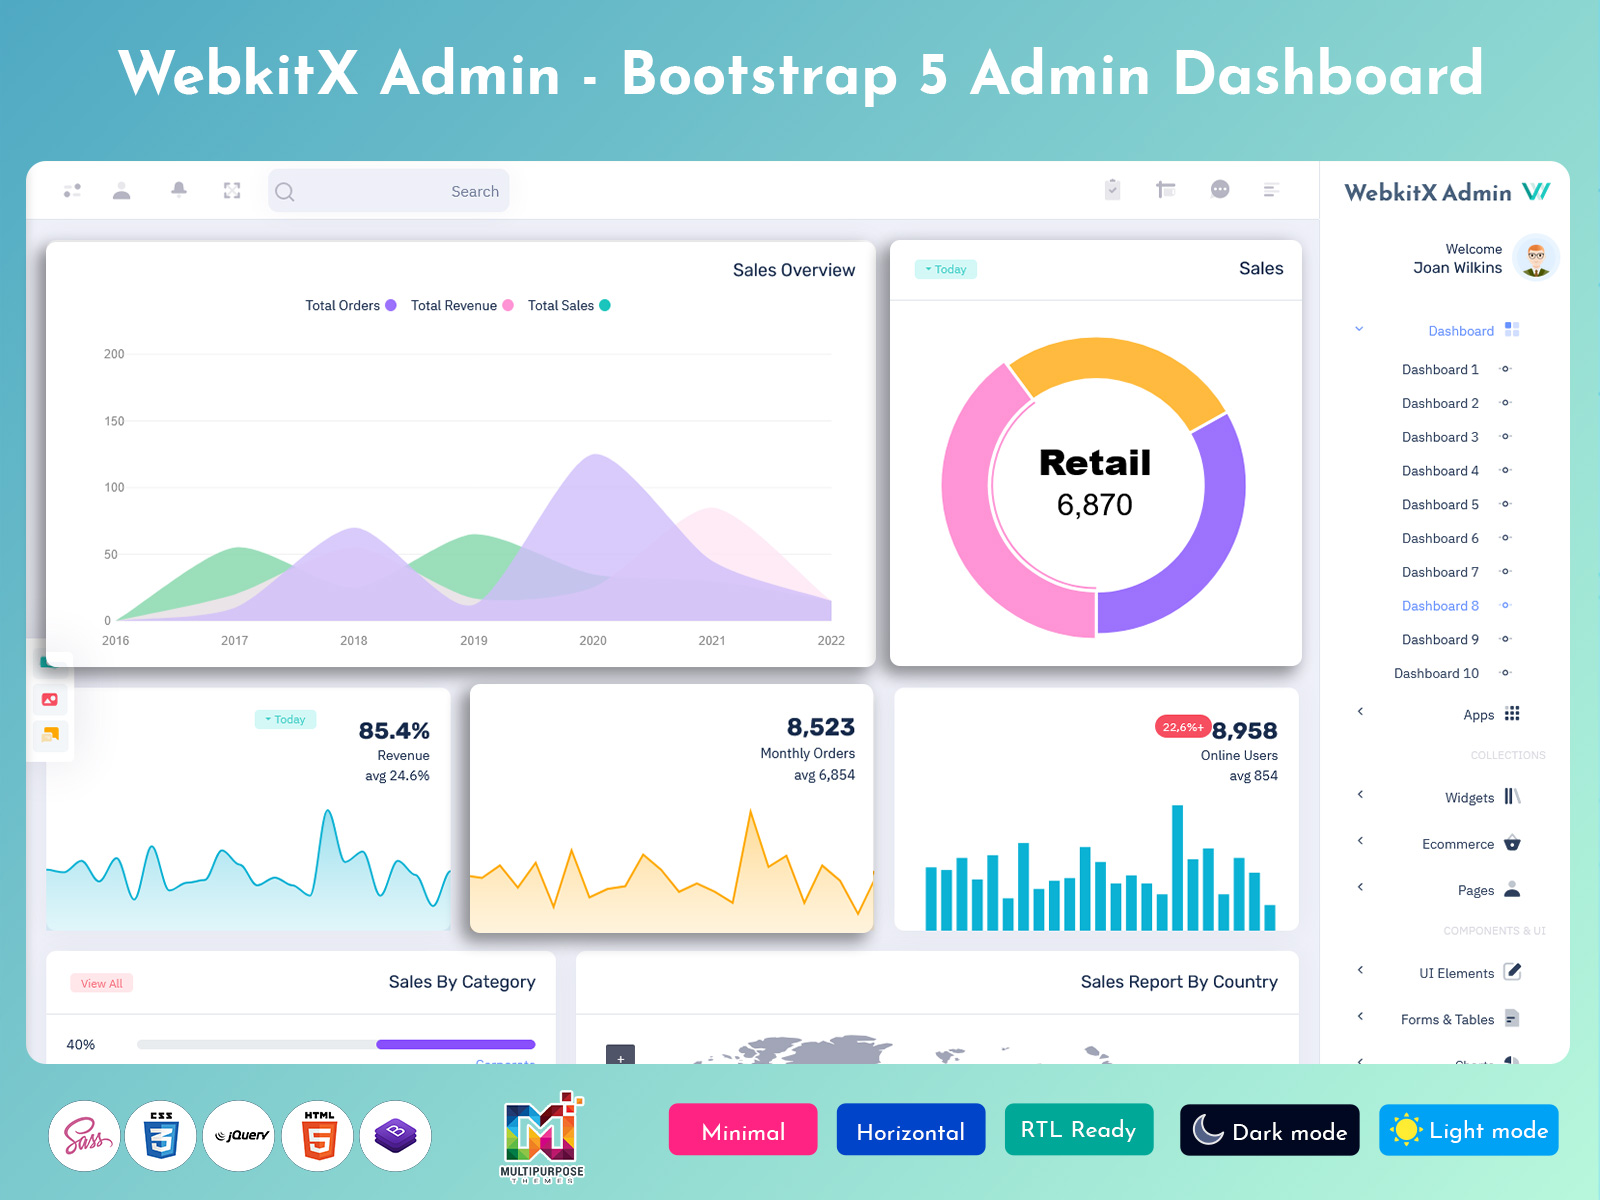
A Sales Admin Dashboard is a modern digital solution designed to manage sales activities, revenue…

Sales Dashboard: A Practical Guide to Sales Performance Analytics
Reading Time: 8 minutes
A Sales Dashboard provides a centralized digital workspace for organizing sales-related information. Instead of asking team members to manually combine information from different sources, a dashboard can present selected data in a structured and easy-to-review format.
Watch Full Video
However, an effective sales dashboard should do more than display attractive charts. Sales managers need to understand changes, compare periods, recognize unusual movements, and decide where their teams should focus. The dashboard should support those activities without replacing the experience and judgment of the sales team.
What is a Sales Dashboard?
A Sales Dashboard is a digital interface that brings selected sales information into one organized workspace. It can be used by sales representatives, team leaders, managers, business owners, and executives to understand sales activity according to their responsibilities.
A sales department can generate a significant amount of information every day. Some opportunities progress quickly, while others remain inactive. Customers may purchase repeatedly, new prospects may enter the pipeline, and sales results can change because of seasonal or market conditions.
Trying to understand all of this through separate reports can make the process unnecessarily difficult.
A Sales Dashboard provides a clearer starting point. It can bring together information that helps users understand current sales activity and then allow them to investigate specific areas in greater detail.
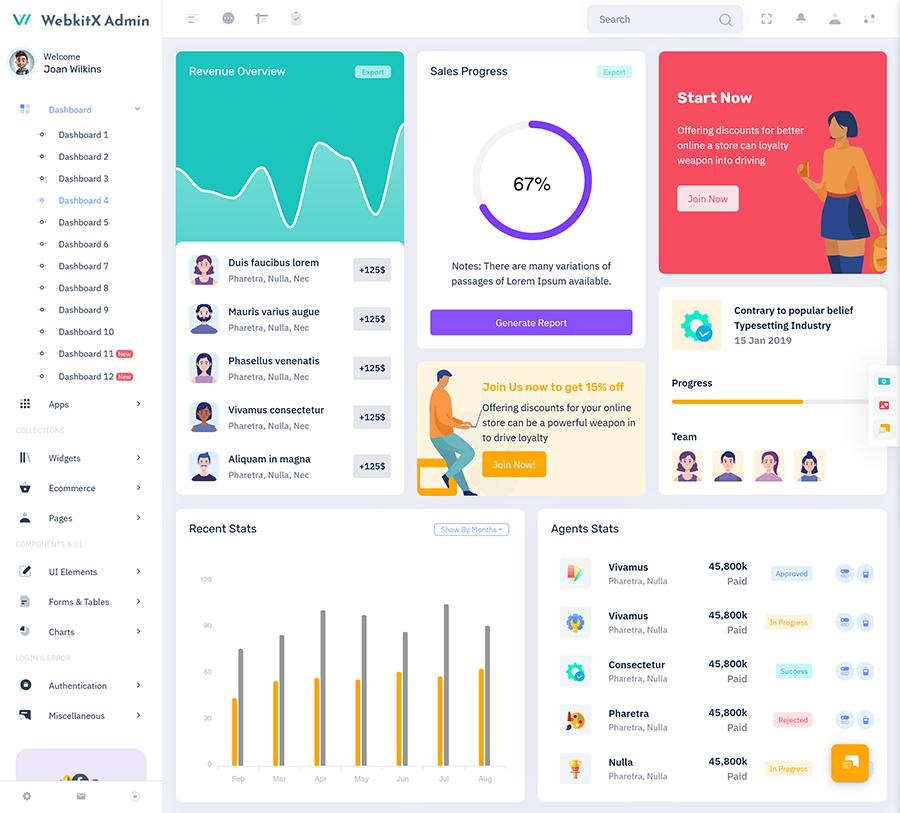
A Sales Statistics Dashboard can help teams review selected sales information in a structured way. Rather than looking at individual figures separately, users can compare information and recognize changes that may deserve further attention.
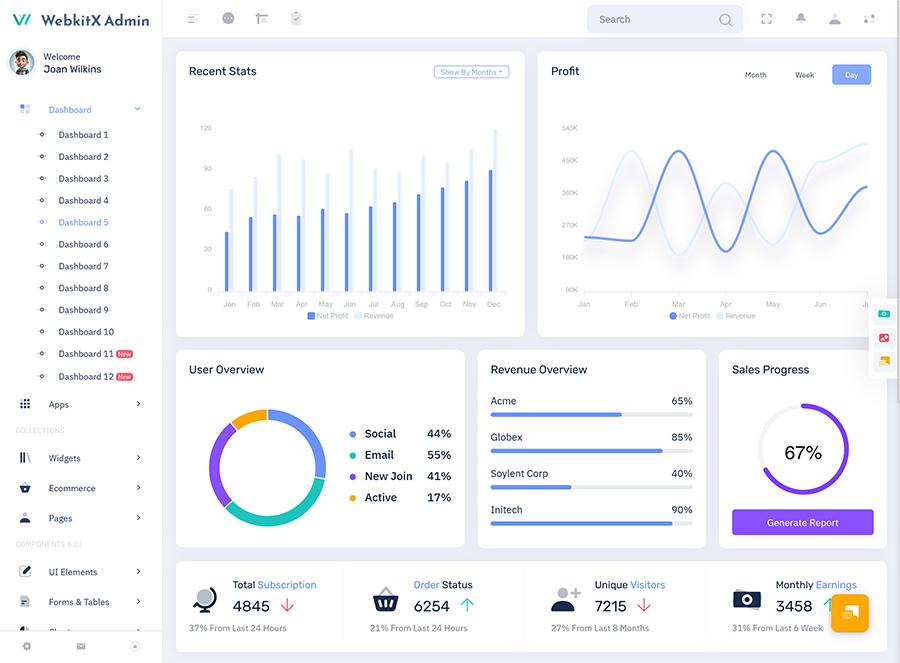
A Sales Performance Analytics interface can provide a deeper perspective by helping managers examine sales activity over different periods or across different teams.
A Monthly Sales Dashboard can focus specifically on month-to-month business activity. This can be useful for sales meetings, monthly reviews, and planning discussions.
Meanwhile, a Sales Overview Dashboard can provide a broader starting point for managers who want to understand the current position of the sales operation before moving into detailed information.
The purpose of all these views is not to create more reporting. It is to make useful sales information easier to understand.
VIEW DEMO BUY NOW
How Sales Dashboards Turn Data Into Actionable Insights
A Sales Dashboard becomes more useful when it helps users ask better questions.
A number can tell a sales manager that performance changed, but it does not automatically explain why. If sales decline during one period, several factors could be responsible. Customer demand may have changed, a sales campaign may have ended, a particular product may have become less attractive, or the sales team may simply have had fewer opportunities.
The dashboard should therefore act as a starting point for investigation.
For example, a Sales Statistics Dashboard might show that one sales period performed differently from another. The manager can then explore the information further and discuss possible reasons with the team.
Similarly, Sales Performance Analytics can help managers compare different periods or groups. The goal is not to make an automatic judgment about individual employees but to provide context for meaningful conversations.
A Monthly Sales Dashboard can also become useful during regular team meetings. Instead of preparing information manually every month, managers can use a consistent dashboard structure to review what happened and discuss what should happen next.
The same principle applies to a Sales Overview Dashboard. It should provide enough information to understand the broader situation without forcing the user to process every available metric at once.
This creates a simple workflow:
See the situation → understand the context → investigate the reason → decide what to do.
That is more valuable than simply putting every available sales number on one screen.
Features of Sales Dashboard
1. Sales Statistics Dashboard
A Sales Statistics Dashboard can organize important sales figures into a structured view for managers and sales teams. It can make comparisons easier and help users recognize changes in sales activity without requiring them to manually collect information from multiple reports.
2. Sales Performance Analytics
Sales Performance Analytics can provide a deeper way to examine sales activity over selected periods. It can help managers compare results, identify noticeable changes, and create a stronger basis for sales discussions while leaving the interpretation of those changes to experienced team members.
3. Monthly Sales Dashboard
A Monthly Sales Dashboard can provide a consistent workspace for reviewing sales activity during a particular month. It can support regular business reviews by giving teams a familiar structure for understanding progress, discussing changes, and considering priorities for the next reporting period.
4. Sales Overview Dashboard
A Sales Overview Dashboard can provide a broader perspective before users move into detailed sales information. It can help managers quickly understand the general direction of business activity and decide which areas deserve a closer review.
5. Period Comparison
A Sales Dashboard can make it easier to compare information across different sales periods. These comparisons can help teams recognize changes that may not be obvious when each reporting period is viewed independently, creating useful context for sales planning and internal discussions.
6. Role-Based Views
Sales representatives, managers, and executives do not necessarily need the same information. A dashboard can provide role-specific views so each user receives a relevant perspective. This can reduce unnecessary information and create a more focused working environment for different members of the sales organization.
7. Flexible Reporting Structure
A sales dashboard can be adapted according to the reporting needs of a business. Different organizations may measure sales in different ways, so a flexible interface can accommodate their preferred information structure while allowing the dashboard to evolve as business requirements change.
How Sales Dashboards Improve Sales Meetings and Discussions
One of the strongest uses of a Sales Dashboard is its ability to improve the quality of sales discussions.
Sales meetings can sometimes become focused on isolated numbers. A manager may ask whether the team reached a particular result, but without additional context, the conversation may stop there.
A dashboard can provide a broader starting point.
Suppose a Sales Dashboard shows that sales changed considerably compared with the previous month. Instead of simply recording the difference, the team can investigate what happened during that period.
Perhaps a particular product performed differently. Maybe the team received more inquiries but fewer customers completed purchases. Another possibility is that the change was caused by a temporary business condition.
The dashboard cannot answer every question automatically, but it can make the important questions easier to identify.
This can lead to better sales meetings because the team is discussing actual observations rather than relying entirely on memory.
A Sales Overview Dashboard can be useful at the beginning of the meeting, providing a broad picture before managers move into specific areas.
After that, Sales Performance Analytics can help the team explore selected changes in greater detail.
This turns the dashboard into a conversation tool rather than just a reporting tool.
VIEW DEMO BUY NOW
Benefits of Sales Dashboard
1. Creates Better Sales Visibility
A Sales Dashboard gives teams a central environment for understanding sales activity. Instead of relying on separate reports, users can begin with an organized view and determine which areas deserve further investigation based on current business conditions.
2. Supports Monthly Reviews
A Monthly Sales Dashboard can make regular sales reviews more consistent. Teams can use a familiar structure to compare recent activity, discuss noticeable changes, and prepare priorities for the next period without repeatedly creating reports from scratch.
3. Helps Identify Meaningful Changes
A Sales Statistics Dashboard can make changes in sales activity easier to recognize. When information is organized clearly, managers can notice differences between periods or groups and decide whether those changes require deeper investigation or discussion.
4. Encourages Better Performance Discussions
Sales Performance Analytics can give managers useful context for sales conversations. Rather than relying only on assumptions, teams can review organized information and discuss possible reasons behind changes before deciding what actions may be appropriate.
5. Gives Management a Clear Overview
A Sales Overview Dashboard can provide managers and business owners with a broader perspective of sales activity. It can help them understand the general direction of the business before they move into more detailed operational information.
6. Reduces Manual Reporting Effort
A structured sales dashboard can reduce the need to repeatedly combine information from separate sources for routine reviews. This can save time for sales teams and allow managers to spend more attention on interpretation, planning, and communication.
7. Supports Business Growth
As sales operations become larger, information can become more difficult to manage. A flexible dashboard can adapt to additional teams, products, reporting requirements, and business processes, helping the sales organization maintain a consistent way of reviewing information.
Conclusion
A Sales Dashboard can become an important part of modern sales management when it is designed around real business questions rather than simply filled with charts and statistics.
A Sales Statistics Dashboard can help teams understand selected sales information, while Sales Performance Analytics can provide deeper context for comparisons. A Monthly Sales Dashboard can support regular business reviews, and a Sales Overview Dashboard can give managers a broader view of current sales activity.
The most useful dashboard does not attempt to make every sales decision automatically. Instead, it provides organized information that helps experienced sales professionals ask better questions, investigate changes, and plan their next steps.
When dashboard design is focused on clarity, role-based access, meaningful comparisons, and practical workflows, sales data becomes easier to use.
Ultimately, the purpose of a Sales Dashboard is not simply to show what happened. It is to help teams understand what changed, why it may matter, and what deserves attention next.
VIEW DEMO BUY NOW
Frequently Asked Questions
1. What is a Sales Dashboard?
A Multi Purpose Themes Sales Dashboard is a digital interface that organizes sales-related information in one place. It can help representatives, managers, and business owners understand sales activity, compare periods, and identify areas that may need further attention. The dashboard can be customized according to the company’s sales process and reporting requirements.
2. What is a Sales Statistics Dashboard?
A Multi Purpose Themes Sales Statistics Dashboard presents selected sales information in an organized format. It can help users compare figures and recognize changes without manually combining information from different reports. Its purpose is to make sales information easier to understand and provide a useful starting point for further investigation.
3. How does a Monthly Sales Dashboard help businesses?
A Multi Purpose Themes Monthly Sales Dashboard provides a consistent way to review sales activity for a particular month. It can make monthly meetings easier to prepare and help teams compare recent results with previous periods. This creates a structured process for reviewing what changed and discussing future priorities.
4. What is Sales Performance Analytics?
Sales Performance Analytics involves examining sales information to understand changes, comparisons, and patterns across different periods or groups. It can provide useful context for managers, but analytics should not be treated as an automatic explanation of sales performance because business results can be influenced by many factors.
5. Why do businesses need a Sales Overview Dashboard?
A Multi Purpose Themes Sales Overview Dashboard provides a broader view of sales activity. It can help managers and business owners understand the general direction of the sales operation before moving into detailed reports. This makes it useful as a starting point for meetings, reviews, and business discussions.
6. Can a Sales Dashboard be customized for different sales teams?
Yes. Sales teams often have different responsibilities and reporting needs. A dashboard can provide role-based views for representatives, team leaders, managers, and executives. The interface can also be customized according to products, territories, sales processes, reporting periods, and the specific information the organization needs.
7. What should I check before choosing a Sales Dashboard template?
Before choosing a dashboard template, review its responsive design, customization options, framework compatibility, browser support, code structure, and integration possibilities. You should also check whether the layout fits your actual sales workflow. A good template should provide a useful foundation without limiting future customization or business growth.

Related Posts

This Post Has 0 Comments