Businesses create information throughout their activities. Customer interactions orders, website visits, marketing campaigns, financial transactions,…
Future Ready Business Intelligence with Analytics Dashboard Design 2026
Reading Time: 8 minutes
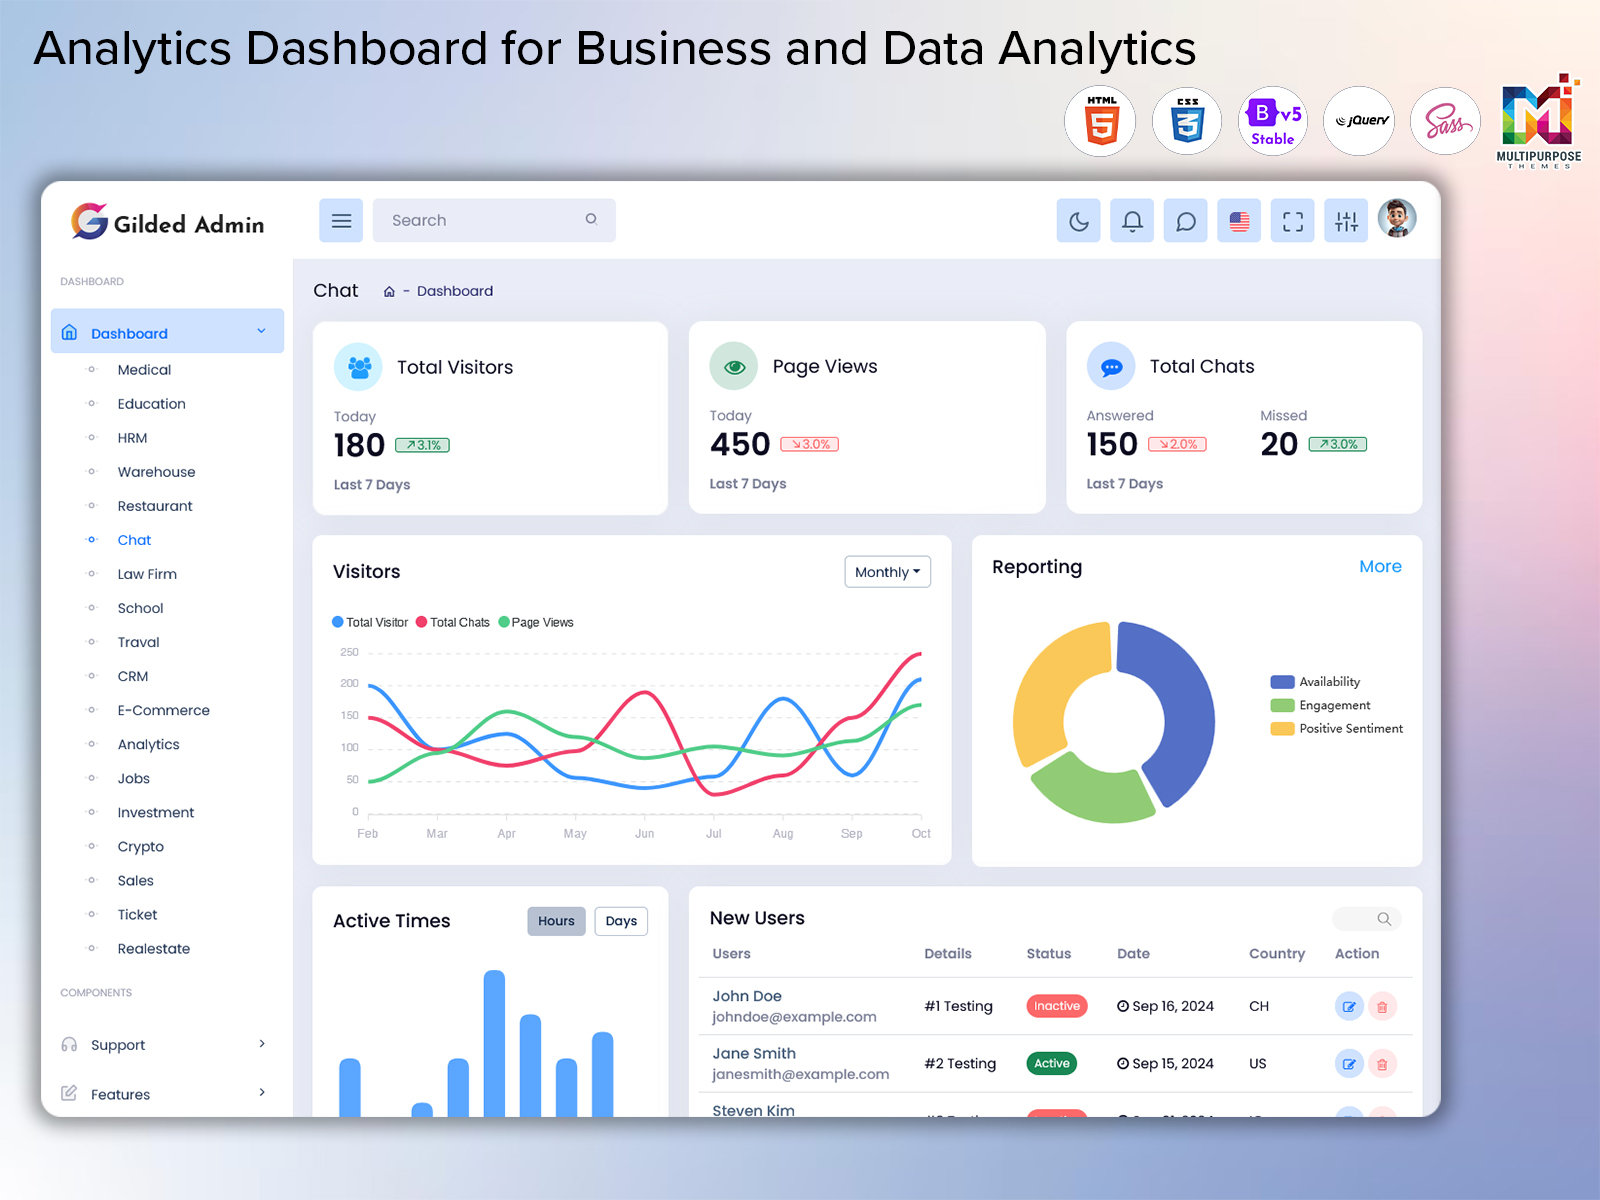
Modern organizations depend on fast data processing, accurate reporting, and visual insights to stay competitive in today’s digital environment. A powerful Analytics Dashboard Design helps businesses collect structured information from multiple sources and convert it into meaningful business intelligence. It allows teams to monitor performance, track operations, and understand customer behavior through a single unified system that improves decision-making speed and accuracy.
Watch Full Video
Today, companies widely use Analytics Software Dashboard and Analytics WebApp platforms to manage revenue tracking, sales performance, and user engagement data. These systems are built with advanced Analytics UI components and responsive layouts that present complex information in a simple visual format. Businesses can easily explore trends, patterns, and performance metrics using structured Analytics Data Charts and reporting modules.
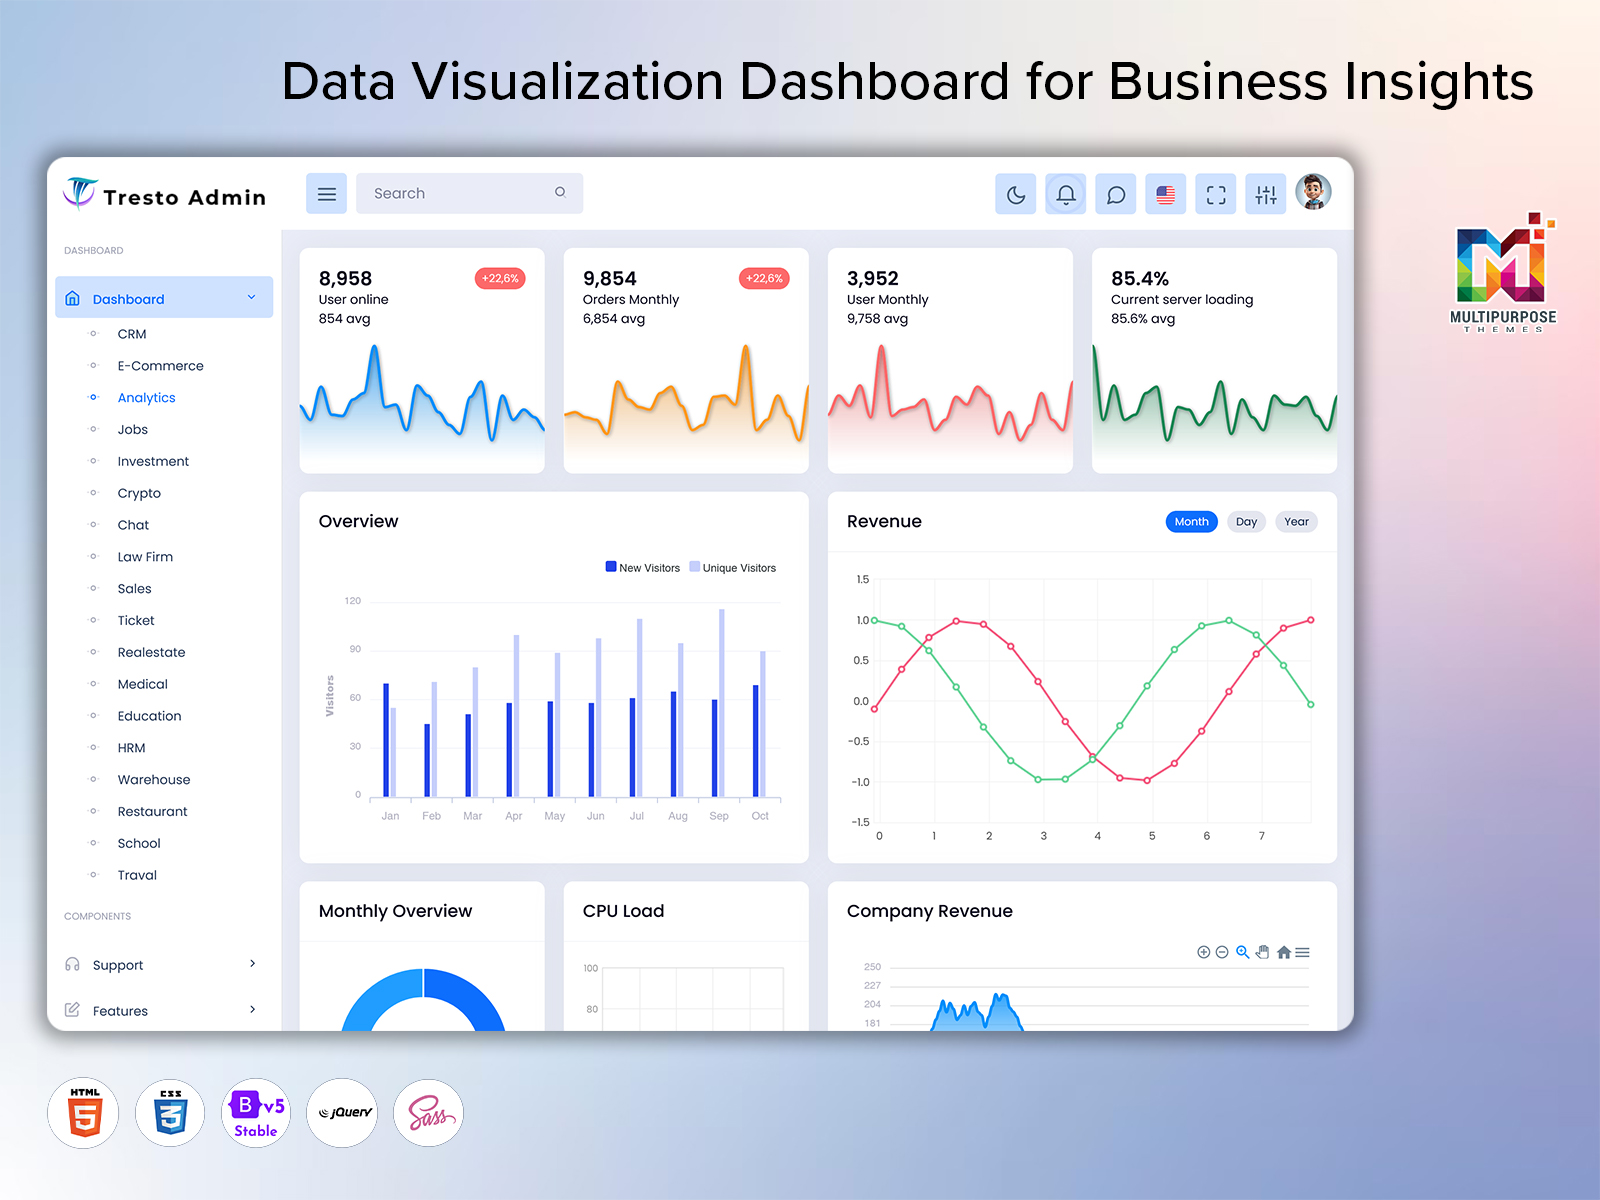
Modern Analytics Dashboard design approaches focus on clarity, usability, and real-time insights. Tools like Analytics Admin Ui Kit and Analytics Web Application Kit enhance interface experience while improving data accessibility across devices. These solutions help businesses transform raw data into actionable insights for smarter growth in 2026.
Understanding Analytics Dashboard Design and UI Structure
Analytics Dashboard design focuses on creating a clean and structured interface where businesses can easily understand complex data. A well-planned Analytics Dashboard helps users interact with reports, charts, and metrics without confusion. It organizes Analytics Data into visual blocks, making performance tracking and decision-making faster and more efficient for teams across different departments.
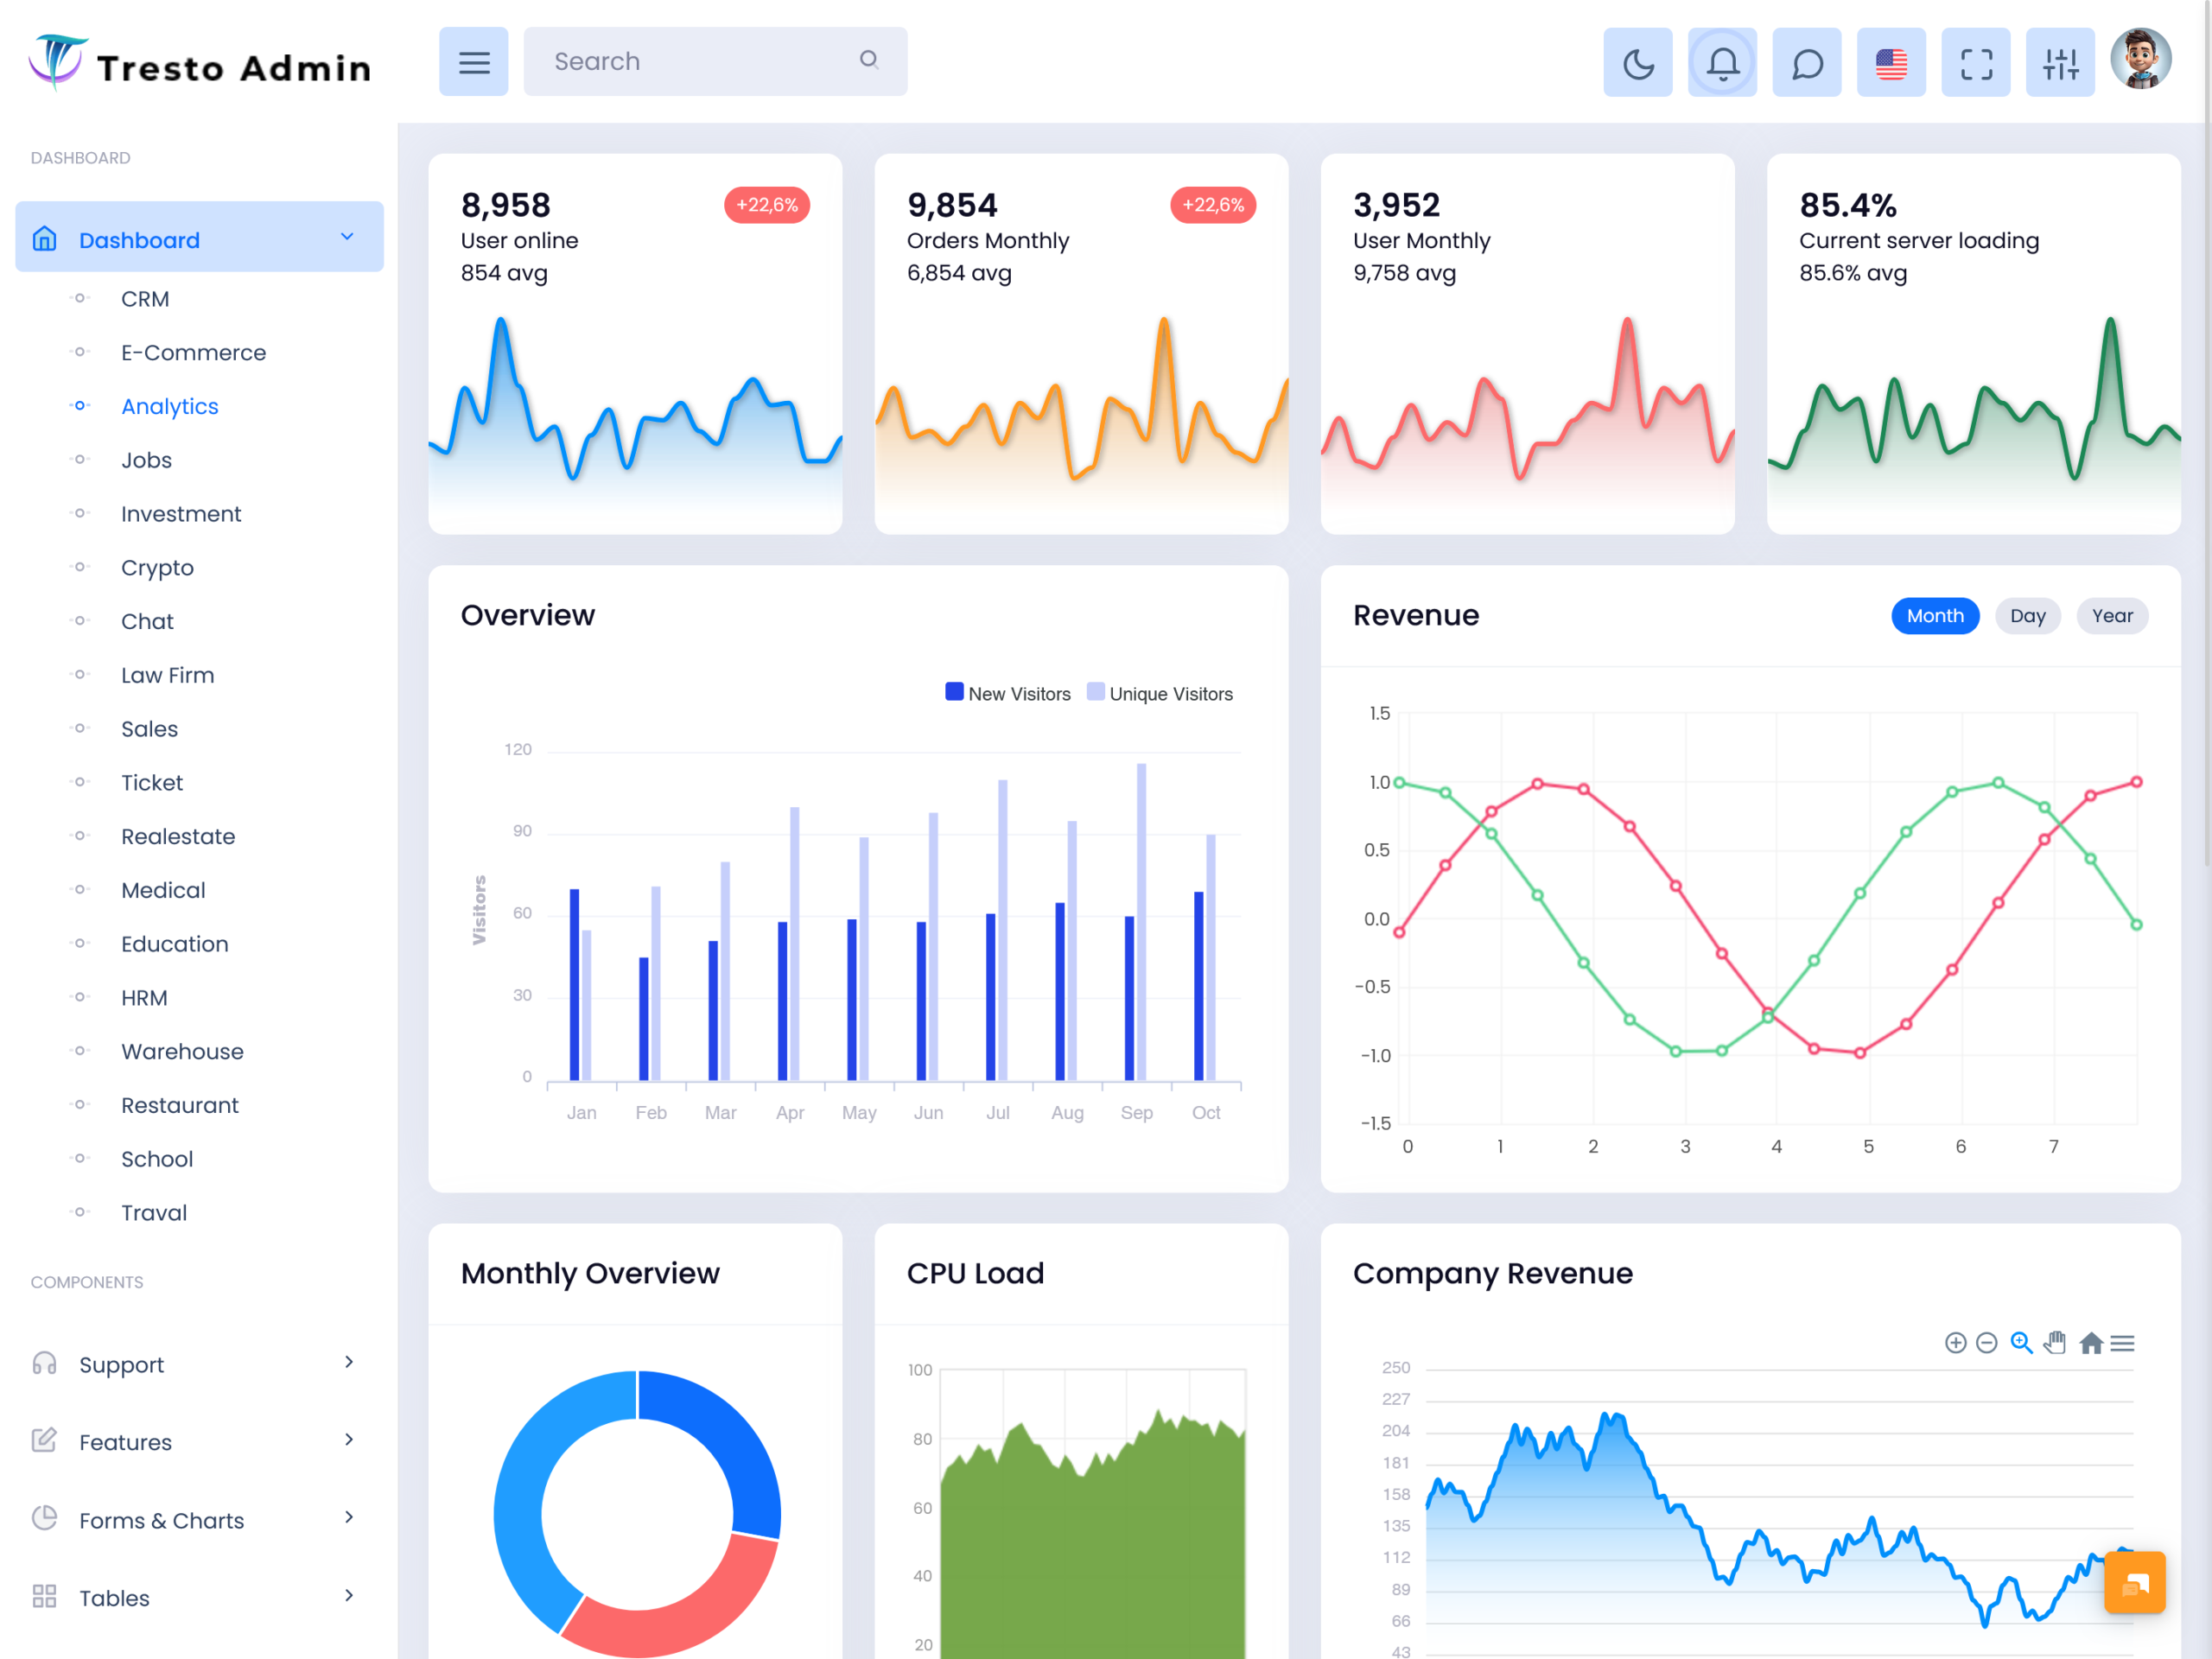
Modern Analytics Software and Analytics WebApp platforms rely on flexible layouts built using Analytics UI components and Analytics Ui Framework systems. These structures support responsive grids, interactive panels, and dynamic visualization areas that improve user experience. Businesses can explore key metrics through Analytics Data Page layouts that simplify navigation and enhance readability of important insights.
Revenue Tracking and Performance Insights in Analytics Software Dashboard
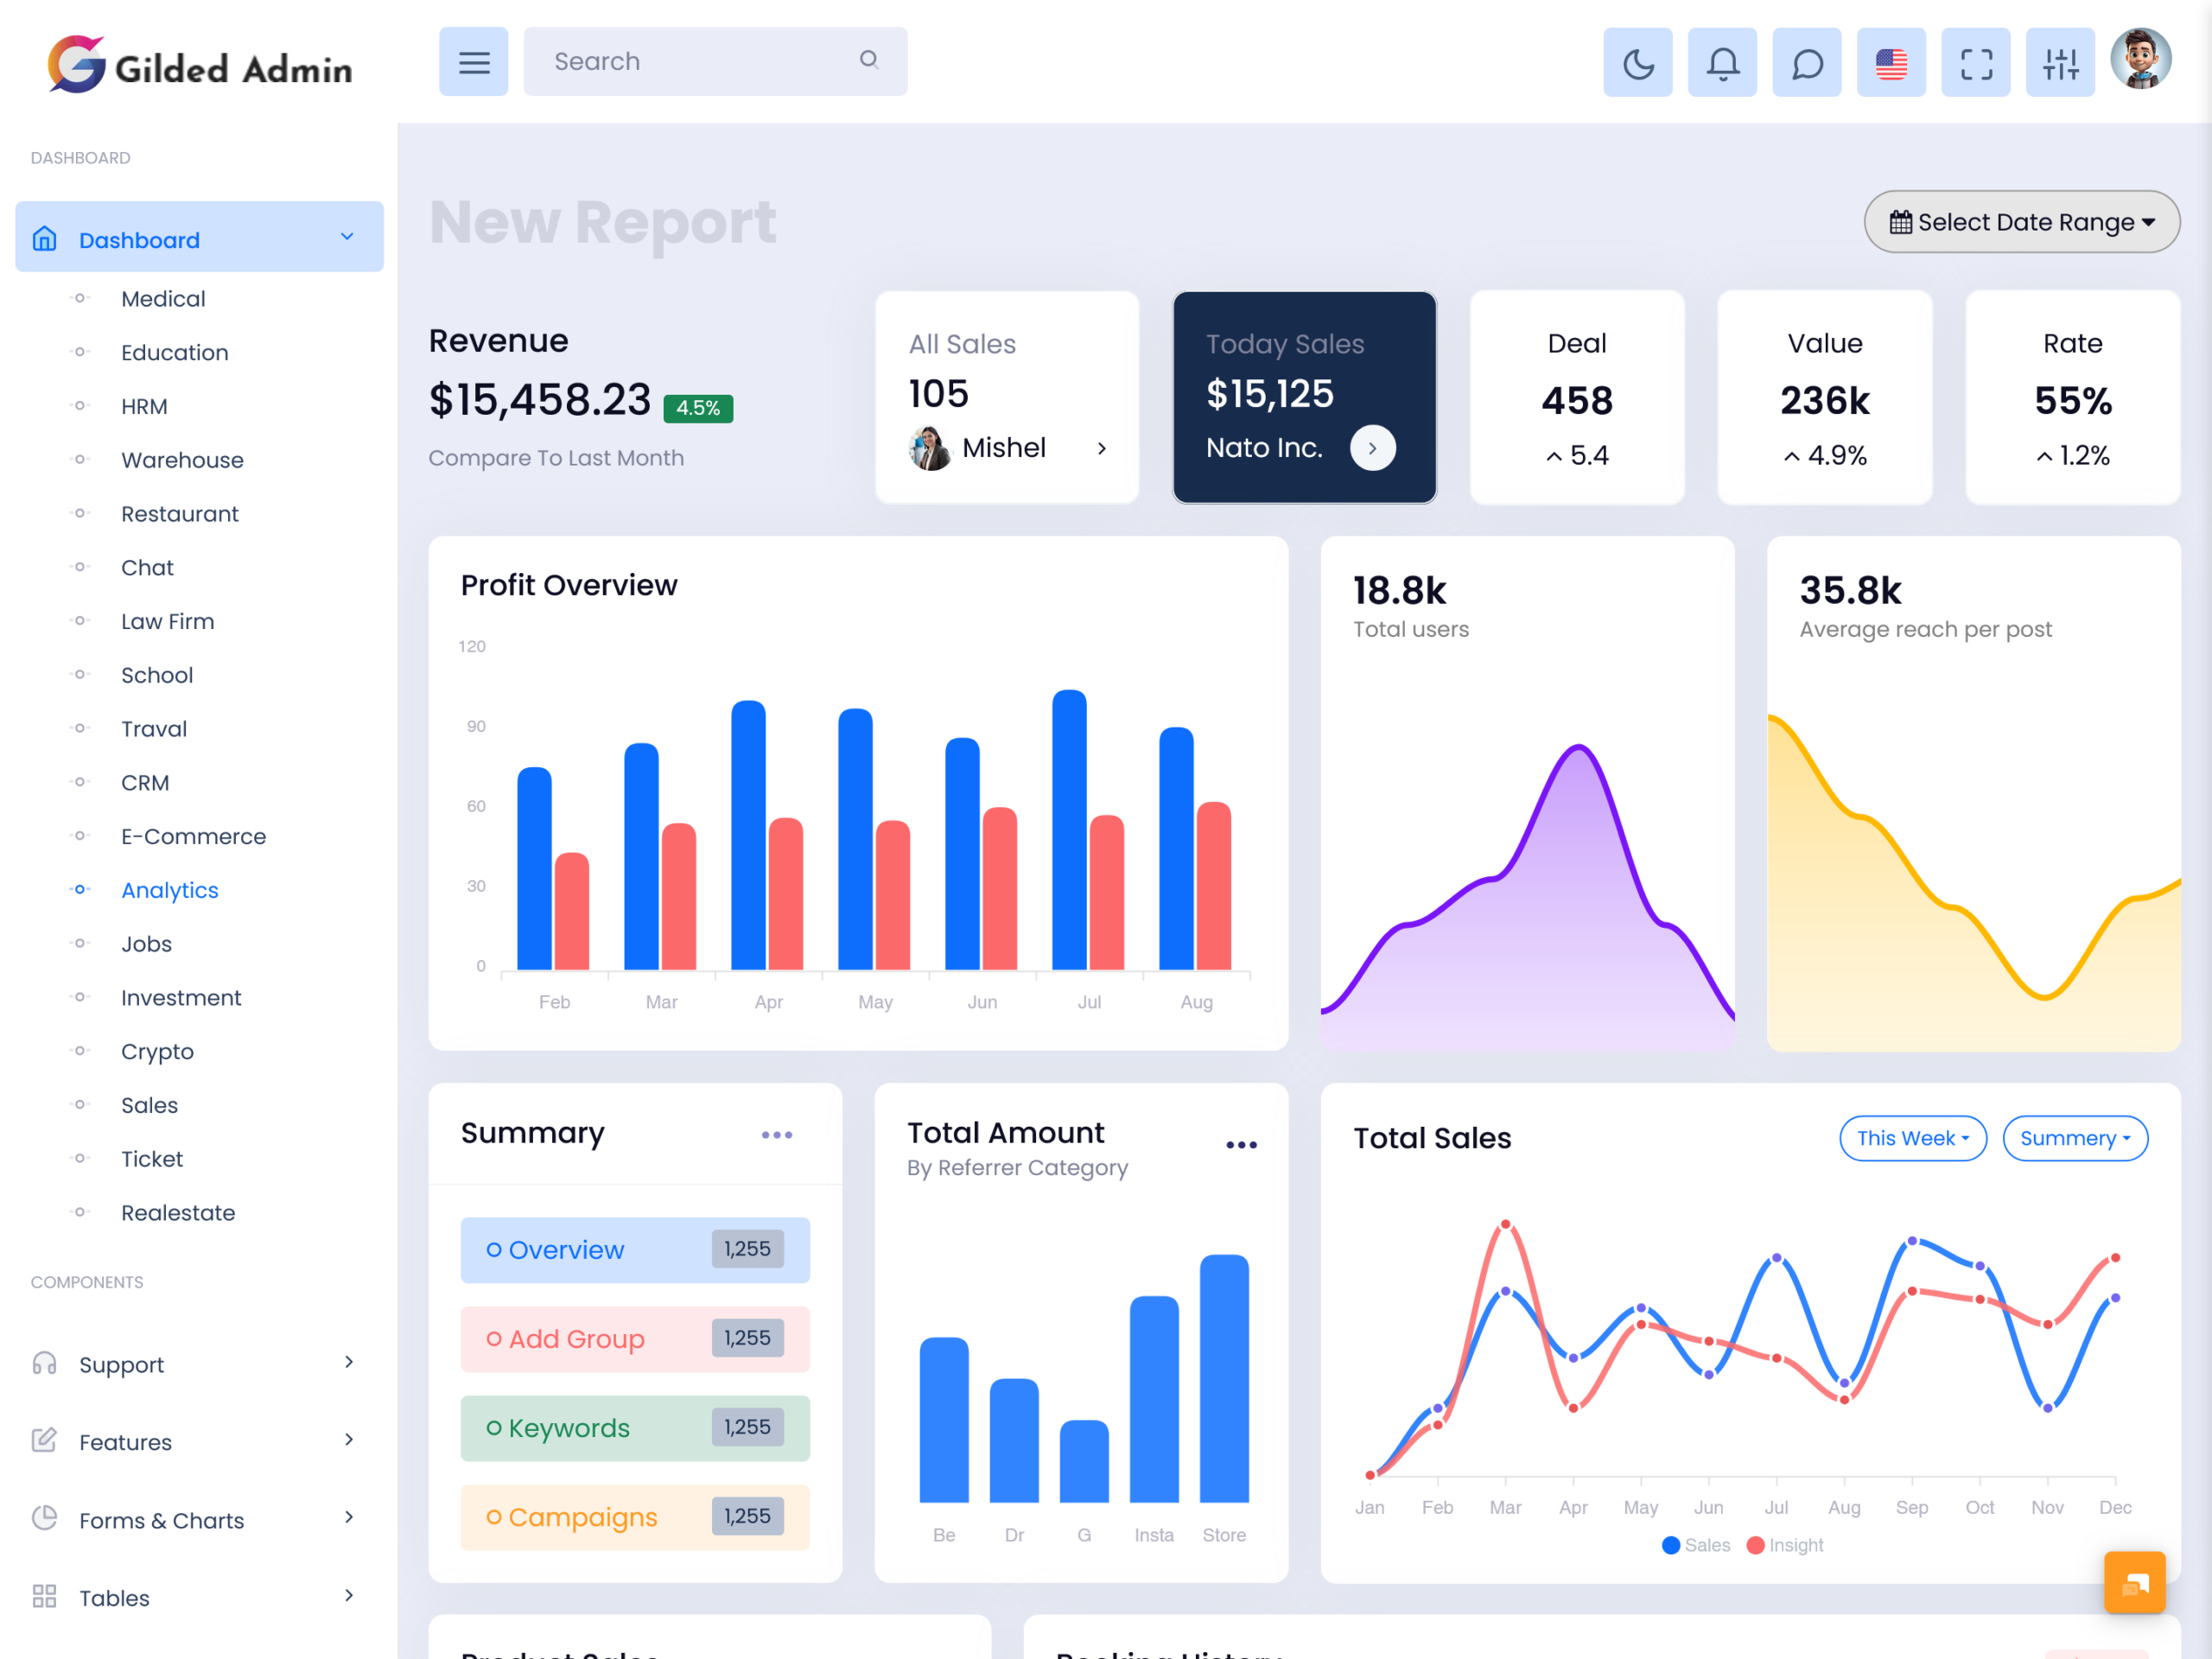
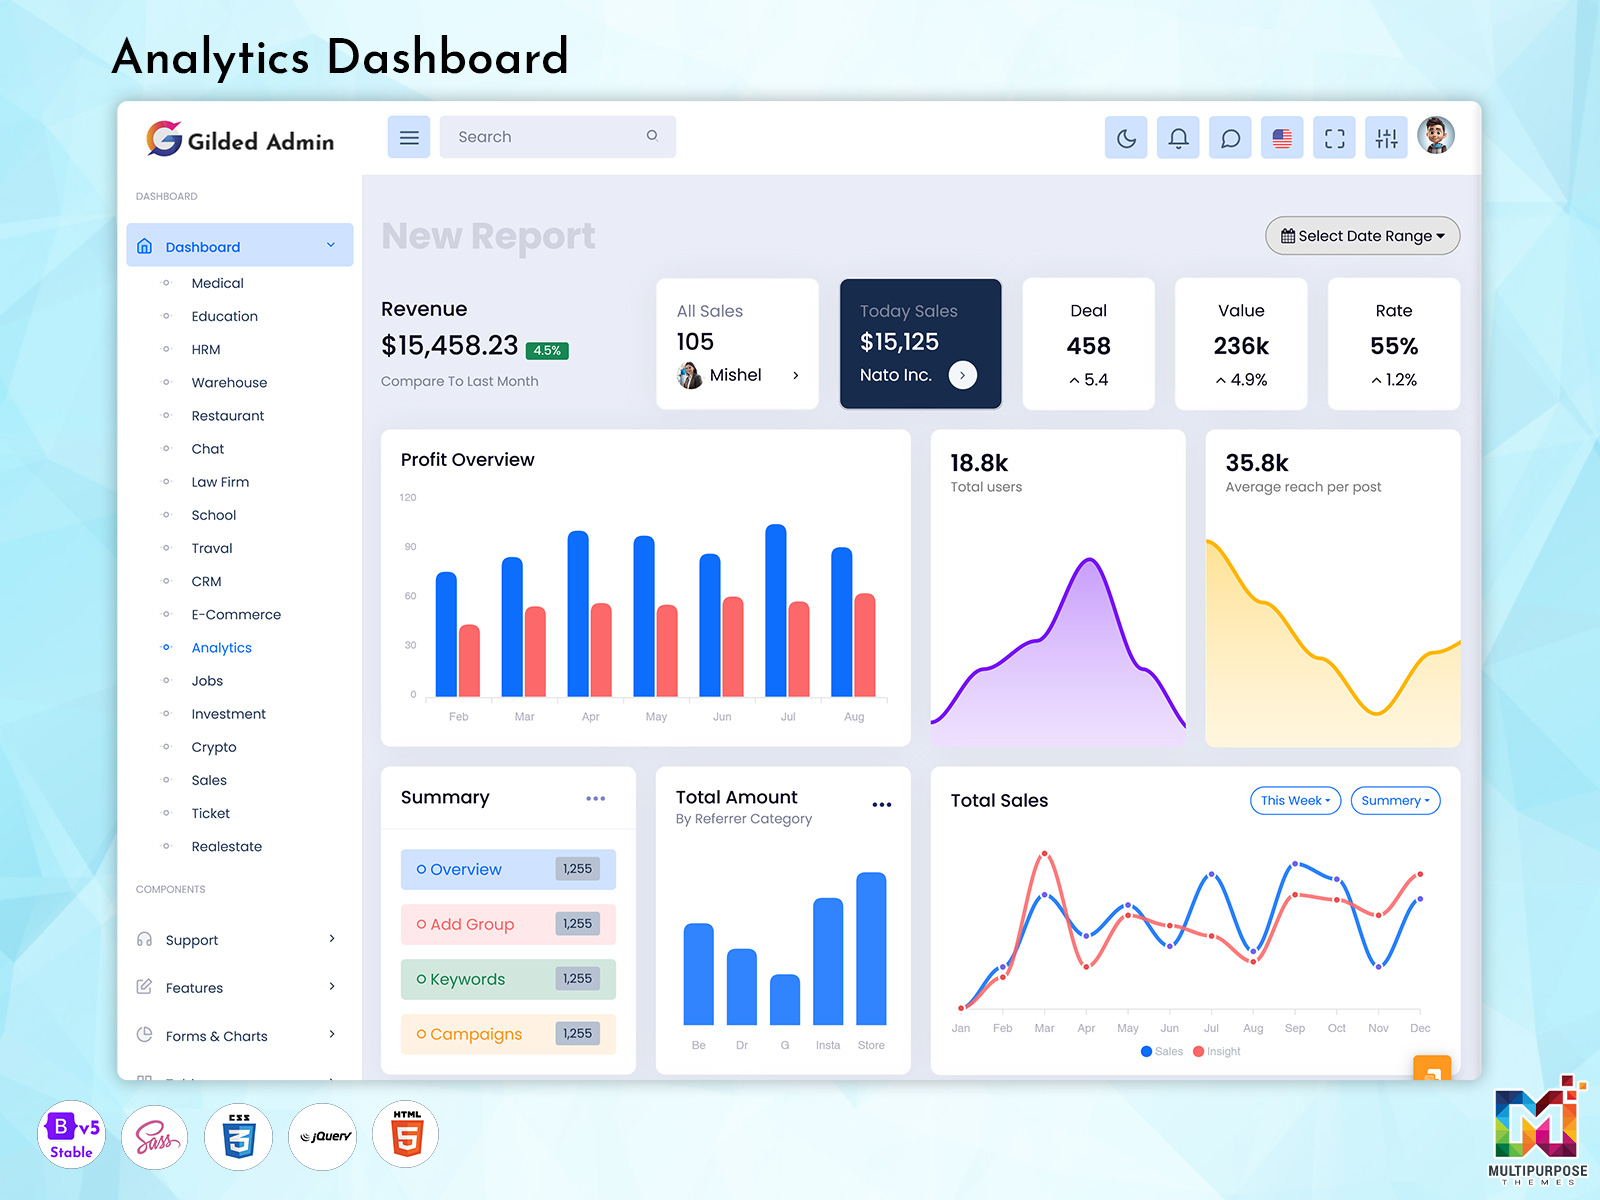
Modern businesses rely on structured data systems to monitor income, growth patterns, and overall financial performance. An Analytics Software Dashboard helps organizations track revenue streams from multiple channels in a single unified view. It organizes Analytics Data into meaningful insights that support better planning, forecasting, and decision-making. With real-time updates, teams can quickly understand revenue changes and identify key performance drivers across departments.
Advanced Analytics Software WebApp platforms and Analytics WebApp systems improve revenue visibility through interactive reports and visual summaries. These tools use Analytics Charts and Analytics Data Charts to present financial trends in a simple format. Businesses can analyze performance using Analytics Dashboard Ui Kit components and Analytics Admin Ui Kit layouts, ensuring better clarity and faster insights for strategic business growth.
VIEW DEMO BUY NOW
Sales Overview with Today Sales Performance Analysis
Sales performance tracking is a key part of modern business intelligence systems, helping organizations understand daily performance and customer activity. An Analytics Dashboard provides a structured view of sales data, allowing teams to monitor today’s sales performance in real time. It organizes Analytics Data into clear summaries that support faster decision-making and improve overall sales planning. Businesses can quickly identify performance gaps and growth opportunities through centralized reporting.
Advanced Sales Analytics Dashboard and Analytics Software WebApp platforms present daily sales insights using interactive visuals and structured layouts. These systems rely on Analytics Charts and Analytics Data Charts to display transaction trends, order flow, and customer behavior. With Analytics UI components and Analytics Dashboard design principles, companies can build clear and responsive reporting systems that improve visibility and enhance sales performance tracking across all business levels.
Deal Value, Conversion Rate, and Business Rate Monitoring
Tracking deal value, conversion rate, and overall business performance is essential for understanding how effectively a company is growing. An Analytics Dashboard helps organizations evaluate each deal from initial lead stage to final conversion, giving a clear picture of revenue potential. It organizes Analytics Data into structured insights that help teams identify high-performing channels and improve decision-making for future strategies.
Modern Business Analytics Dashboard and Data Analytics Dashboard platforms use Analytics Charts and Analytics Data Charts to display conversion trends and deal performance in a simplified way. With Analytics Software WebApp systems, businesses can monitor business rate metrics, track customer actions, and analyze sales funnel efficiency. Using Analytics Dashboard Ui Kit and Analytics UI components, companies can build intuitive dashboards that improve visibility, optimize performance tracking, and support smarter business growth decisions.
VIEW DEMO BUY NOW
Key Advantages of Analytics Dashboard Platforms
1. Faster Business Decision Making
Analytics Dashboard platforms help organizations make quick and informed decisions by presenting complex Analytics Data in simple visual formats. Businesses can instantly understand performance trends using Analytics Charts and Analytics Data Charts without manually analyzing large datasets. This reduces decision time and improves overall business efficiency across departments.
2. Real-Time Performance Tracking
Modern Analytics Software Dashboard systems provide real-time insights into sales, revenue, and operational activities. With Analytics WebApp and Analytics Software WebApp solutions, companies can continuously monitor performance updates. This helps teams react quickly to market changes and improve business outcomes through accurate and timely information.
3. Improved Data Visualization
Analytics Dashboard design focuses on transforming raw data into meaningful visuals using Analytics UI components and Analytics Dashboard Ui Kit systems. These tools help businesses display information in structured layouts, making it easier for users to interpret reports, trends, and key performance indicators effectively.
4. Better Operational Efficiency
Analytics Software and Data Analytics Dashboard platforms reduce manual reporting work by automating data collection and visualization. Businesses can manage Analytics Data Page reports and streamline workflows using Analytics Admin Ui Kit structures. This improves productivity and ensures smoother operational management across teams.
5. Scalable Business Intelligence System
Advanced Business Analytics Dashboard and Analytics Web Application Kit solutions support growing business needs by offering flexible and scalable architectures. Companies can expand their reporting systems, integrate new data sources, and upgrade Analytics Software Design features without affecting performance or usability.
Profit Overview in Business Analytics Dashboard Systems
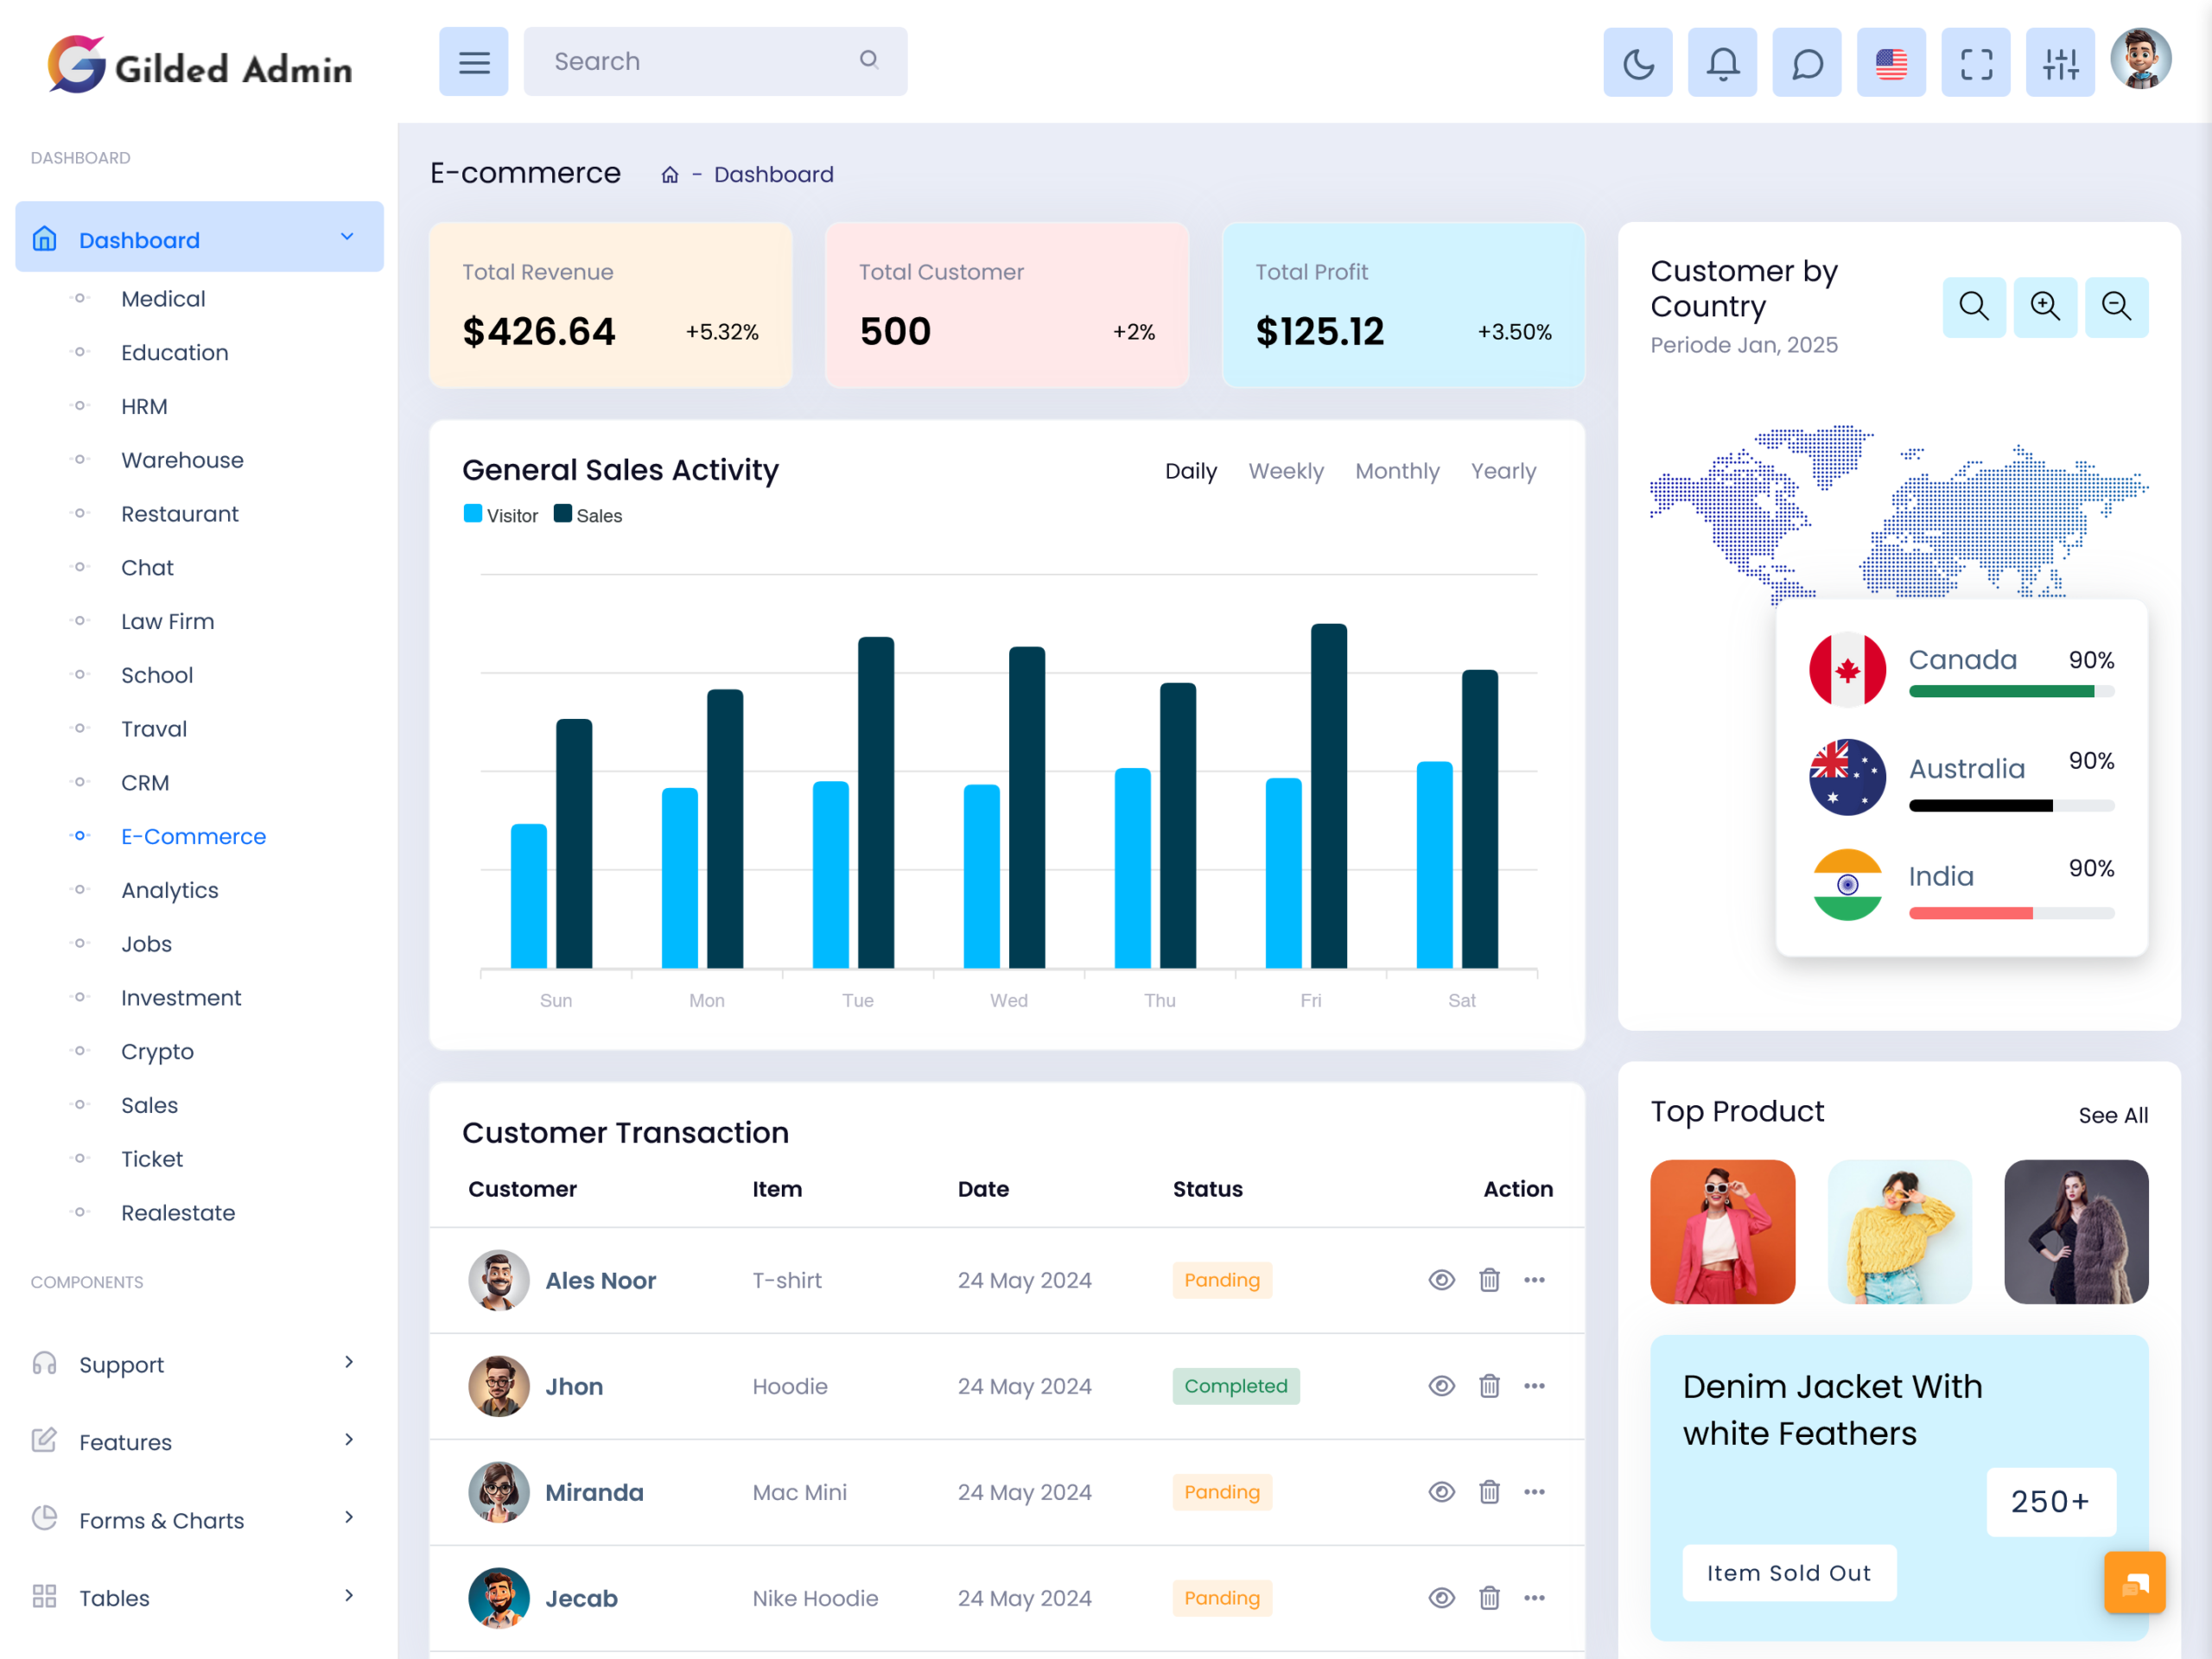
Profit tracking is a core function of modern business intelligence platforms, helping organizations understand overall financial performance. An Analytics Dashboard provides a clear view of profit trends by combining revenue, cost, and operational data into structured visual reports. Businesses use Analytics Data systems to monitor earnings, evaluate margins, and identify areas where profitability can be improved. This helps management teams make better financial decisions with accurate insights.
Advanced Business Analytics Dashboard and Analytics Software Dashboard platforms use Analytics Charts and Analytics Data Charts to present profit movement in a simplified visual format. With Analytics WebApp systems and Analytics Software WebApp tools, companies can track daily, weekly, and monthly profit performance. Using Analytics Dashboard Ui Kit and Analytics Admin Ui Kit components, organizations can design intuitive dashboards that improve financial clarity, support forecasting, and enhance overall business planning strategies.
User Growth and Average Reach per Post Analysis
Understanding user growth is essential for evaluating how a business expands its audience over time. An Analytics Dashboard helps organizations track new users, returning users, and overall engagement patterns in a structured way. By using Analytics Data and reporting modules, companies can clearly identify how user activity changes across different time periods and marketing campaigns. This allows teams to adjust strategies and improve audience reach effectively.
Modern Analytics WebApp and Analytics Software Dashboard systems also help measure average reach per post through detailed performance tracking tools. Using Analytics Charts and Analytics Data Charts, businesses can analyze content visibility, engagement rates, and audience interaction trends. With Analytics Dashboard design principles and Analytics UI components, organizations can create clear visual reports that improve understanding of user behavior and content performance across platforms.
Referrer Category Based Revenue Tracking
Tracking revenue by referrer category helps businesses understand which channels bring the most valuable traffic and conversions. An Analytics Dashboard enables organizations to segment Analytics Data based on sources such as direct traffic, social media, paid ads, and organic search. This structured insight allows teams to evaluate which referrer channels generate higher revenue and optimize marketing strategies accordingly for better performance.
Modern Data Analytics Dashboard and Business Analytics Dashboard platforms use Analytics Charts and Analytics Data Charts to visualize revenue contribution from each referrer category. With Analytics Software WebApp systems, businesses can monitor customer journeys and conversion paths more effectively. Using Analytics Dashboard Ui Kit and Analytics UI components, organizations can design clear reporting interfaces that improve visibility, enhance marketing decisions, and strengthen overall business growth strategies.
Booking History Management
Managing booking history is important for businesses that handle appointments, reservations, or service-based transactions. An Analytics WebApp Dashboard helps organizations store and organize all booking-related Analytics Data in a structured system. It allows teams to track past bookings, upcoming schedules, cancellations, and customer activity in one centralized view. This improves operational clarity and reduces manual record management.
Modern Analytics Software WebApp and Data Analytics WebApp platforms use Analytics Charts and Analytics Data Charts to analyze booking trends and customer behavior patterns. With Analytics Dashboard design principles and Analytics UI components, businesses can build clean interfaces that show booking status, timing, and performance insights. Using Analytics Dashboard Ui Kit and Analytics Web Application Kit solutions, organizations can improve scheduling efficiency, enhance customer experience, and maintain better control over booking operations.
Core Features of Analytics Dashboard UI
1. Interactive Data Visualization Panels
Modern Analytics Dashboard systems provide interactive visualization panels that help users understand complex Analytics Data easily. These panels use Analytics Charts and structured layouts to display real-time business insights. Users can explore performance metrics, filter data, and analyze trends without technical difficulty, improving overall decision-making efficiency.
2. Dynamic UI Components System
Analytics UI components play a key role in building flexible and responsive dashboard interfaces. With Analytics Dashboard Ui Kit and Analytics Admin Ui Kit solutions, developers can create reusable elements like cards, tables, and widgets. This improves design consistency and enhances user experience across Analytics Software WebApp platforms.
3. Real-Time Data Integration
Analytics Software Dashboard platforms support real-time data synchronization from multiple sources. Businesses can continuously monitor updates in sales, revenue, and user activity. This ensures accurate reporting and helps teams respond quickly to changing business conditions using live Analytics Data Charts.
4. Customizable Dashboard Layouts
Analytics Dashboard design allows users to customize layouts based on business needs. With Analytics Web Application Kit and Analytics Web Design systems, organizations can adjust components, rearrange charts, and personalize views. This flexibility improves usability and ensures better alignment with business goals.
5. Advanced Reporting and Export Tools
Modern Data Analytics Dashboard systems offer advanced reporting features that allow users to export data in multiple formats. Businesses can generate detailed reports from Analytics Data Page modules and share insights easily. This improves collaboration and supports strategic planning across departments.
Dark and Light Mode Experience
Modern analytics platforms focus heavily on user comfort and visual adaptability, and dark and light mode features play an important role in improving usability. An Analytics Web Application Kit provides flexible theme options that allow users to switch between dark and light interfaces based on preference or working environment. This enhances readability of Analytics Data and reduces eye strain during long hours of dashboard usage.
Advanced Analytics Software WebApp and Analytics Dashboard design systems ensure that both themes maintain consistent structure across all Analytics UI components. Charts, tables, and reports automatically adjust using Analytics Charts and Analytics Data Charts for better visibility in any mode. With Analytics Dashboard Ui Kit and Analytics UI Framework integration, businesses can deliver a smooth, responsive, and visually balanced experience across devices, improving overall interaction and productivity.
Conclusion
Modern Analytics Dashboard systems have become an essential part of data-driven business operations, helping organizations convert complex information into simple, actionable insights. With the help of Analytics Software Dashboard and Analytics WebApp platforms, businesses can easily track revenue, sales performance, user behavior, and operational efficiency in real time. These systems improve decision-making by organizing Analytics Data into structured visual reports and interactive dashboards that support faster analysis.
Advanced Analytics Dashboard design approaches combined with Analytics UI components and Analytics Dashboard Ui Kit solutions create highly responsive and user-friendly interfaces. Businesses can manage performance, monitor growth, and analyze key metrics using powerful Analytics Charts and reporting tools. With scalable Analytics Web Application Kit and Analytics Software Design systems, organizations can build flexible dashboards that support long-term growth, better visibility, and smarter business intelligence strategies in 2026.
FAQs
1. What is an Analytics Dashboard used for?
An Analytics Dashboard is used to collect, process, and visualize Analytics Data in one place. It helps businesses track performance, sales, revenue, and user behavior using structured reports and Analytics Charts.
2. Why is Analytics Dashboard design important?
Analytics Dashboard design is important because it improves data clarity and user experience. It organizes complex information into simple visual formats using Analytics UI components and Analytics Dashboard Ui Kit systems.
3. What is included in Analytics Software Dashboard systems?
Analytics Software Dashboard systems include real-time reporting tools, Analytics Data Charts, performance tracking modules, and interactive visualization panels for better decision-making.
4. How does Analytics WebApp help businesses?
Analytics WebApp platforms help businesses manage data, monitor KPIs, and analyze performance through responsive dashboards built with Analytics Web Application Kit and Analytics Software WebApp tools.
5. What are the benefits of Analytics Charts?
Analytics Charts help visualize business data such as sales, revenue, and user growth. They make it easier to understand trends and improve strategic planning.
6. What is the role of Analytics UI components?
Analytics UI components provide reusable design elements like cards, tables, and widgets that help build consistent and user-friendly dashboard interfaces.
7. Why do businesses use Business Analytics Dashboard systems?
Business Analytics Dashboard systems help companies improve decision-making, track performance metrics, and gain real-time insights for better business growth and planning.

Related Posts