
Modern businesses collect large amounts of information every day. Sales records, customer activities, financial updates,…
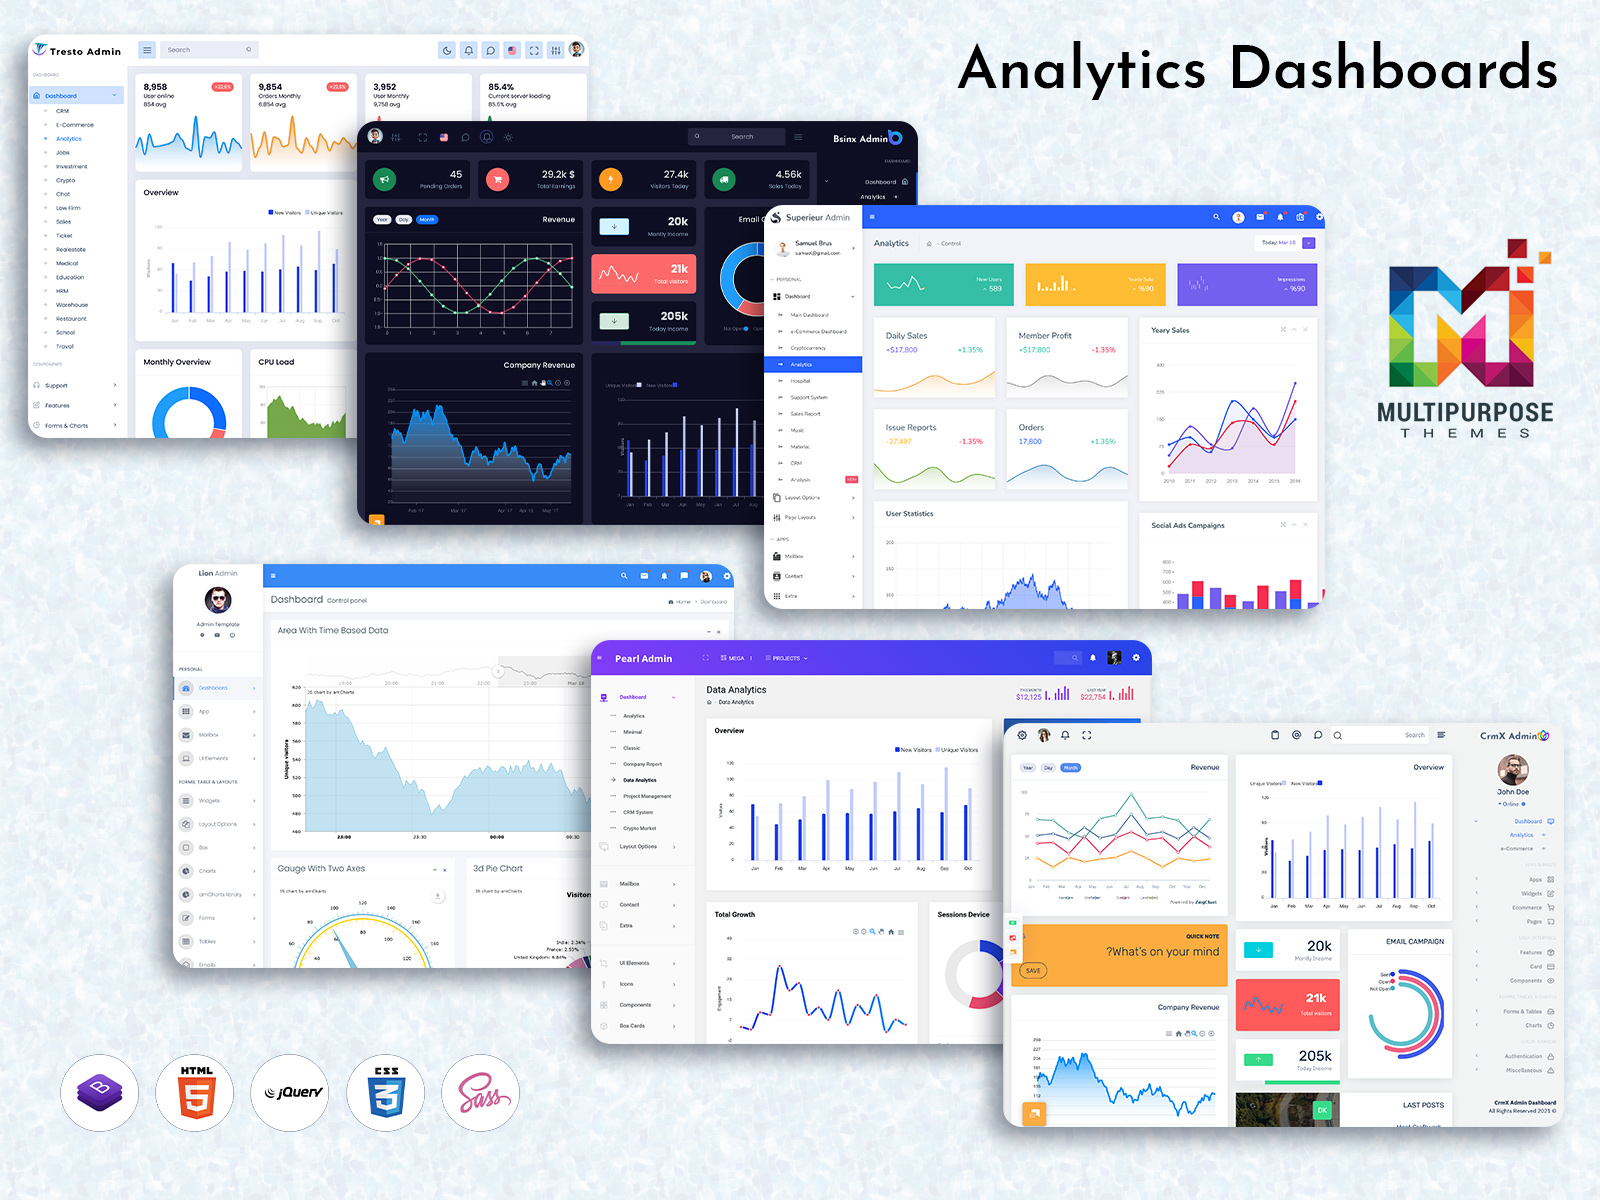
How Analytical Dashboard Help Companies Turn Raw Data into Real Growth in 2026
Reading Time: 7 minutes
In the digital era, businesses are surrounded by data at every step, making an Analytical Dashboard an essential tool for turning this overwhelming information into clear, actionable insights. Every click, transaction, customer interaction, and operational process generates valuable data. However, despite having access to such massive amounts of information, many organizations still struggle to make timely and effective decisions. The problem is not the lack of data, but the lack of clarity.
Traditional methods like spreadsheets, manual reports, and disconnected tools often fail to provide a complete picture. Teams spend hours collecting and organizing data instead of actually using it. This delay in decision-making can cost businesses both time and opportunities. In such a competitive environment, companies need faster, smarter, and more reliable ways to interpret their data.
This is where an Analytics Dashboard plays a transformative role. It acts as a centralized platform that converts raw data into meaningful insights, helping businesses move from confusion to clarity and from data overload to confident decision-making.
Discover Analytical Dashboard
CrmX Admin

BUY NOW DEMO
VoiceX Admin

BUY NOW DEMO
Pearl Admin

BUY NOW DEMO
BsinX Admin

BUY NOW DEMO
Gilded Admin
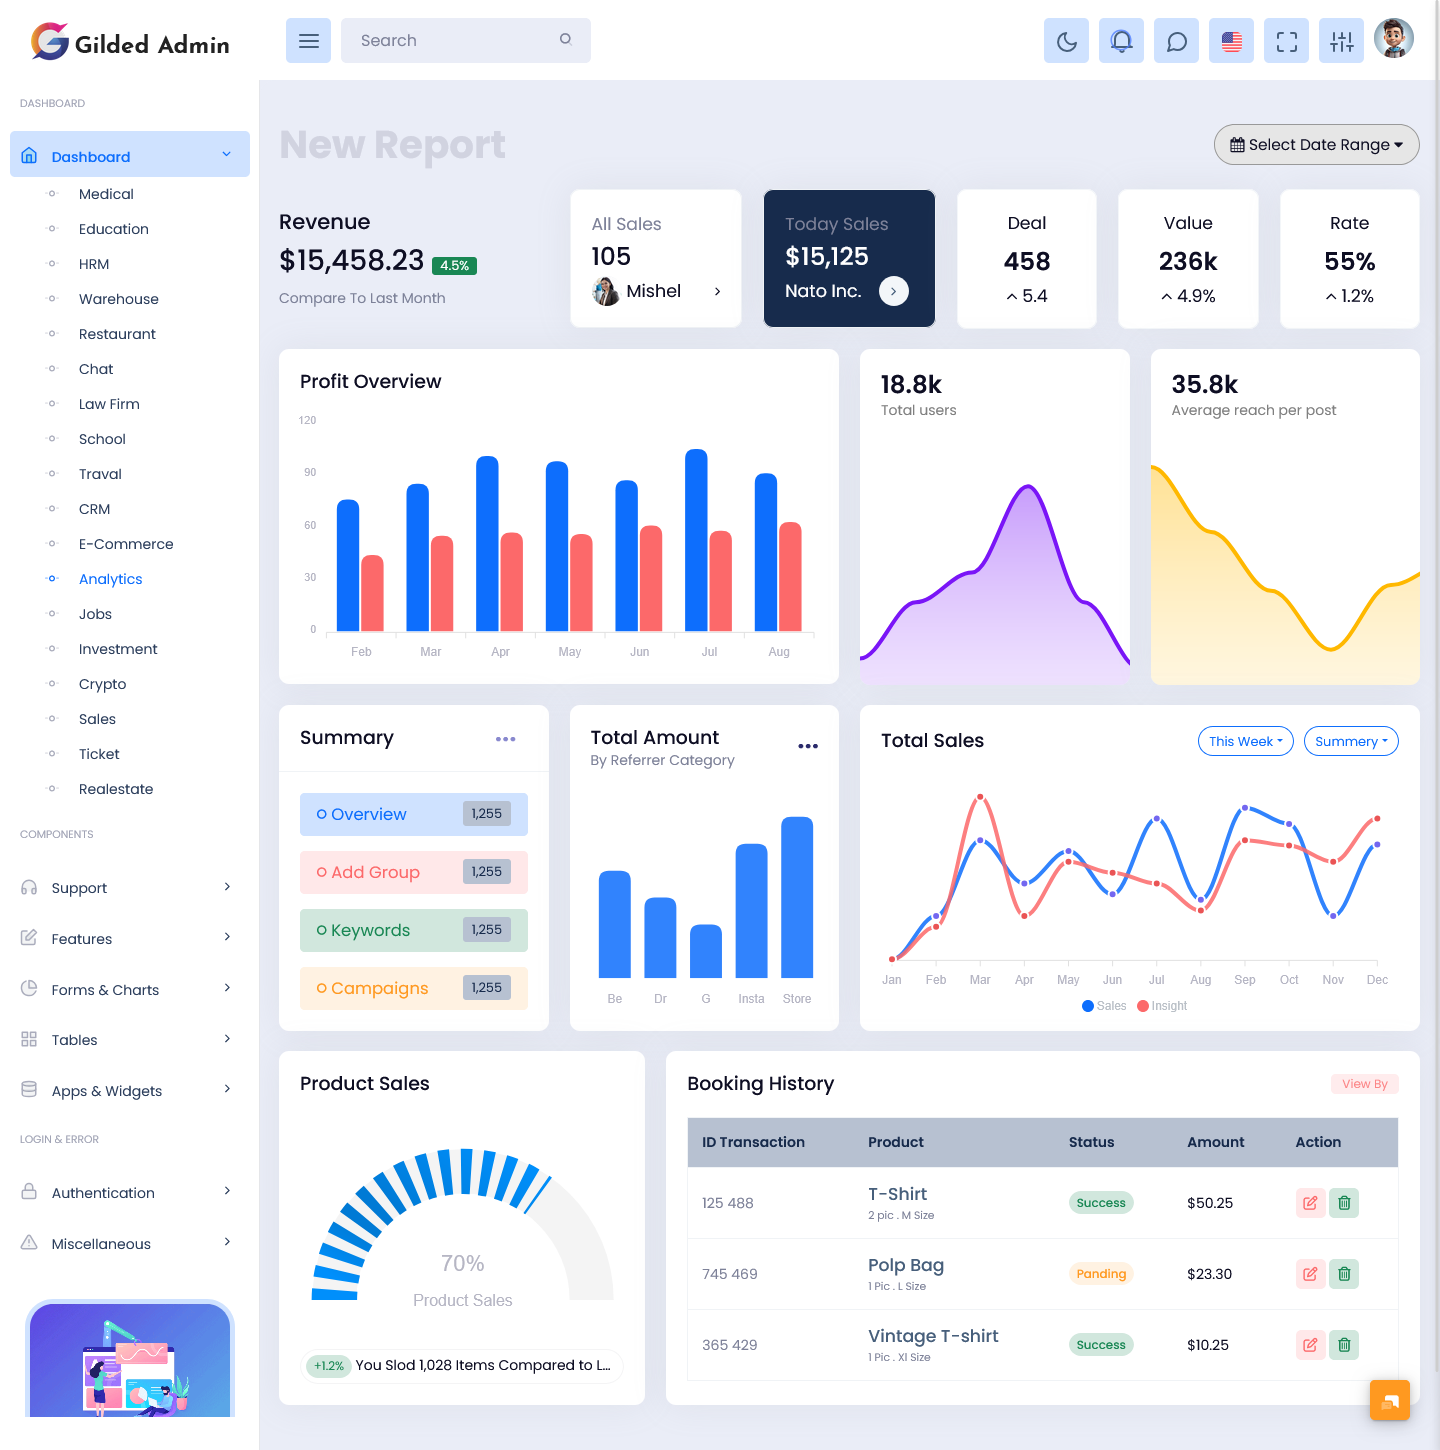
BUY NOW DEMO
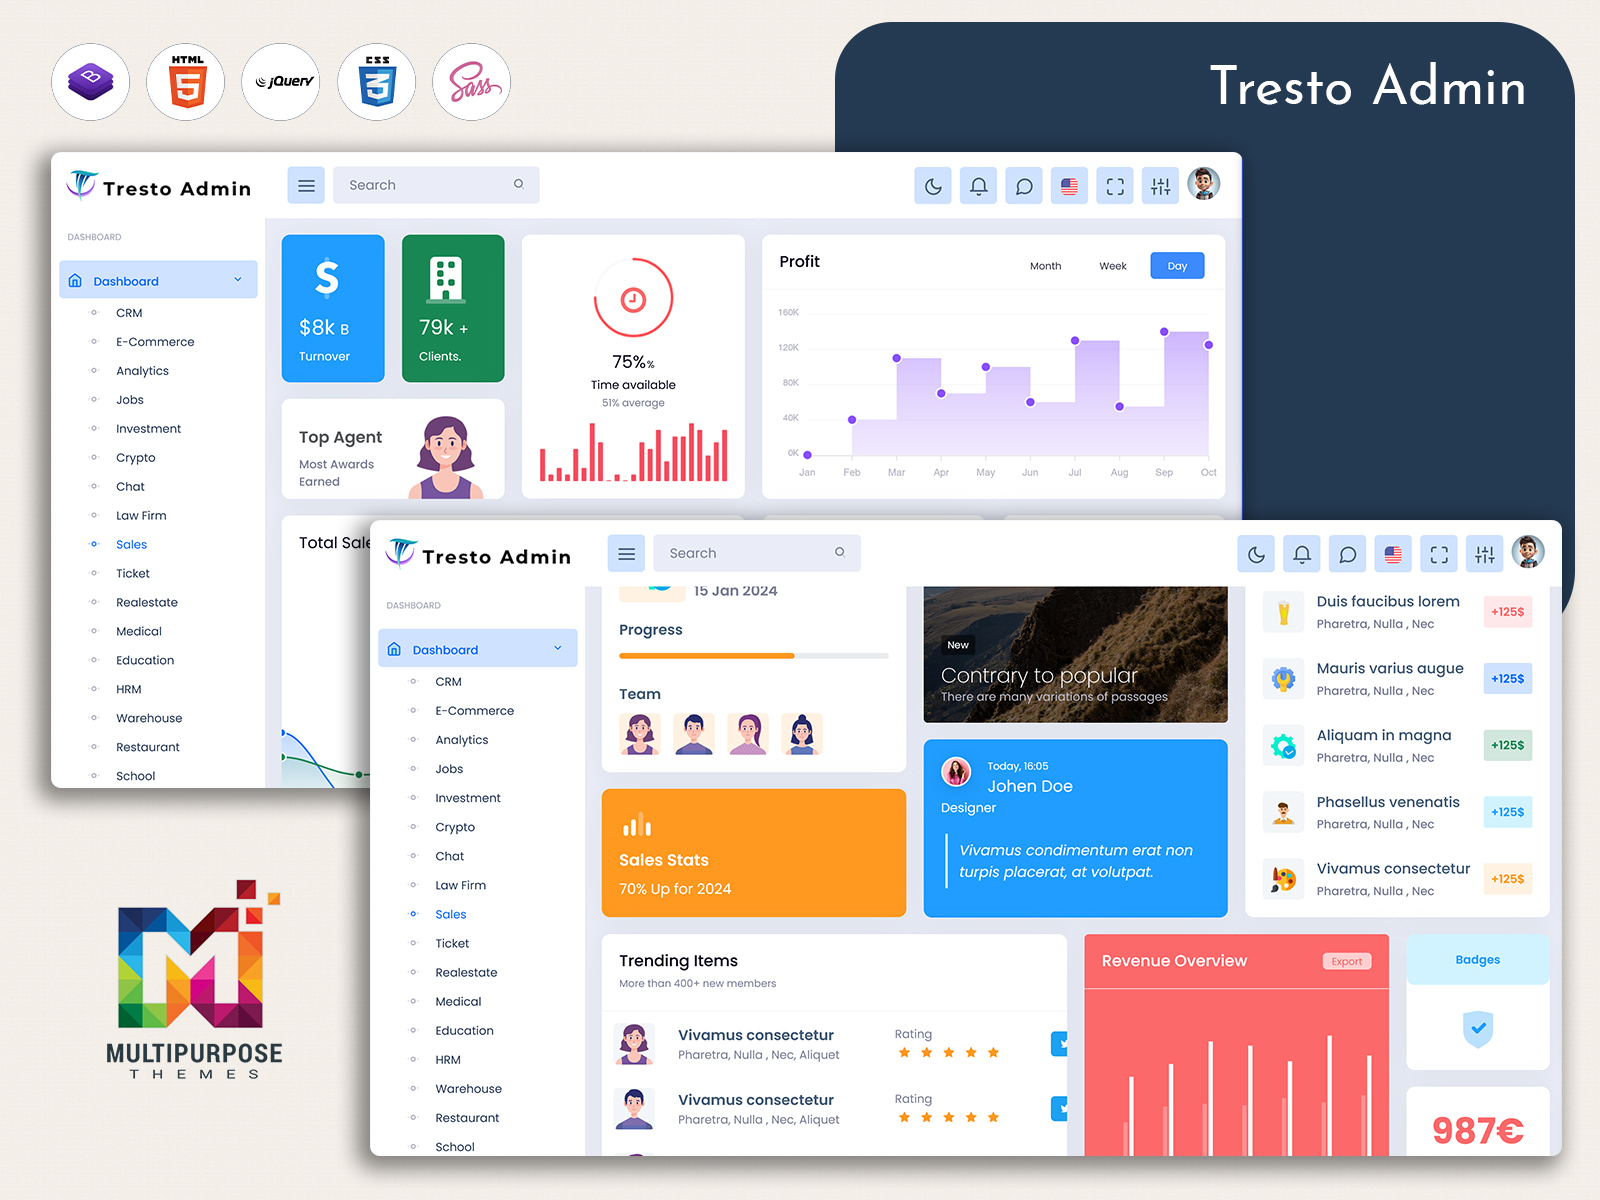
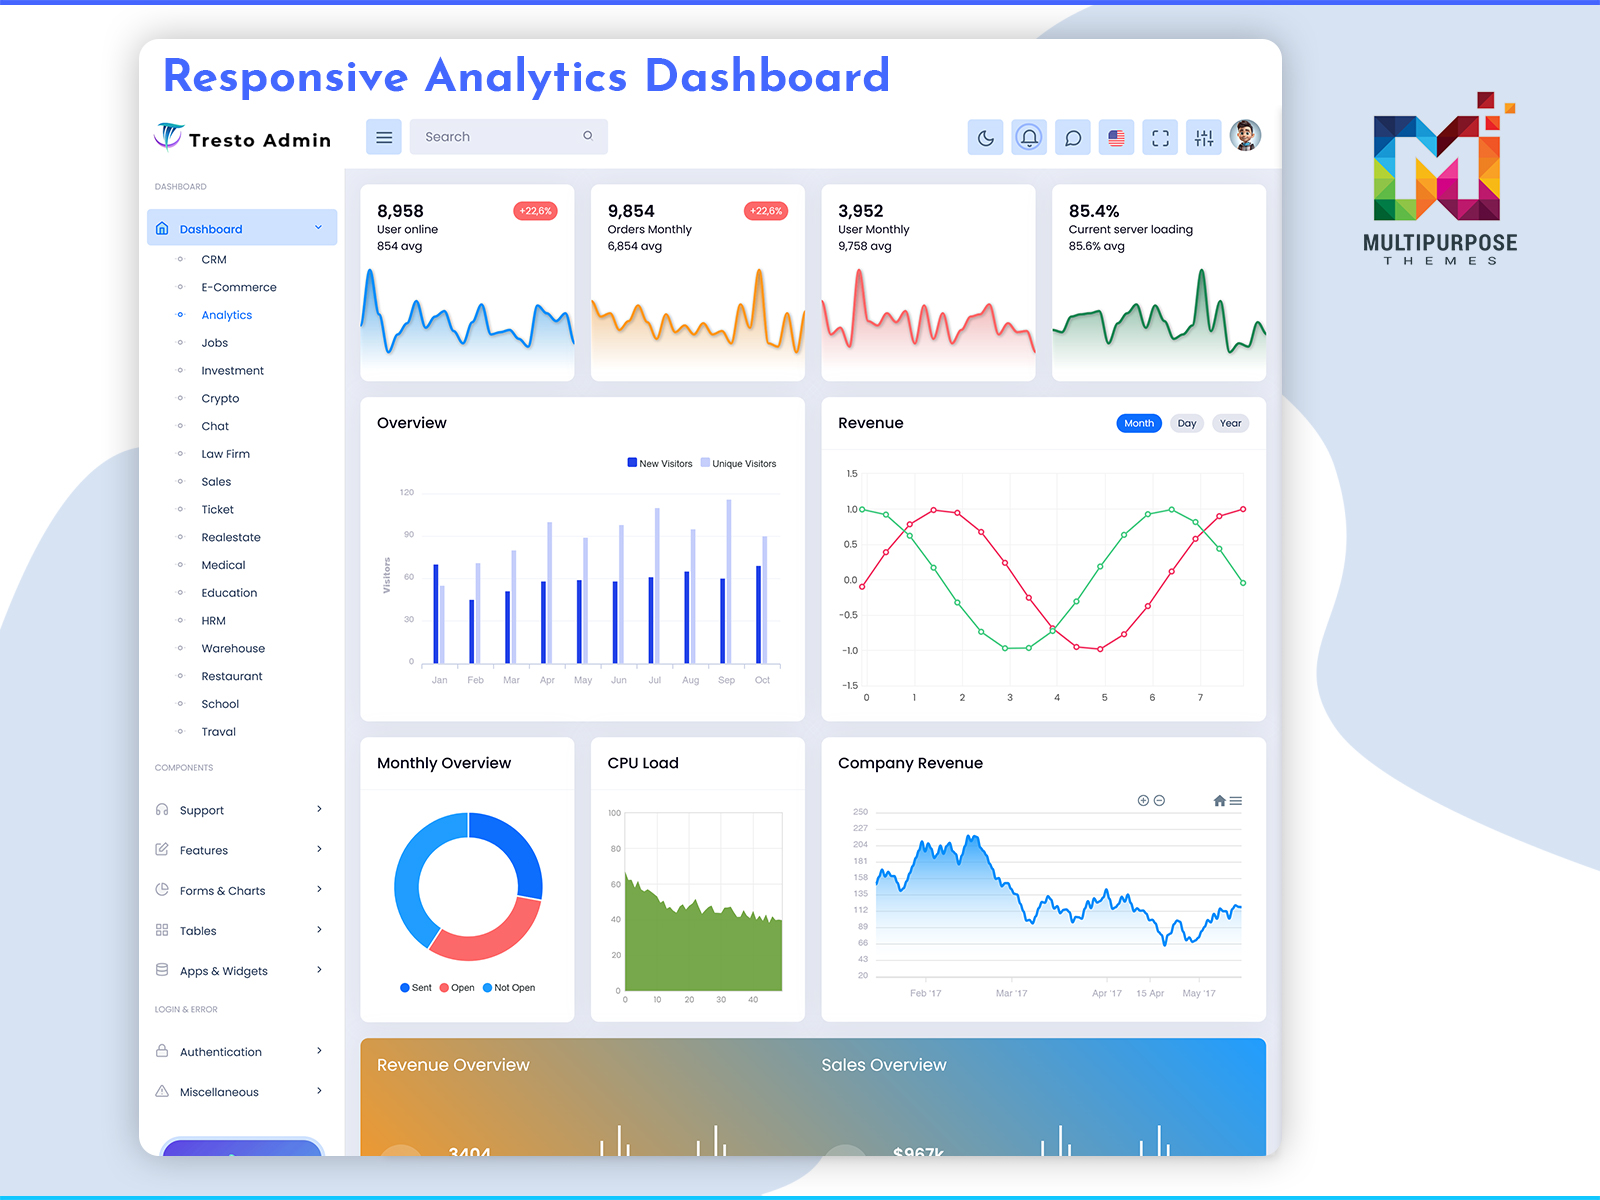
Tresto Admin
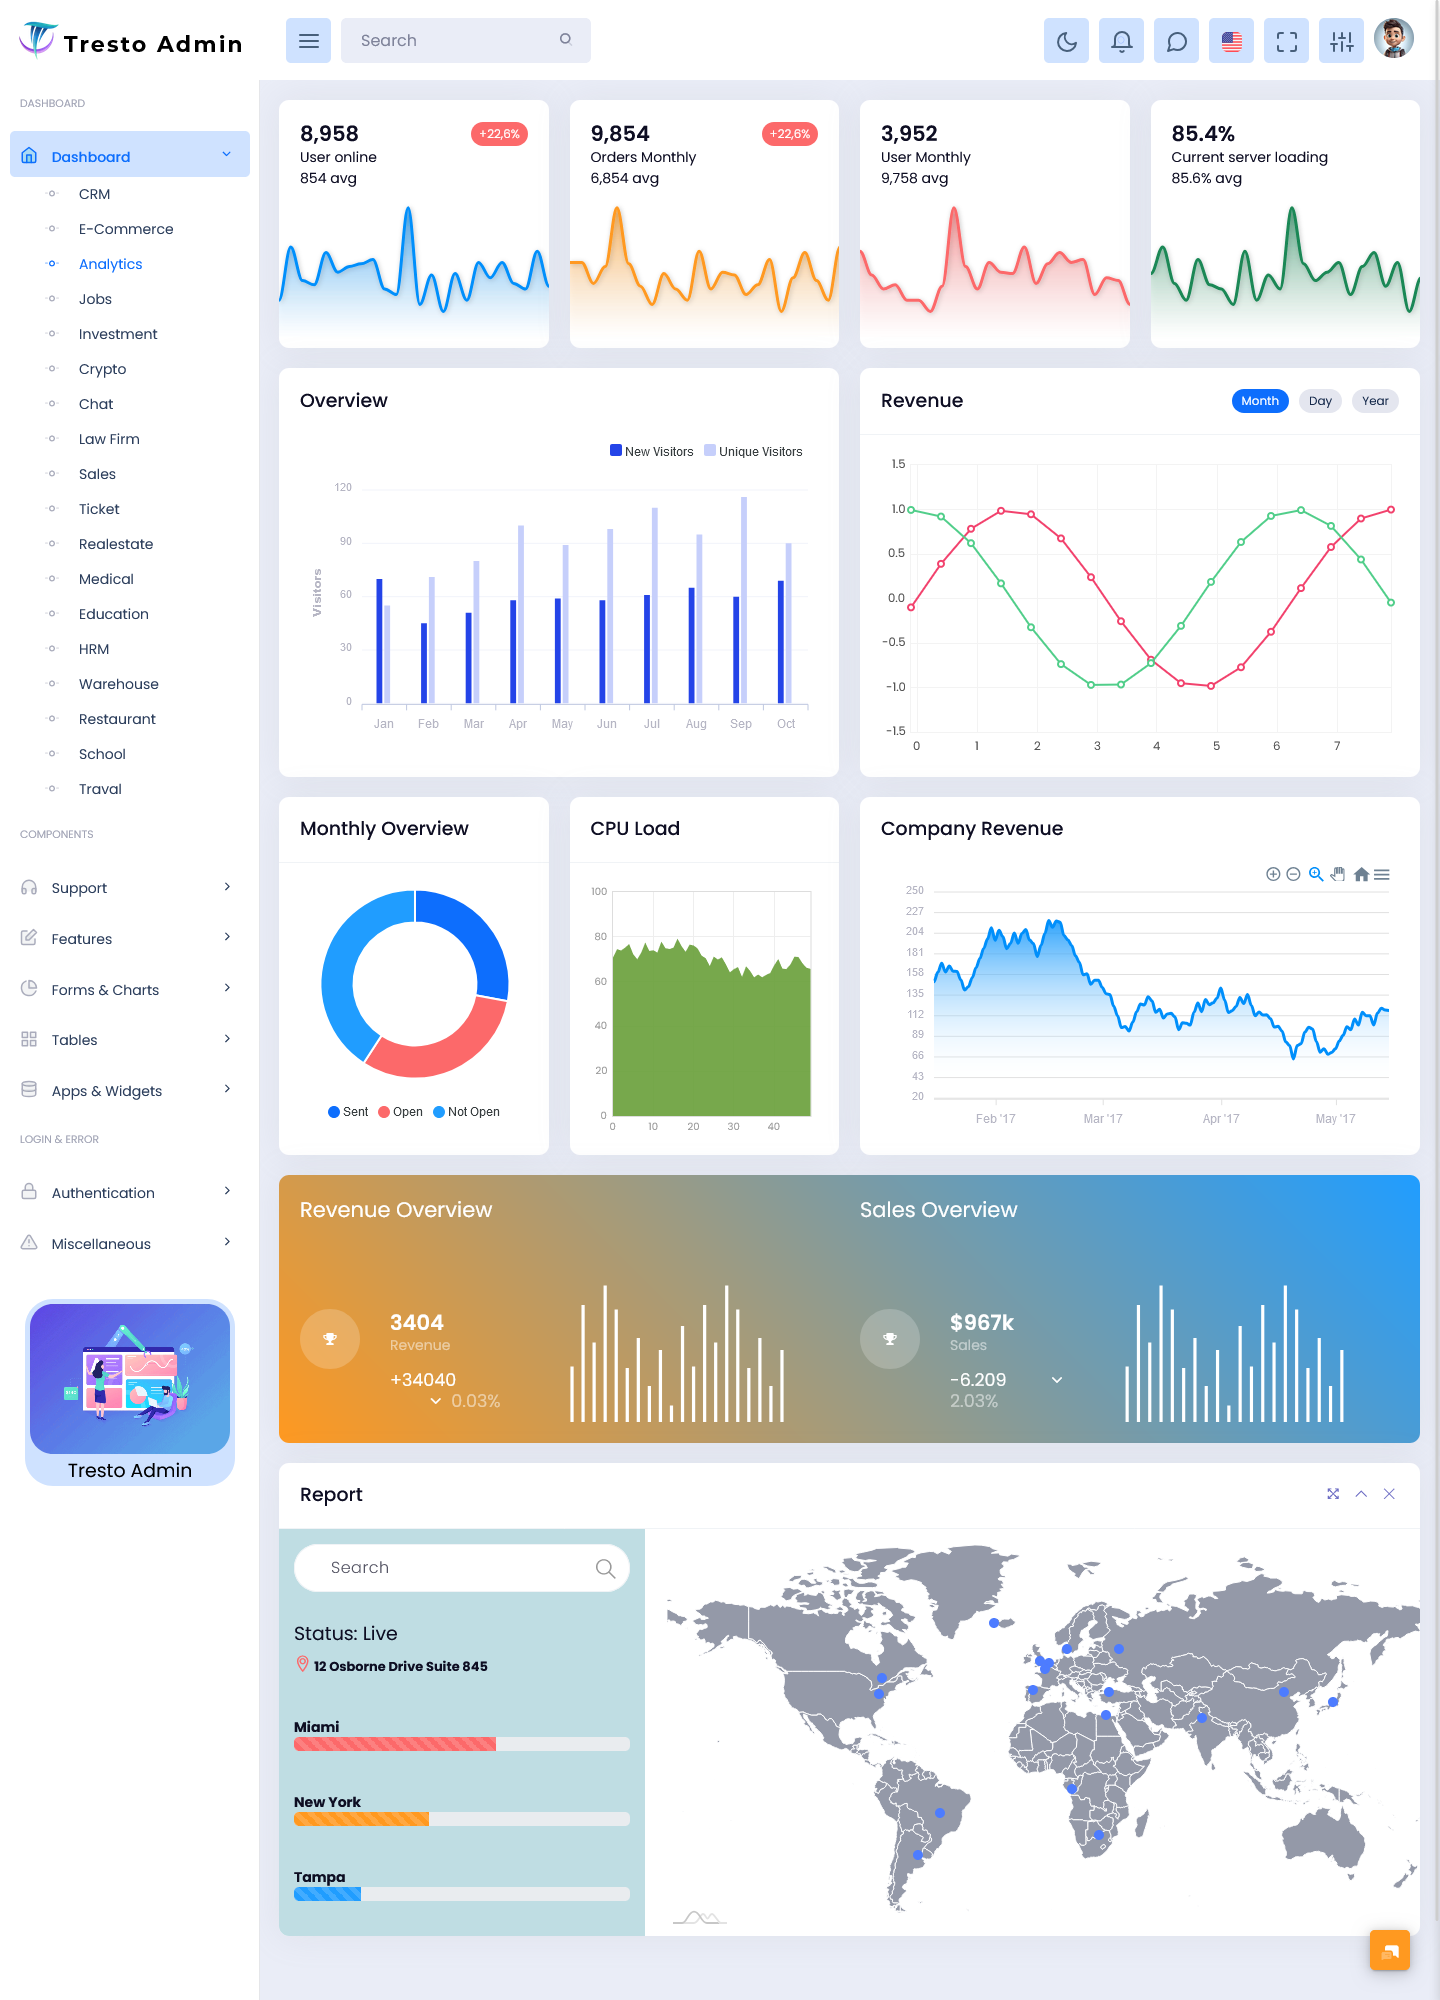
BUY NOW DEMO
The Rising Importance of Data-Driven Business Strategies
Modern businesses no longer rely on intuition alone. Data has become the foundation of every major decision, from marketing campaigns to operational improvements. Organizations that successfully use data analytics are often the ones leading their industries.
Global leaders like Amazon use customer data to personalize shopping experiences and optimize supply chains. Netflix analyzes user behavior to recommend content that keeps audiences engaged. Tesla continuously collects and evaluates real-time data to improve vehicle performance and safety.
What sets these companies apart is not just their access to data, but their ability to interpret and act on it quickly. Analytical Dashboards make this possible by bringing all critical data points into one unified view. This enables businesses to identify patterns, monitor performance, and respond to changes without delay.
Understanding Analytical Dashboards in a Practical Way
An Analytics Dashboard is much more than a collection of charts and graphs. It is a smart interface that gathers data from multiple sources and presents it in a visually organized and interactive format.
Instead of scrolling through endless rows of numbers, users can instantly understand key metrics through visual elements like graphs, tables, and performance indicators. Whether it is sales growth, customer engagement, or operational efficiency, everything is displayed in a way that is easy to interpret.
The real strength of an Analytical Dashboard lies in its ability to simplify complexity. It transforms large datasets into actionable insights, making it easier for decision-makers to focus on what truly matters.
How Analytical Dashboards Improve Business Decision-Making
One of the biggest advantages of an Analytical Dashboard is the speed at which it enables decision-making. In traditional systems, reports are often generated daily, weekly, or even monthly. By the time the data is analyzed, it may already be outdated.
With real-time data visualization, businesses can monitor performance as it happens. For example, a sales team can track daily revenue, identify top-performing products, and adjust strategies instantly. Marketing teams can analyze campaign performance and make immediate changes to improve results.
This level of responsiveness allows businesses to stay agile and competitive. It also reduces dependency on manual processes, minimizing errors and improving overall efficiency.
Industry Applications of Analytical Dashboards
Bootstrap 5 Admin Dashboards are not limited to a single industry. Their flexibility makes them valuable across various sectors, each with its own unique requirements.
In the e-commerce industry, businesses rely heavily on data to understand customer behavior and optimize sales strategies. Platforms like Shopify enable sellers to manage their online stores, but Analytical Dashboards take it a step further by providing deeper insights into customer journeys, product performance, and conversion rates. This helps businesses make informed decisions that directly impact revenue.
In the financial sector, dashboards play a critical role in monitoring transactions, managing risks, and analyzing investment performance. Banks and investment firms use them to gain real-time visibility into financial data, allowing them to respond quickly to market changes and maintain regulatory compliance.
Healthcare organizations use Analytical Dashboards to improve patient care and operational efficiency. By analyzing patient data, hospital performance, and resource utilization, healthcare providers can deliver better services while reducing costs and wait times.
In logistics and supply chain management, dashboards help track shipments, monitor delivery timelines, and optimize inventory levels. Companies can identify delays, improve route planning, and ensure smoother operations, which is essential in today’s fast-paced delivery environment.
Human resource and recruitment firms also benefit from Analytical Dashboards. They use them to track employee performance, analyze hiring trends, and manage workforce productivity. This data-driven approach helps organizations build stronger teams and improve overall efficiency.
Key Features That Define a Powerful Analytical Dashboard
A well-designed Dashboard Analytics combines functionality with usability. One of its most important features is real-time data updates, which ensure that users always have access to the latest information.
Interactive visualizations allow users to explore data in depth, making it easier to identify trends and patterns. Customizable layouts enable businesses to tailor the dashboard according to their specific needs, ensuring that the most relevant information is always visible.
Modern dashboards also offer seamless integration with various tools and platforms, allowing data to flow smoothly from different sources. Multi-device accessibility ensures that users can access their dashboard from desktops, tablets, or smartphones, making it convenient for teams to stay connected at all times.
Challenges Businesses Face Without Analytical Dashboards
Without a proper UI Dashboard, businesses often face several challenges that can hinder their growth. Data is usually scattered across multiple systems, making it difficult to get a complete view of performance. Manual reporting processes consume valuable time and increase the risk of errors.
Decision-making becomes slower and less reliable, as teams have to depend on outdated or incomplete information. This lack of clarity can lead to missed opportunities and inefficient operations.
In a competitive market, these challenges can significantly impact a company’s ability to grow and succeed. Businesses that fail to adapt to modern data management practices risk falling behind their competitors.
How a Modern Analytical Dashboard Solves These Problems
A modern Analytics Dashboard, especially when built within a well-designed Admin Template, provides a comprehensive solution to these challenges. It centralizes all data into a single platform, eliminating confusion and improving accessibility.
With a clean and intuitive interface, users can easily navigate through different metrics and gain insights without requiring technical expertise. Ready-to-use components and pre-built analytics modules allow businesses to get started quickly, saving both time and resources.
Such dashboards are designed to meet the needs of modern businesses, offering flexibility, scalability, and performance. Whether it is a startup looking to grow or an established company aiming to optimize operations, an Analytical Dashboard can adapt to different requirements.
The Future of Analytical Dashboards in Business
As technology continues to evolve, Analytics Dashboards are becoming more advanced and intelligent. The integration of artificial intelligence and machine learning is enabling predictive analytics, allowing businesses to anticipate trends and make proactive decisions.
Automation is further enhancing efficiency by reducing the need for manual data processing. In the future, dashboards will not only display data but also provide recommendations and insights based on advanced algorithms.
This shift towards intelligent analytics will redefine how businesses operate, making decision-making faster, more accurate, and more strategic.
Conclusion: Turning Data into a Competitive Advantage
Analytical Dashboards are no longer just an optional tool; they have become a necessity for businesses that want to succeed in a data-driven world. By transforming complex data into clear and actionable insights, they empower organizations to make better decisions and achieve sustainable growth.
From e-commerce and finance to healthcare and logistics, every industry can benefit from the power of Bootstrap Admin Dashboards. Businesses that embrace this technology today will be better prepared to face future challenges and seize new opportunities.
Investing in a modern Analytics Dashboard is not just about improving data visualization. It is about building a smarter, more efficient, and more competitive business for the future.
Frequently Asked Questions (FAQs)
1. What is an Analytical Dashboard?
An Analytics Dashboard is a visual tool that displays business data in charts and graphs, helping users quickly understand performance, track key metrics, and make informed decisions in real time.
2. Why is an Analytical Dashboard important for businesses?
It helps businesses convert raw data into actionable insights, improving decision-making, saving time, reducing errors, and enabling teams to respond quickly to changing market conditions.
3. Which industries can use an Analytical Dashboard?
Analytics Dashboards are useful across industries like e-commerce, finance, healthcare, logistics, and HR, where data analysis is essential for improving performance and operational efficiency.
4. How does an Analytical Dashboard improve decision-making?
It provides real-time insights, allowing businesses to monitor performance, identify trends, and make faster decisions based on accurate and up-to-date data instead of outdated reports.
5. What features should a good Analytical Dashboard have?
A powerful dashboard should include real-time updates, interactive charts, customizable widgets, easy navigation, multi-device access, and integration with different tools for seamless data management.
6. Can small businesses benefit from an Analytical Dashboard?
Yes, small businesses can use dashboards to track sales, customer behavior, and operations efficiently, helping them grow faster and compete with larger companies through better data insights.
7. Is technical knowledge required to use an Analytical Dashboard?
Most modern dashboards are designed with user-friendly interfaces, allowing even non-technical users to easily understand data, generate reports, and make informed business decisions.
8. How does an Analytical Dashboard differ from traditional reports?
Unlike static reports, Analytics Dashboards provide real-time, interactive data visualization, enabling users to explore insights dynamically and make quicker, more accurate decisions.
Related Posts


This Post Has 0 Comments