
In today’s digital world, education is changing very fast. Schools, colleges, and training centers are…
Why Every Learning Platform Needs a Smart LMS Dashboard
Reading Time: 5 minutes
Running an online course can feel overwhelming. You have students to track, assignments to grade, and progress to monitor. That’s where an LMS dashboard comes in handy. Think of it as your command center. Everything you need sits in one place. You can see who’s falling behind, which lessons work best, and where students struggle most.
buy now
What Makes a Good Learning Management System Dashboard
The best dashboards don’t just throw numbers at you. They tell a story about your courses and students. First, they show you the big picture. How many students enrolled this month? What’s your completion rate? Which courses perform best? These metrics matter because they guide your decisions.
Second, they let you drill down into details. Maybe your overall numbers look good. However, one particular module has a 40% dropout rate. That’s valuable information. You can now fix the problem before more students quit. Third, they save you time. Instead of pulling data from five different places, everything updates automatically. Your online course dashboard refreshes in real-time. No more manual spreadsheets or guesswork.
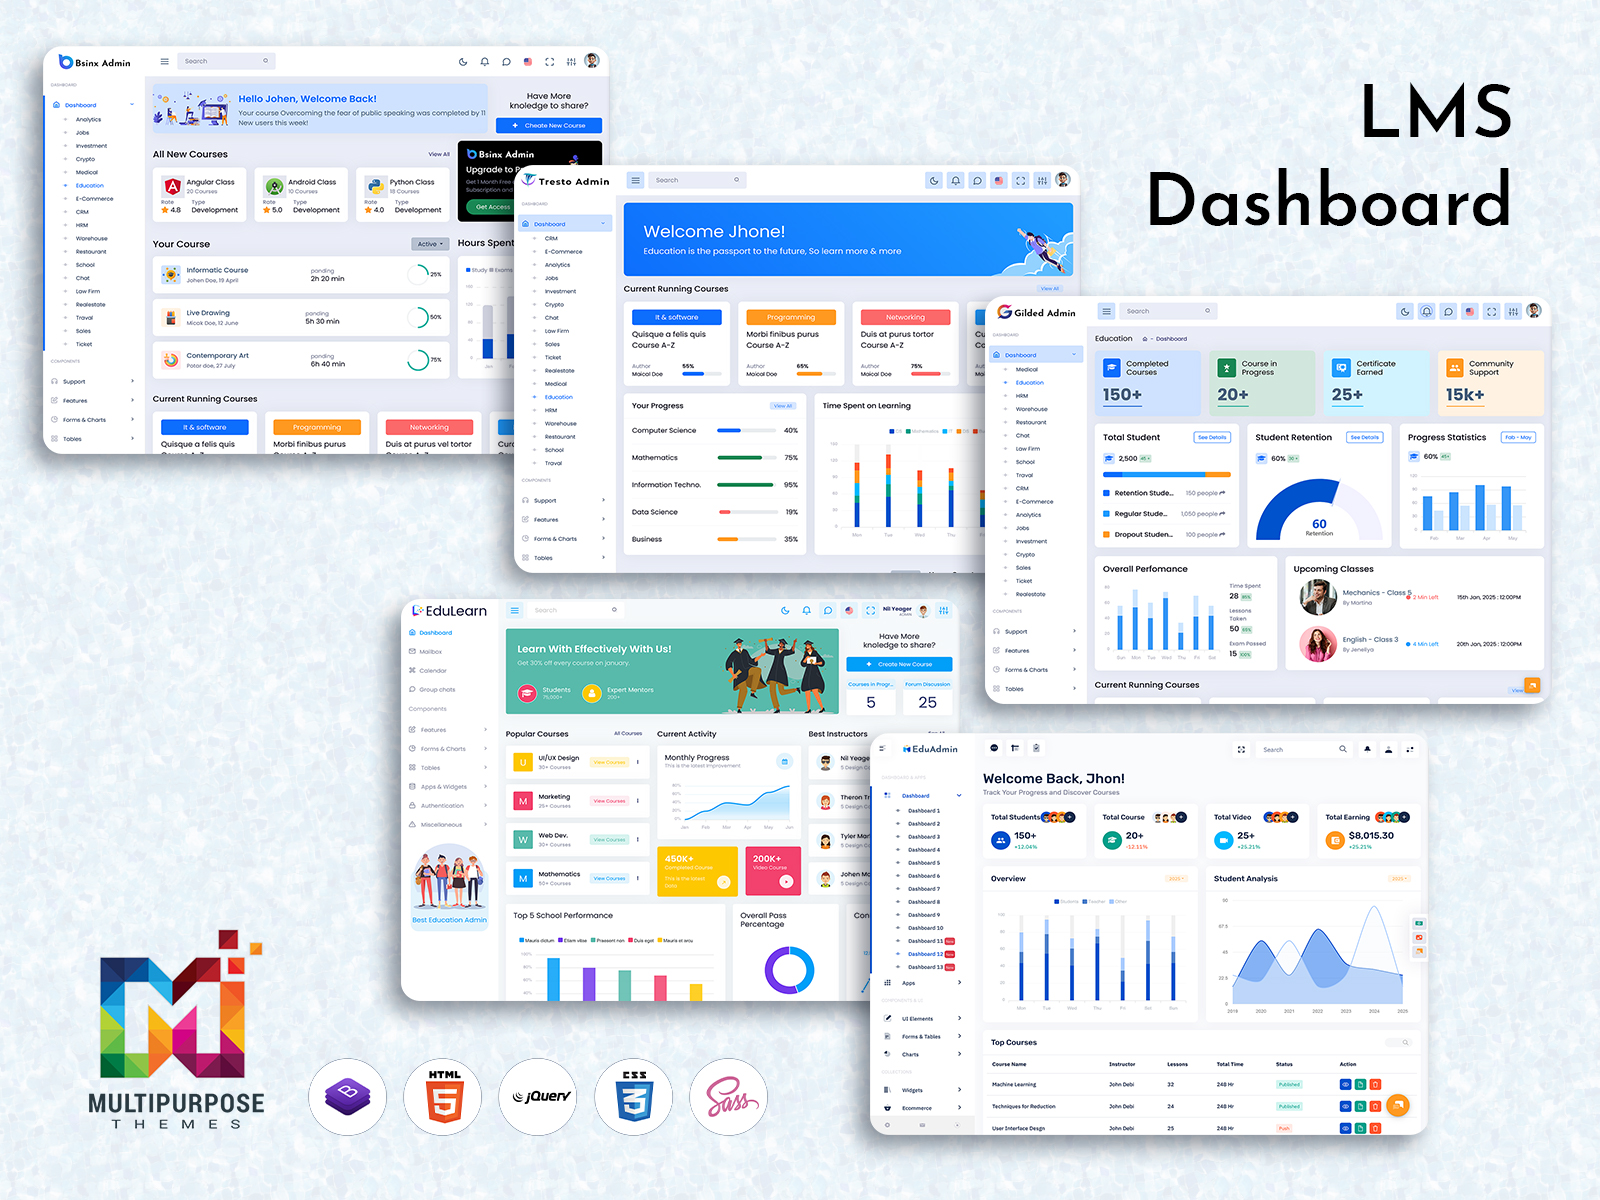
Explore Dashboard Design of Different Admins
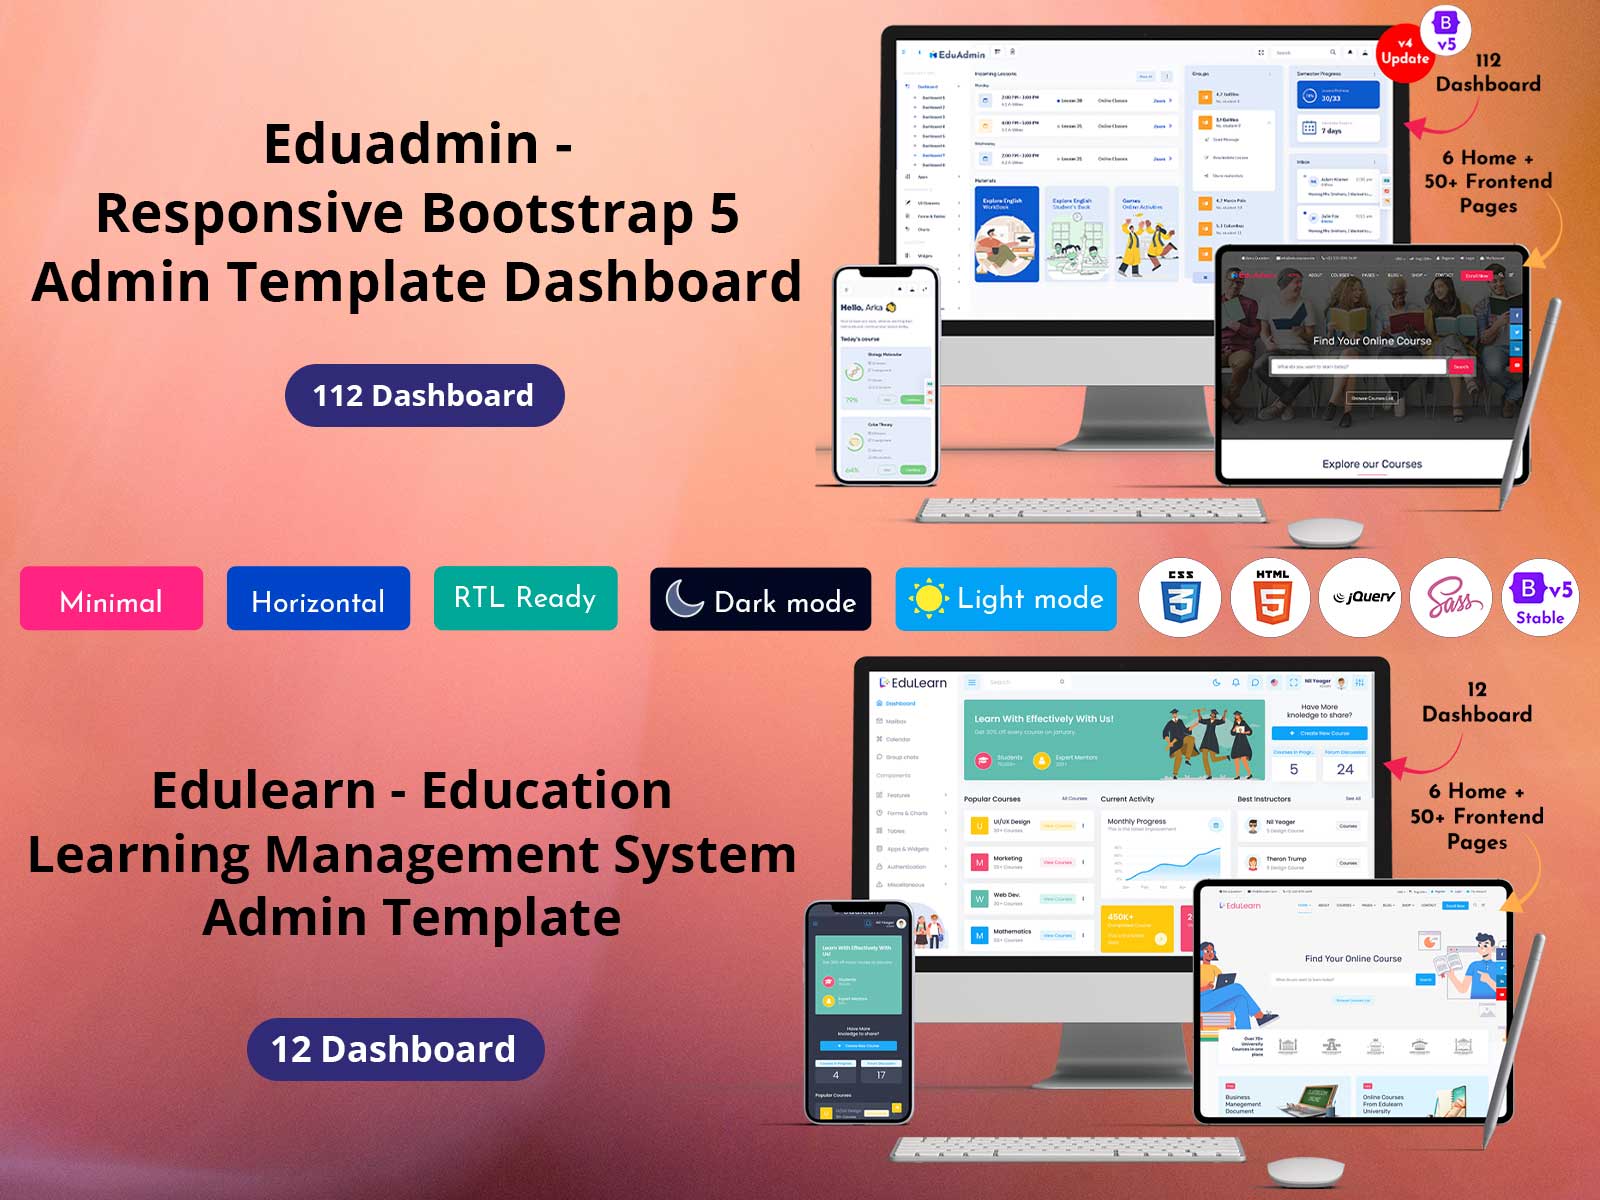
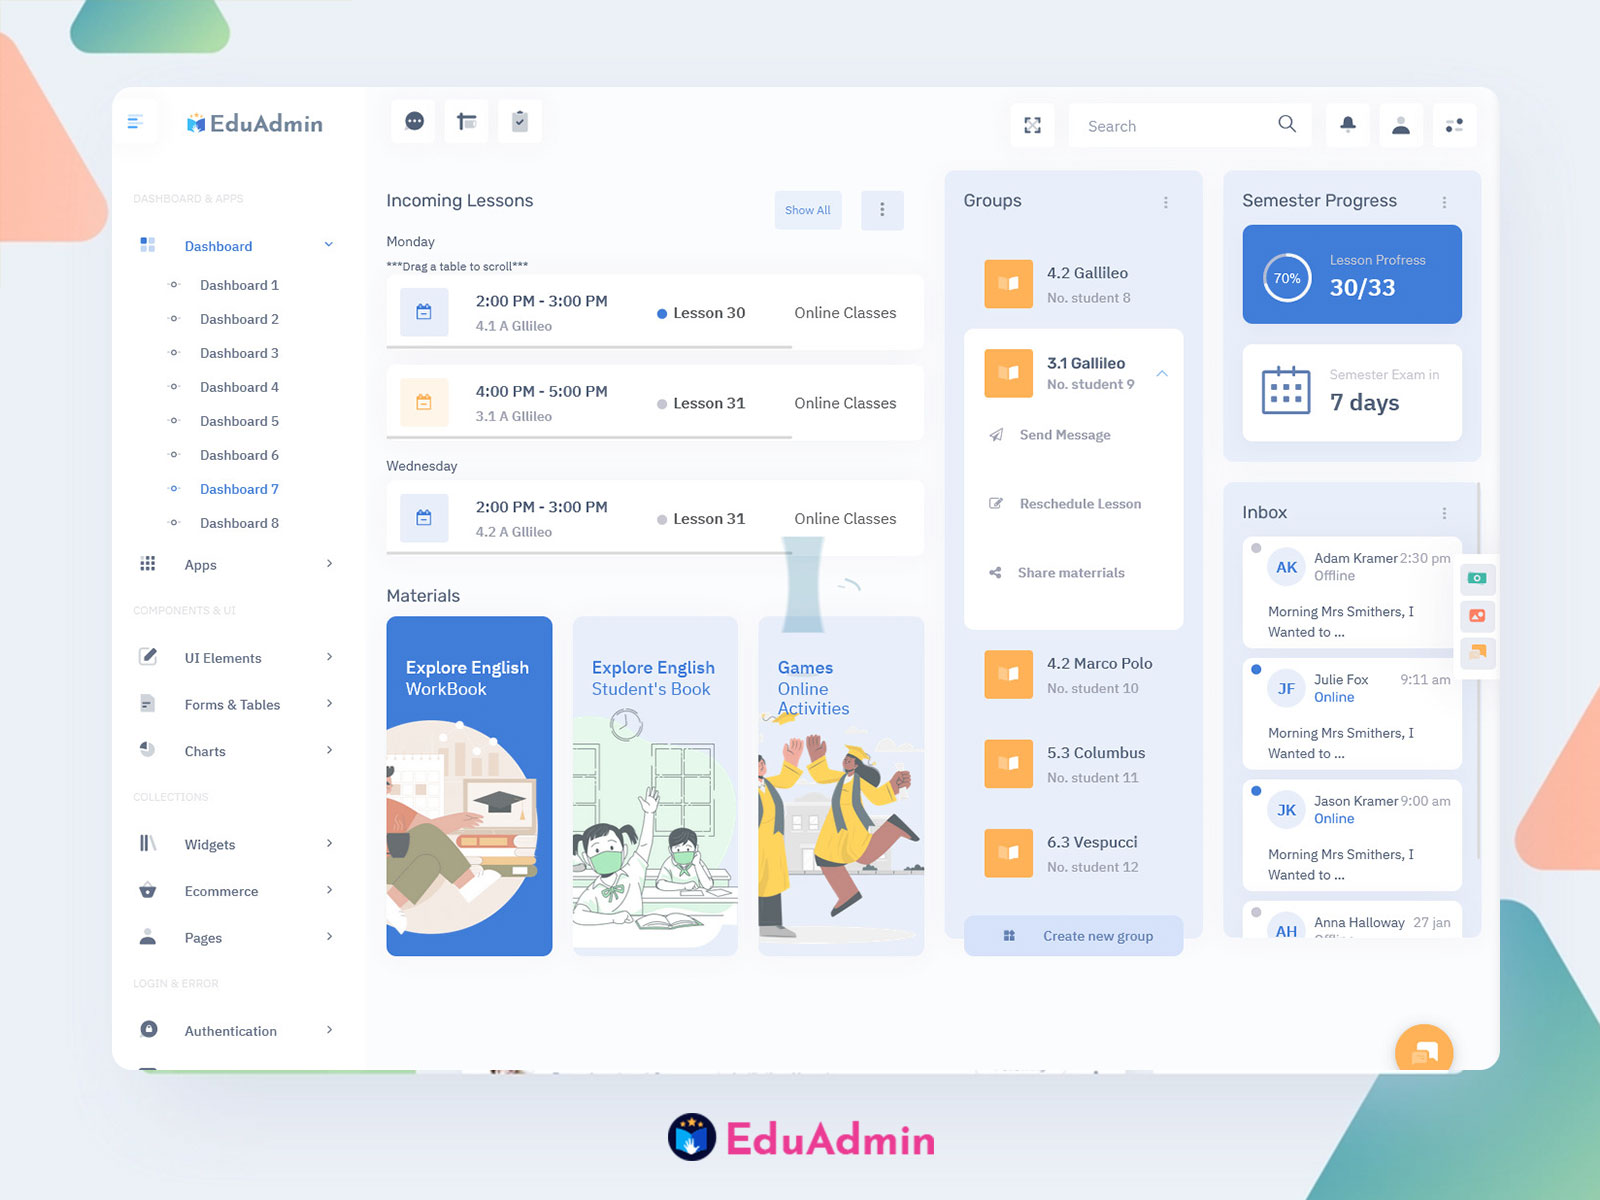
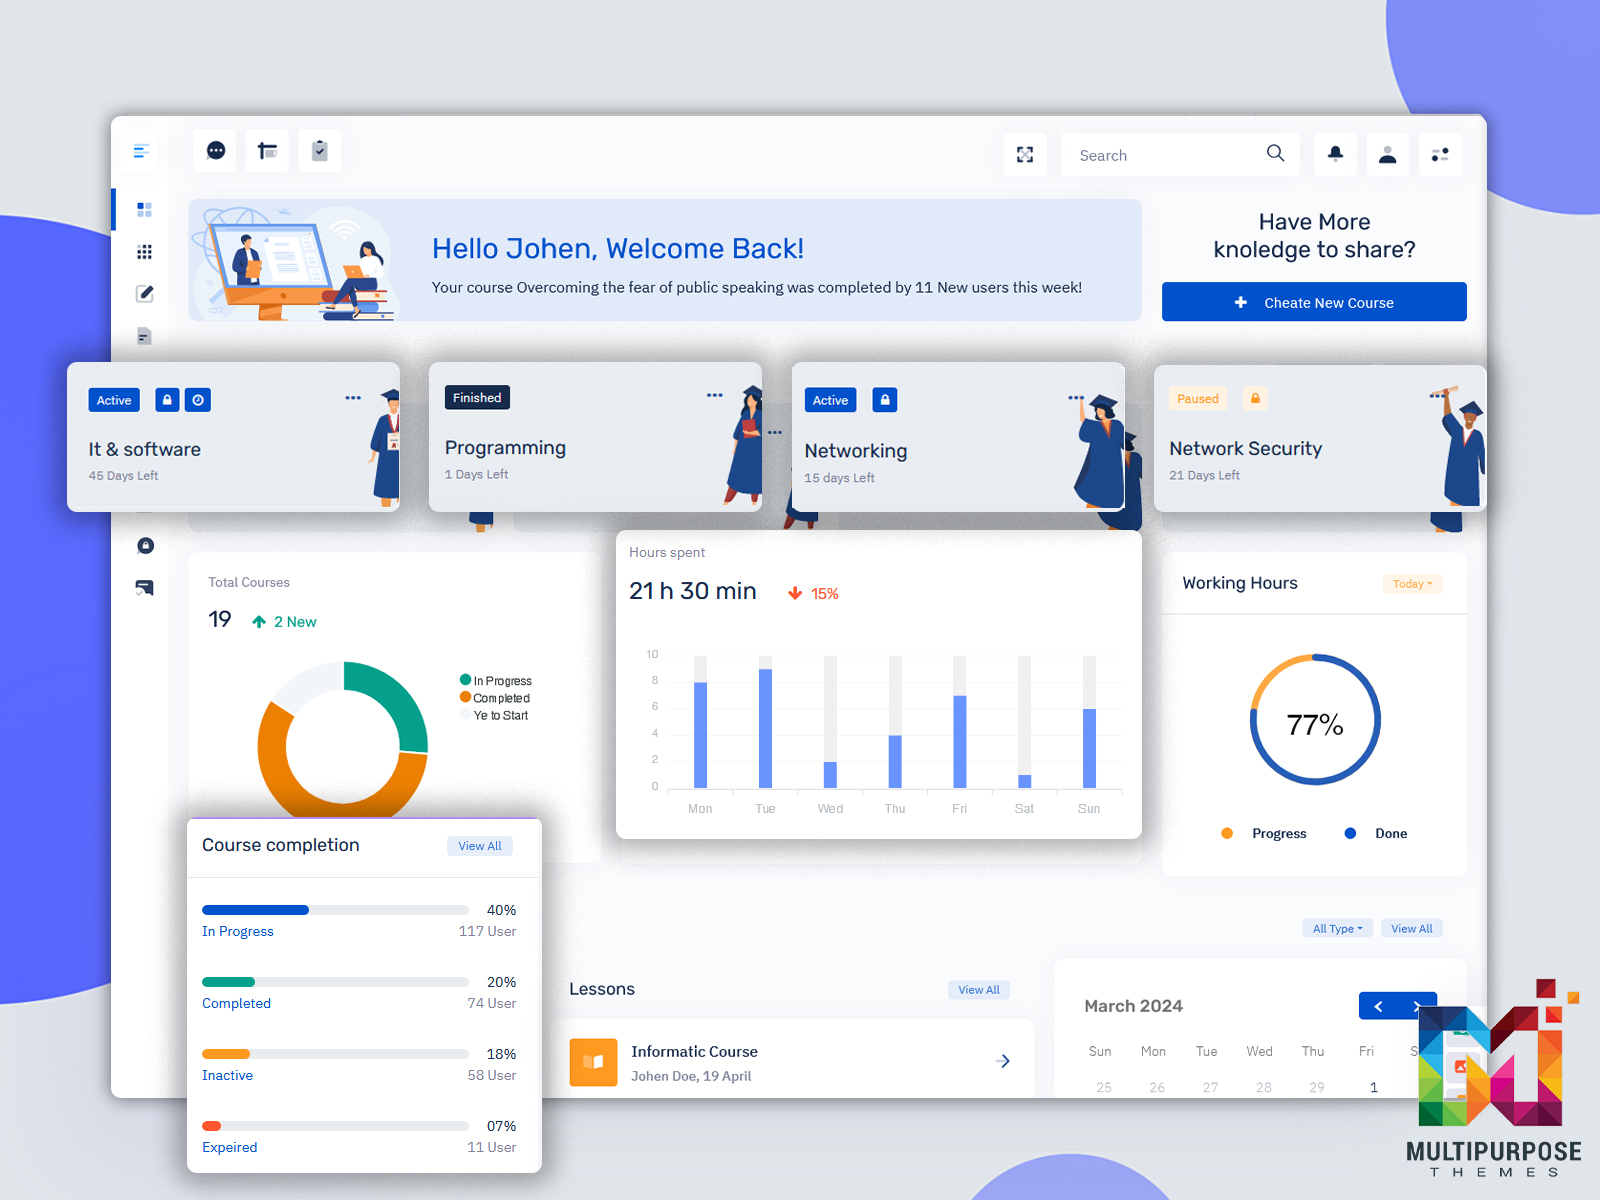
EduAdmin – LMS Dashboard
BUY NOW DEMO
EduLearn Admin – LMS Dashboard
BUY NOW DEMO
Gilded Admin – LMS Dashboard
BUY NOW DEMO
Tresto Admin – LMS Dashboard
BUY NOW DEMO
BsinX Admin – LMS Dashboard
BUY NOW DEMO
Key Features Your Dashboard Should Include
Not all dashboards are created equal. Some offer basic charts while others provide deep insights. Here’s what truly matters.
Student Progress Tracking
You need to see where each learner stands. Are they moving through content quickly? Do they watch videos but skip quizzes? This information helps you spot struggling students early.
Good tracking shows completion percentages, time spent on each lesson, and assessment scores. You can identify patterns across your entire student base. Perhaps everyone struggles with lesson five. That tells you something needs fixing.
Engagement Metrics
Active students succeed more often. Your LMS dashboard template should highlight engagement levels clearly. Look for metrics like login frequency, discussion participation, and resource downloads. Low engagement often predicts dropout. When you catch it early, you can reach out with support. Some dashboards use color coding. Green means highly engaged. Yellow signals moderate activity. Red flags students at risk. This visual approach helps you prioritize your attention.
Assessment Analytics
Tests and quizzes generate useful data. Your dashboard should break down this information meaningfully. Which questions do most students miss? Are certain topics consistently difficult? Do students improve on retakes? These insights let you refine your content and teaching approach. You might discover that multiple-choice questions work better than essays for certain topics. Or that students need more practice before assessments. The data guides your curriculum development.
Revenue and Enrollment Reports
If you sell courses, financial tracking matters. Your learning management system dashboard should show revenue trends, payment statuses, and refund rates. Enrollment patterns reveal seasonal trends. Maybe summer sees fewer signups while January brings a rush. Understanding these cycles helps with planning and marketing. You can also track which marketing channels bring the most students. This information optimizes your advertising spend.
How to Set Up Your Dashboard for Success
Getting started doesn’t have to be complicated. Most platforms offer pre-built templates you can customize. Begin by identifying your top priorities. What questions do you ask yourself daily? Those become your main dashboard widgets.
For example, you might check student completion rates every morning. Make that metric prominent. Place it at the top where you’ll see it immediately. Next, organize information logically. Group related metrics together. Put all engagement data in one section. Keep financial information separate. This structure makes scanning your dashboard faster.
Don’t overcrowd the screen. Too many numbers become overwhelming. Start with essential metrics, then add more as needed. You can always create secondary dashboards for detailed analysis.
Common Mistakes to Avoid
Many instructors make the same errors when setting up their dashboards. Learning from these mistakes saves time and frustration. The biggest mistake? Tracking too many metrics. You don’t need twenty different charts on one screen. Focus on what drives decisions.
Another error is ignoring the data. Your online course dashboard only helps if you use it. Set aside time weekly to review trends and take action. Some people also forget about mobile access. You won’t always sit at your desk. Choose a dashboard that works well on phones and tablets. Finally, don’t set it and forget it. Your needs change as your courses grow. Revisit your dashboard setup quarterly. Add new metrics when relevant, remove ones you never check.
Real-World Applications
Let’s look at how different instructors use their dashboards effectively.
Sarah teaches photography courses. She noticed her dashboard showing high dropout rates after lesson three. The data revealed that lesson was too technical too fast. She restructured the content, and completion rates jumped 25%.
Mark runs a coding bootcamp. His LMS dashboard template alerts him when students fall two lessons behind. He reaches out personally with encouragement and resources. This intervention increased his graduation rate significantly.
Lisa offers business courses to corporate clients. Her dashboard tracks team progress for each company. Managers love seeing their employees’ advancement. This transparency led to more corporate renewals.
Advanced Dashboard Features Worth Exploring
Once you master the basics, advanced features take your insights deeper. Predictive analytics can forecast which students might drop out. The system analyzes patterns like login frequency, quiz scores, and engagement levels. It then flags at-risk learners before they quit. Integration with other tools enhances functionality. Connect your email marketing platform to see how campaigns affect enrollments. Link your CRM to track student lifetime value.
Custom reports let you answer specific questions. Maybe you want to compare weekday versus weekend learners. Or analyze which time zones see the highest engagement. Custom reporting makes this possible. Automated alerts save monitoring time. Set up notifications for important events. Get pinged when someone completes a course or when enrollment hits a milestone.
Making Data-Driven Decisions
Your learning management system dashboard exists to inform better choices. Here’s how to extract maximum value. Review your dashboard consistently. Daily check-ins keep you connected to your courses. Weekly deep dives reveal trends. Monthly analyses guide strategic planning.
Compare periods to spot changes. How does this month compare to last month? What about year-over-year growth? These comparisons show whether you’re improving. Test changes and measure results. If you modify a lesson, watch how metrics shift. Your dashboard provides objective feedback on what works. Share insights with your team. If others help run your courses, give them dashboard access. Collaborative review sessions generate better solutions.
Final Words
A well-designed LMS dashboard transforms how you manage online learning. It turns raw data into actionable insights. You spend less time hunting for information and more time improving your courses. Start simple with core metrics. Expand gradually as you identify new needs. Most importantly, use the data to make your courses better. Your students deserve the best learning experience possible. Your dashboard helps you deliver exactly that.
Also, check out our Job Board Dashboard — a smart tool for managing jobs and applicants.
Joblly Admin – Job Board Dashboards
Dashboard: 1
BUY NOW DEMO
Dashboard: 2
BUY NOW DEMO
Related Posts


This Post Has 0 Comments