
In today’s digital world, every business depends on powerful web applications to manage operations, users,…
The Benefits of Sharing Your Dashboard Template with the Team
Reading Time: 8 minutes
Access to real-time data has become essential for businesses to stay competitive. A Dashboard Template helps teams monitor progress, assess performance, and make informed decisions. Sharing this dashboard with your team, however, can bring even more benefits. In this post, we’ll explore the advantages of sharing your Dashboard Template with your team and how it can enhance decision-making, improve transparency, and boost overall performance.
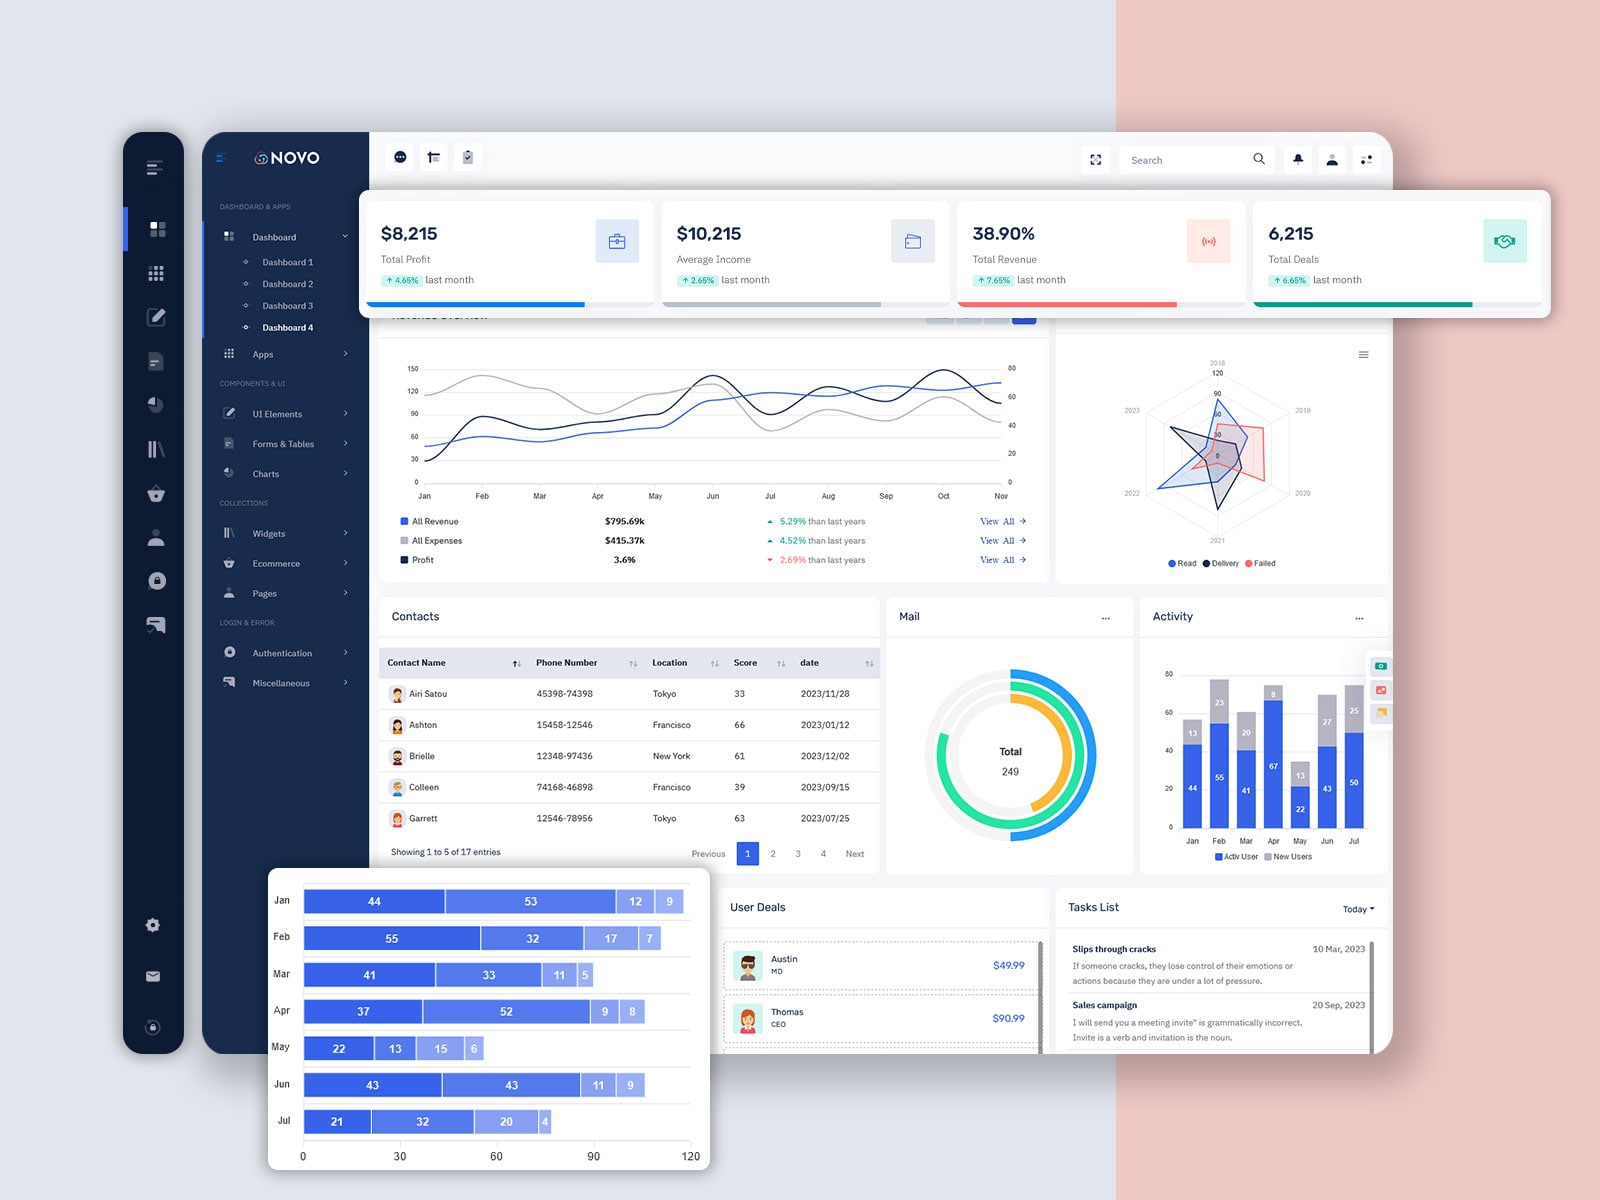
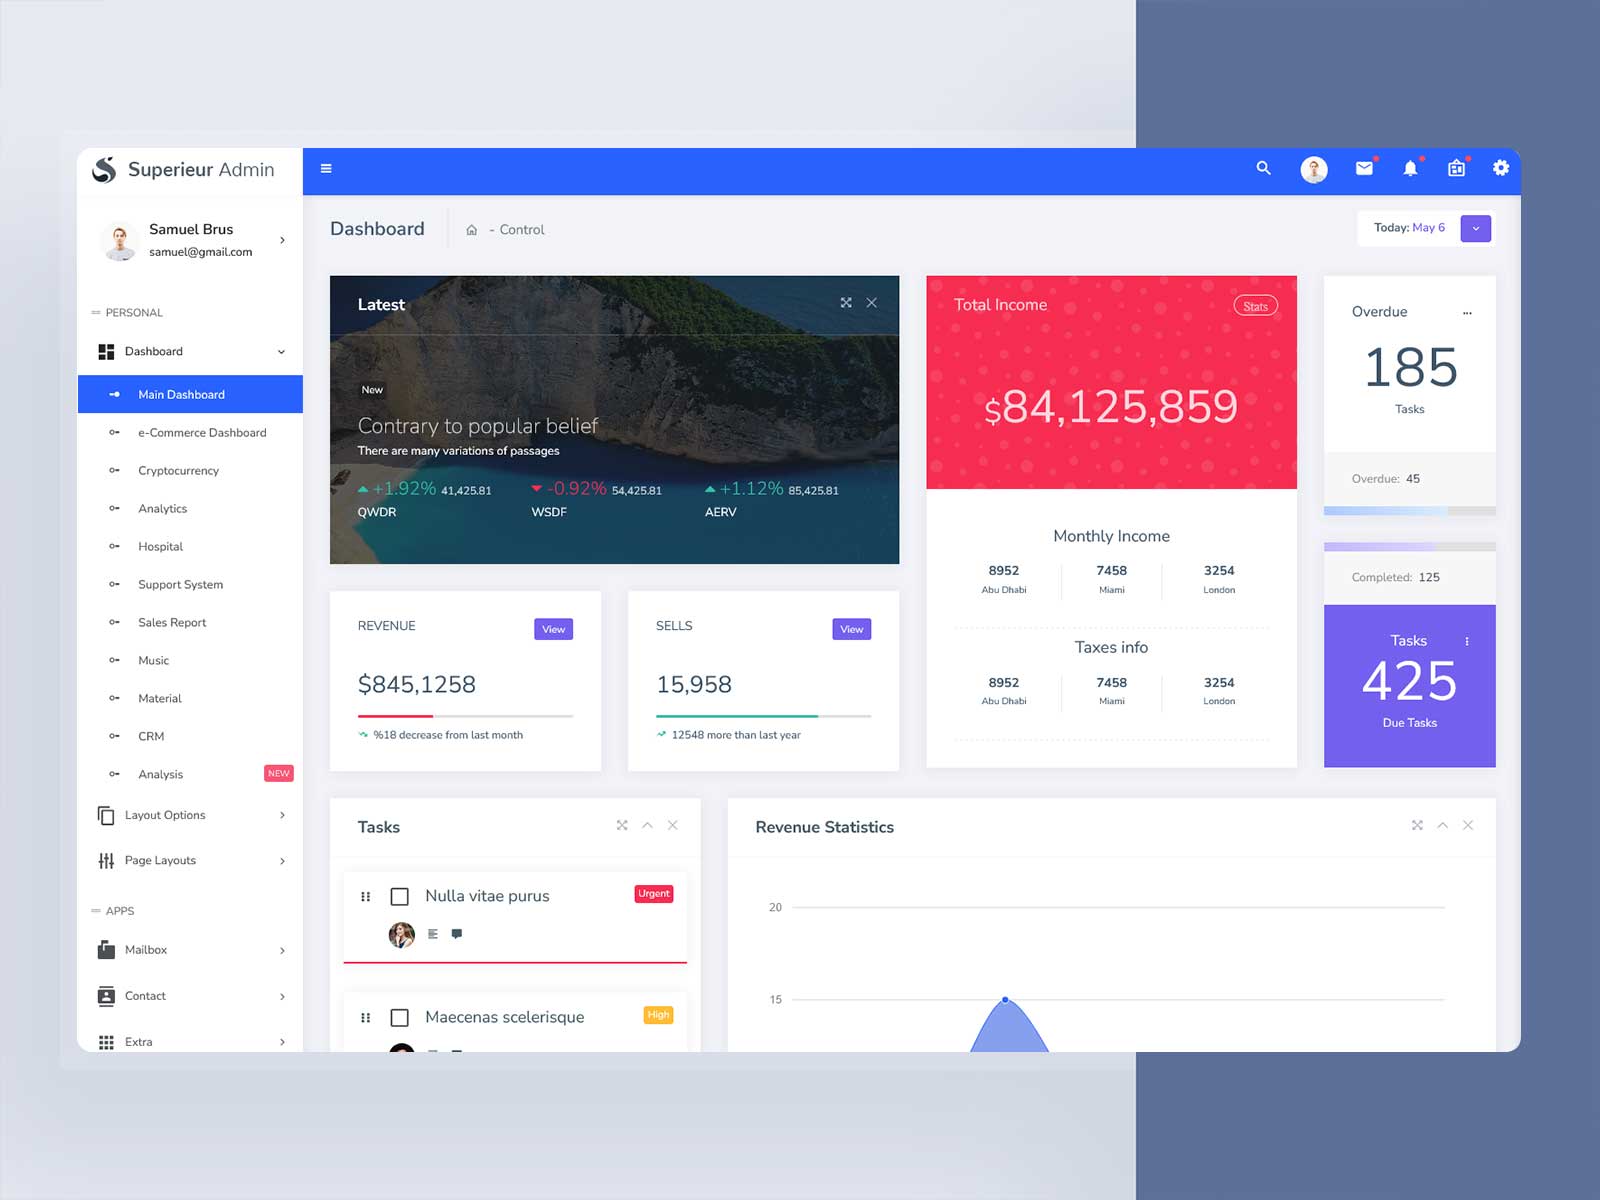
Light Dashboard of Novo Admin

MORE INFO / BUY NOW DEMO

MORE INFO / BUY NOW DEMO

MORE INFO / BUY NOW DEMO

MORE INFO / BUY NOW DEMO
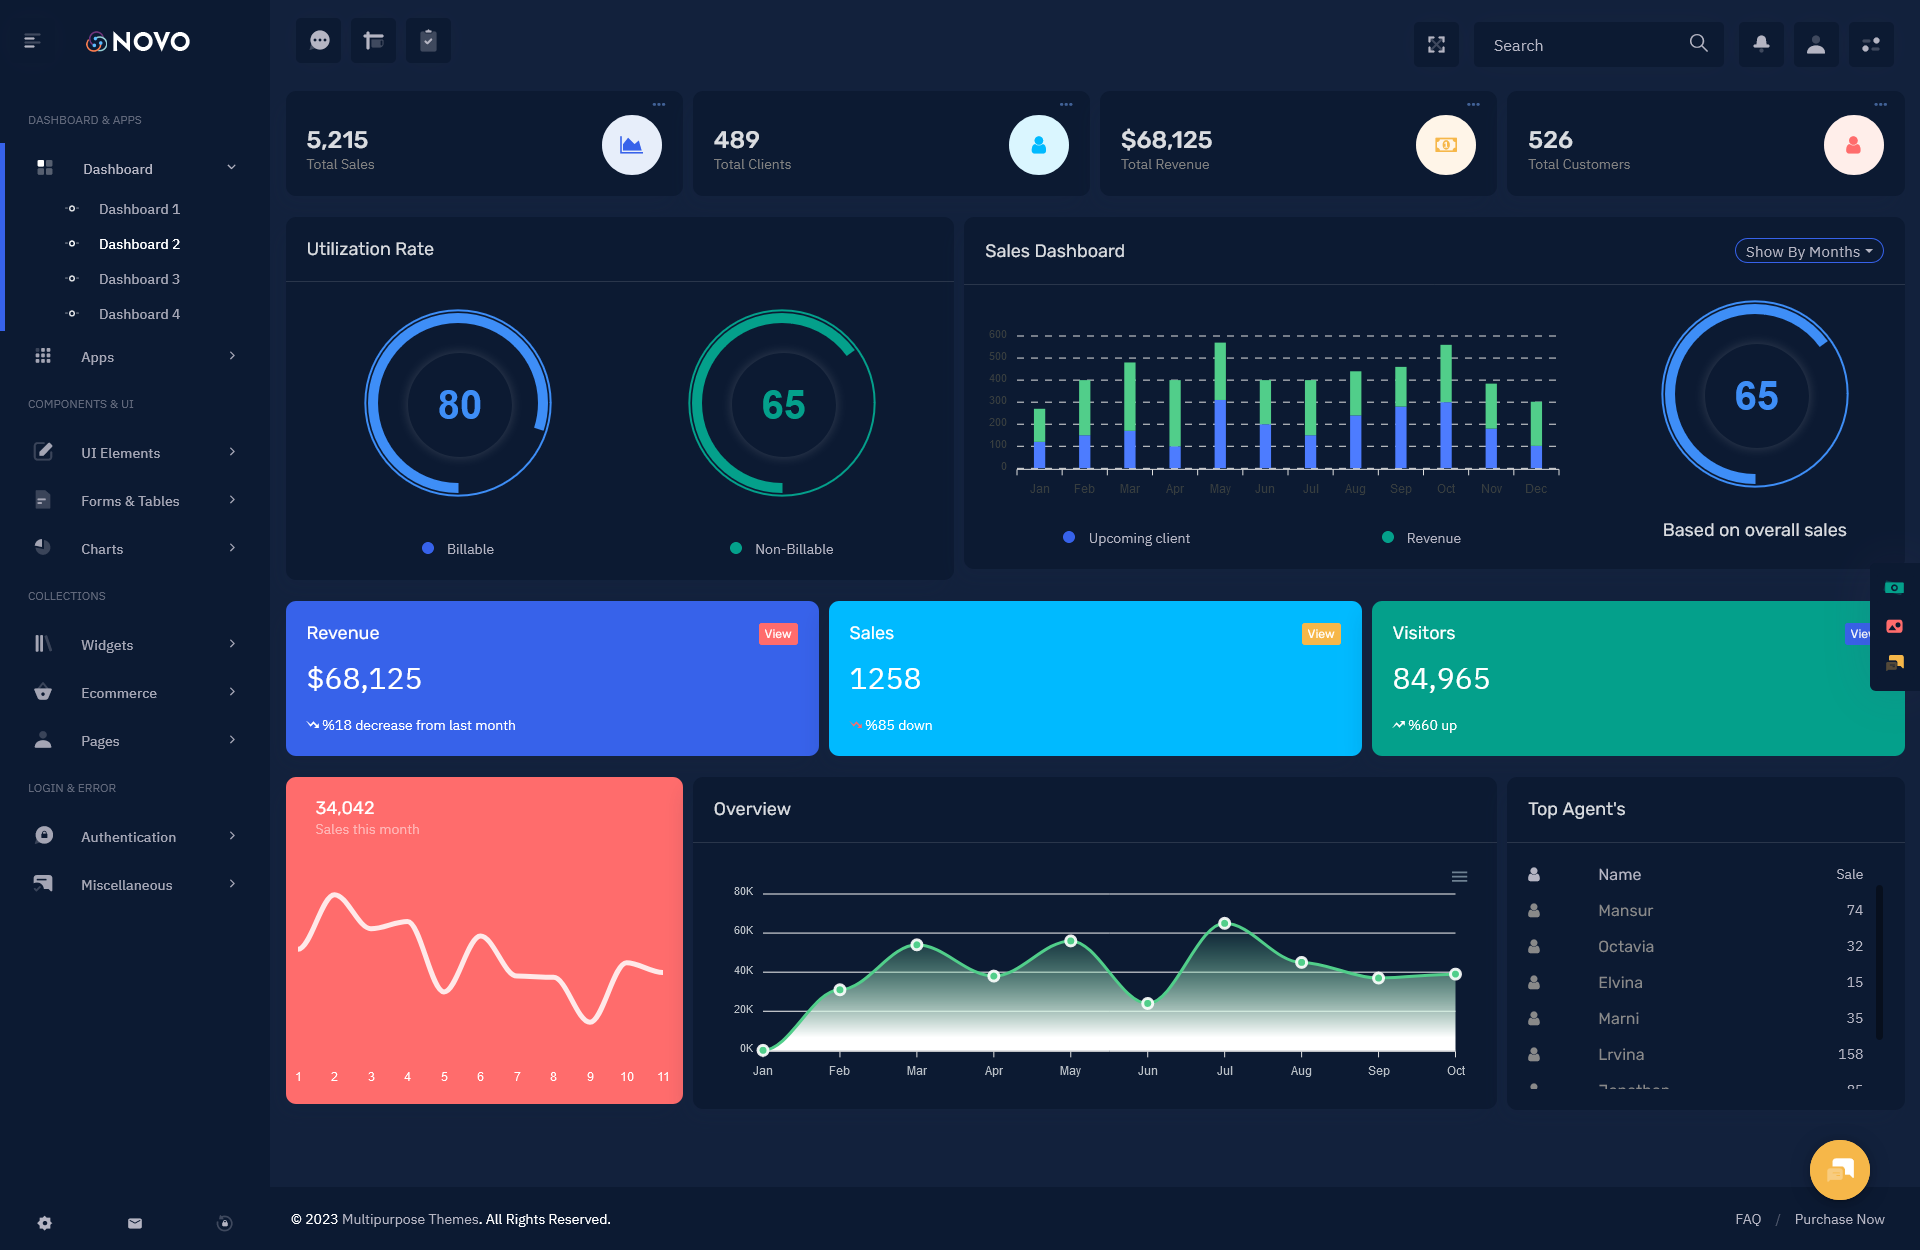
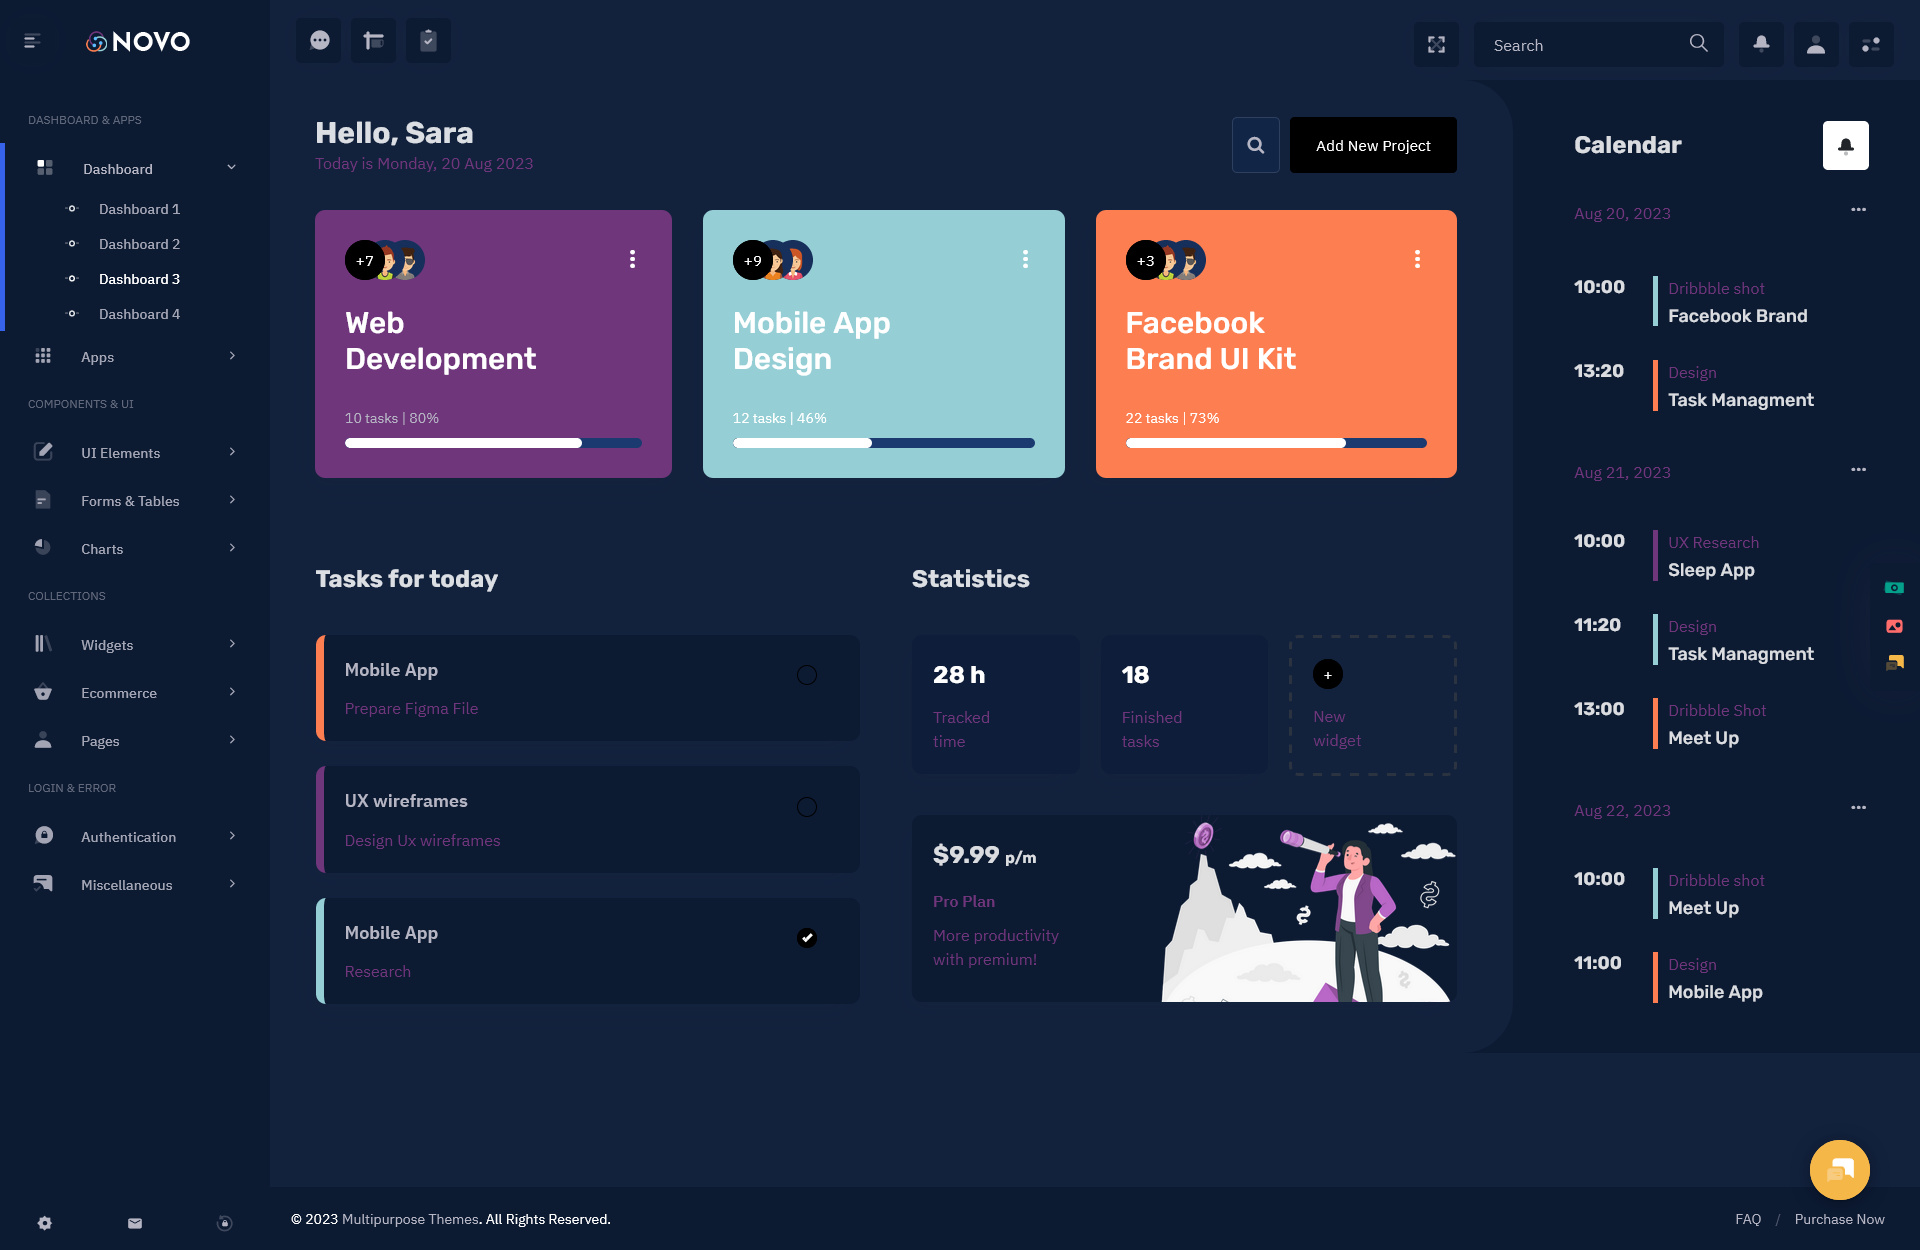
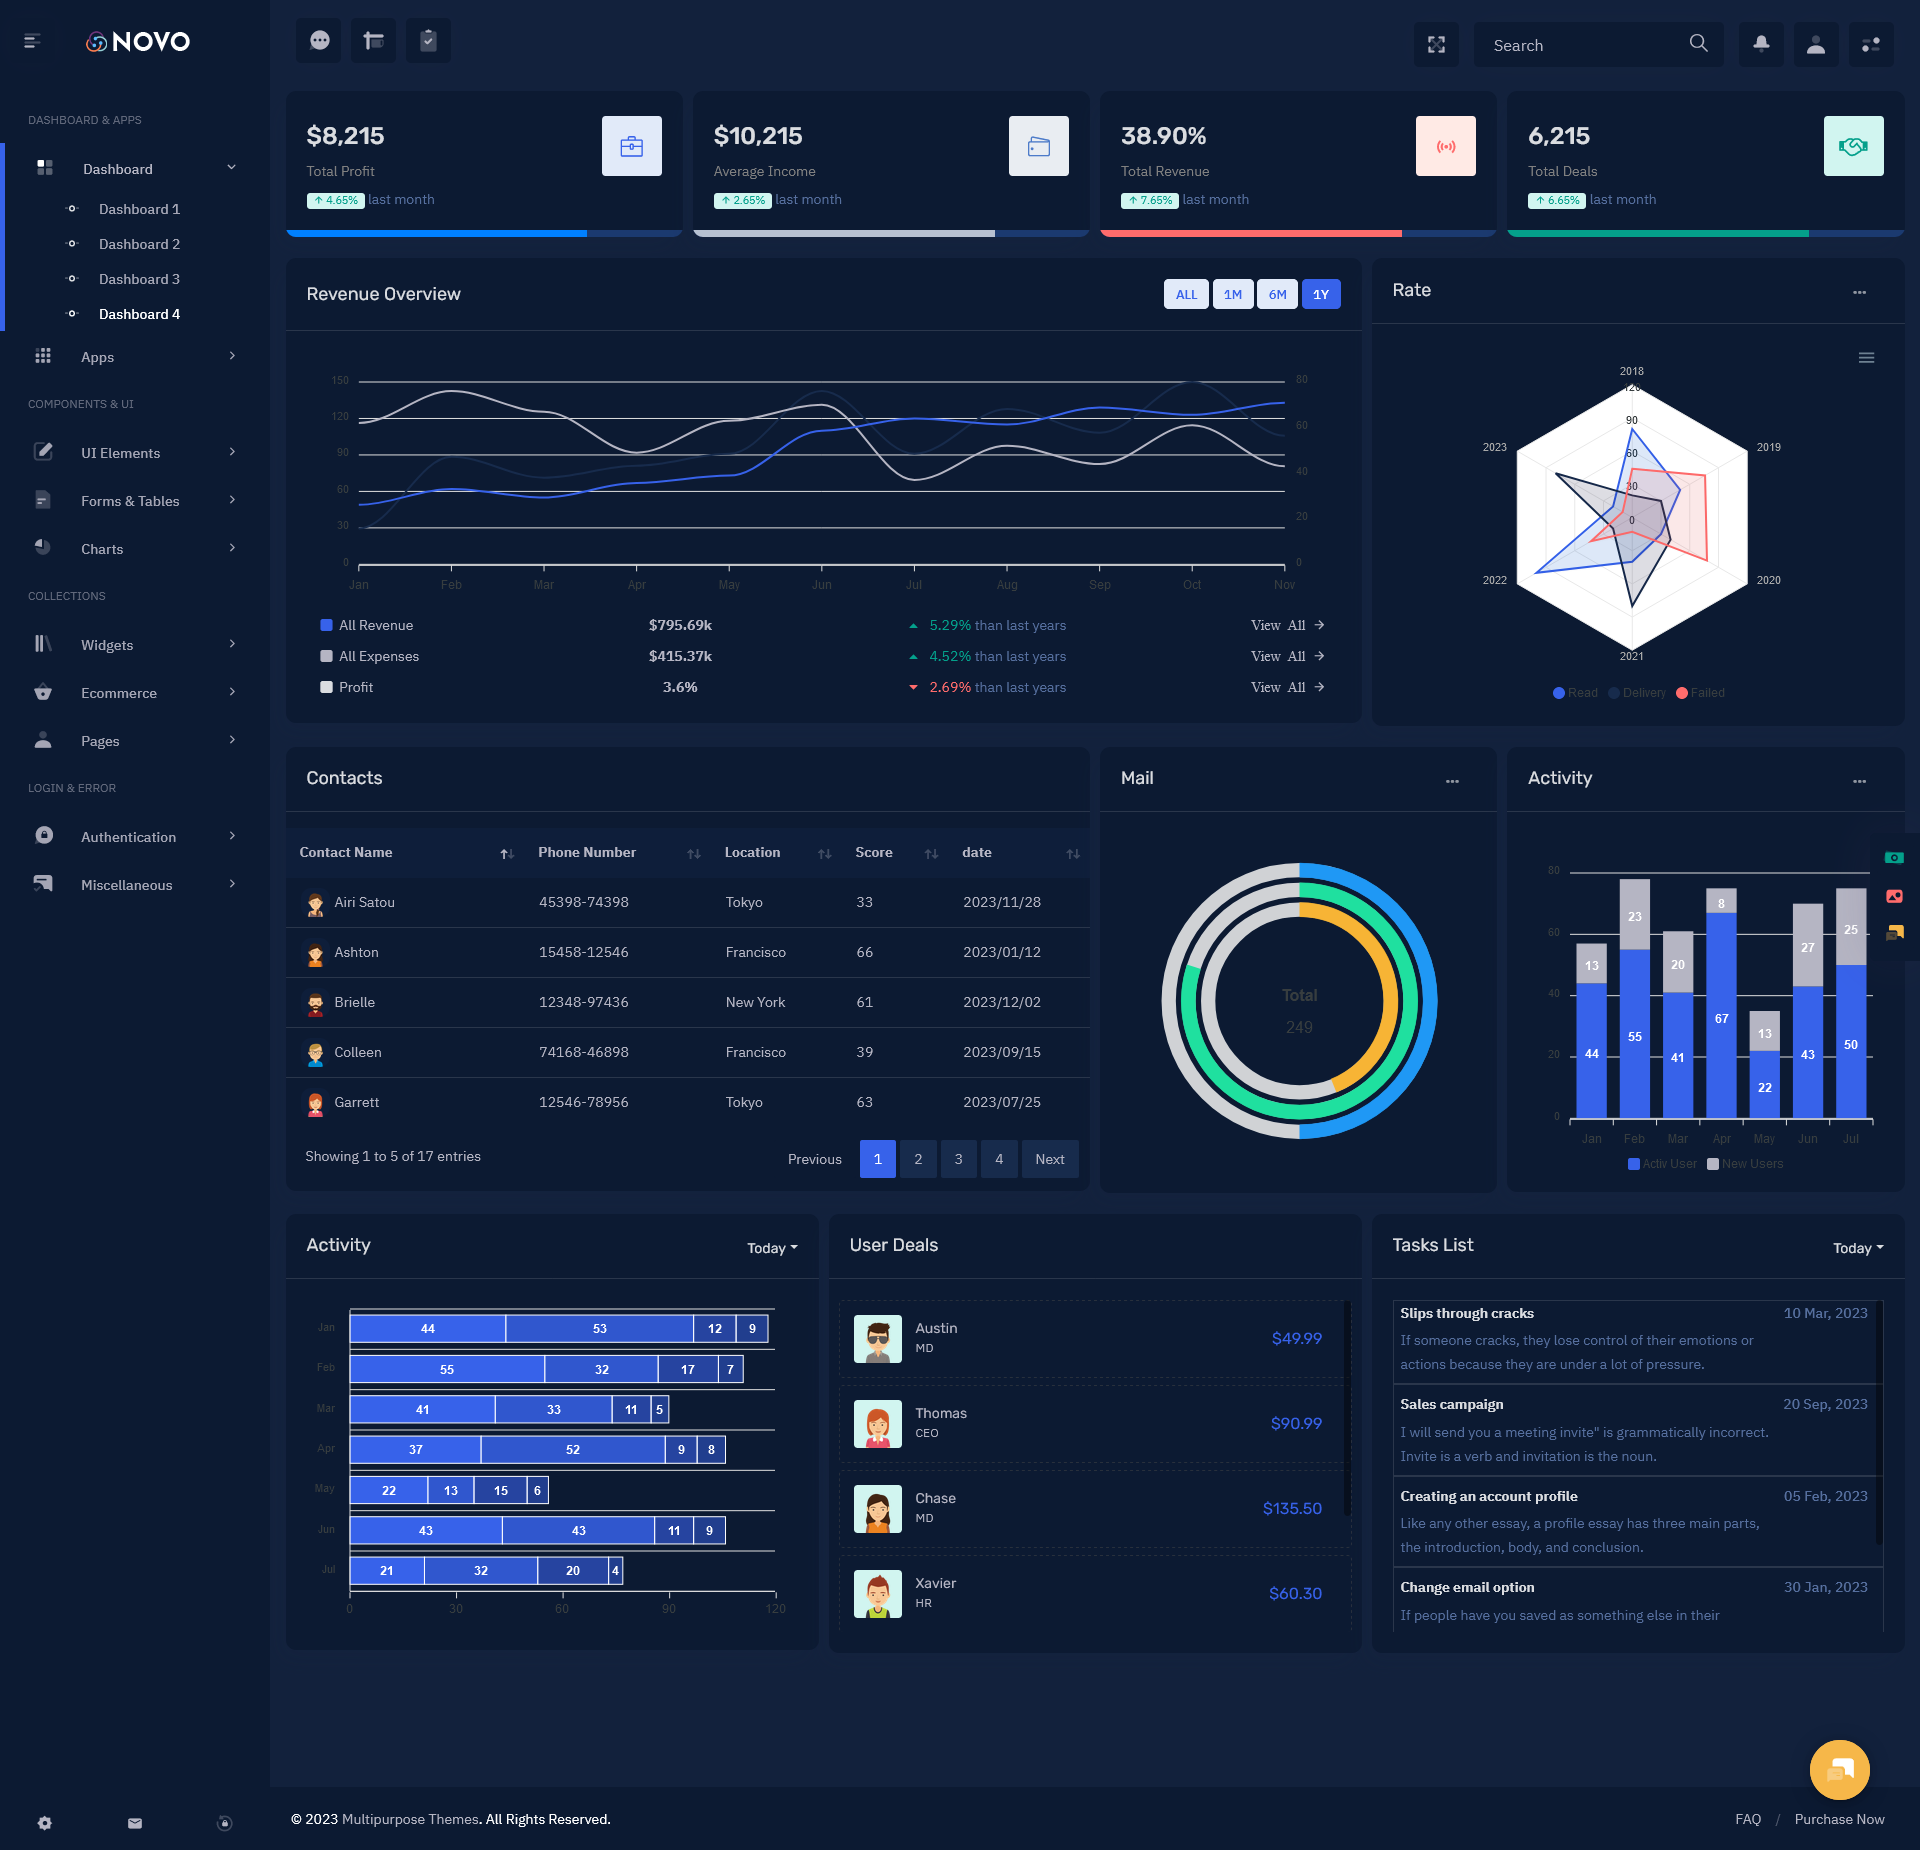
Dark Dashboard of Novo Admin

MORE INFO / BUY NOW DEMO
MORE INFO / BUY NOW DEMO
MORE INFO / BUY NOW DEMO
MORE INFO / BUY NOW DEMO
1. Improved Transparency and Collaboration
One of the primary benefits of sharing your Dashboard Template with the team is the transparency it brings. When everyone has access to the same data, team members can understand how their individual efforts contribute to the overall success of the company. This level of transparency fosters a collaborative work environment, where employees can openly discuss performance, identify challenges, and share insights on how to improve.
For example, the Dashboard Template typically displays important metrics such as Total Sales, Total Revenue, and Sales This Month. By having access to this data, the team can immediately identify areas that are performing well and those that need attention. They can collaborate on strategies to improve sales performance and support each other in achieving business goals.
2. Real-Time Access to Key Metrics
A Dashboard Template like the Bootstrap 5 Admin Template provides real-time access to essential sales metrics. With metrics such as Total Clients, Total Customers, Top Agents, and Utilization Rate, sharing the dashboard with your team allows them to keep track of how the business is performing day by day, hour by hour. This means there’s no delay in getting the information needed to make decisions. Real-time data enables quick reactions to emerging opportunities or challenges.
For example, if Top Agents are performing well, the team can recognize who is driving success and potentially learn from their strategies. Conversely, if Spending Income is higher than expected, the team can quickly identify the cause and find ways to reduce unnecessary expenses before they affect the bottom line.
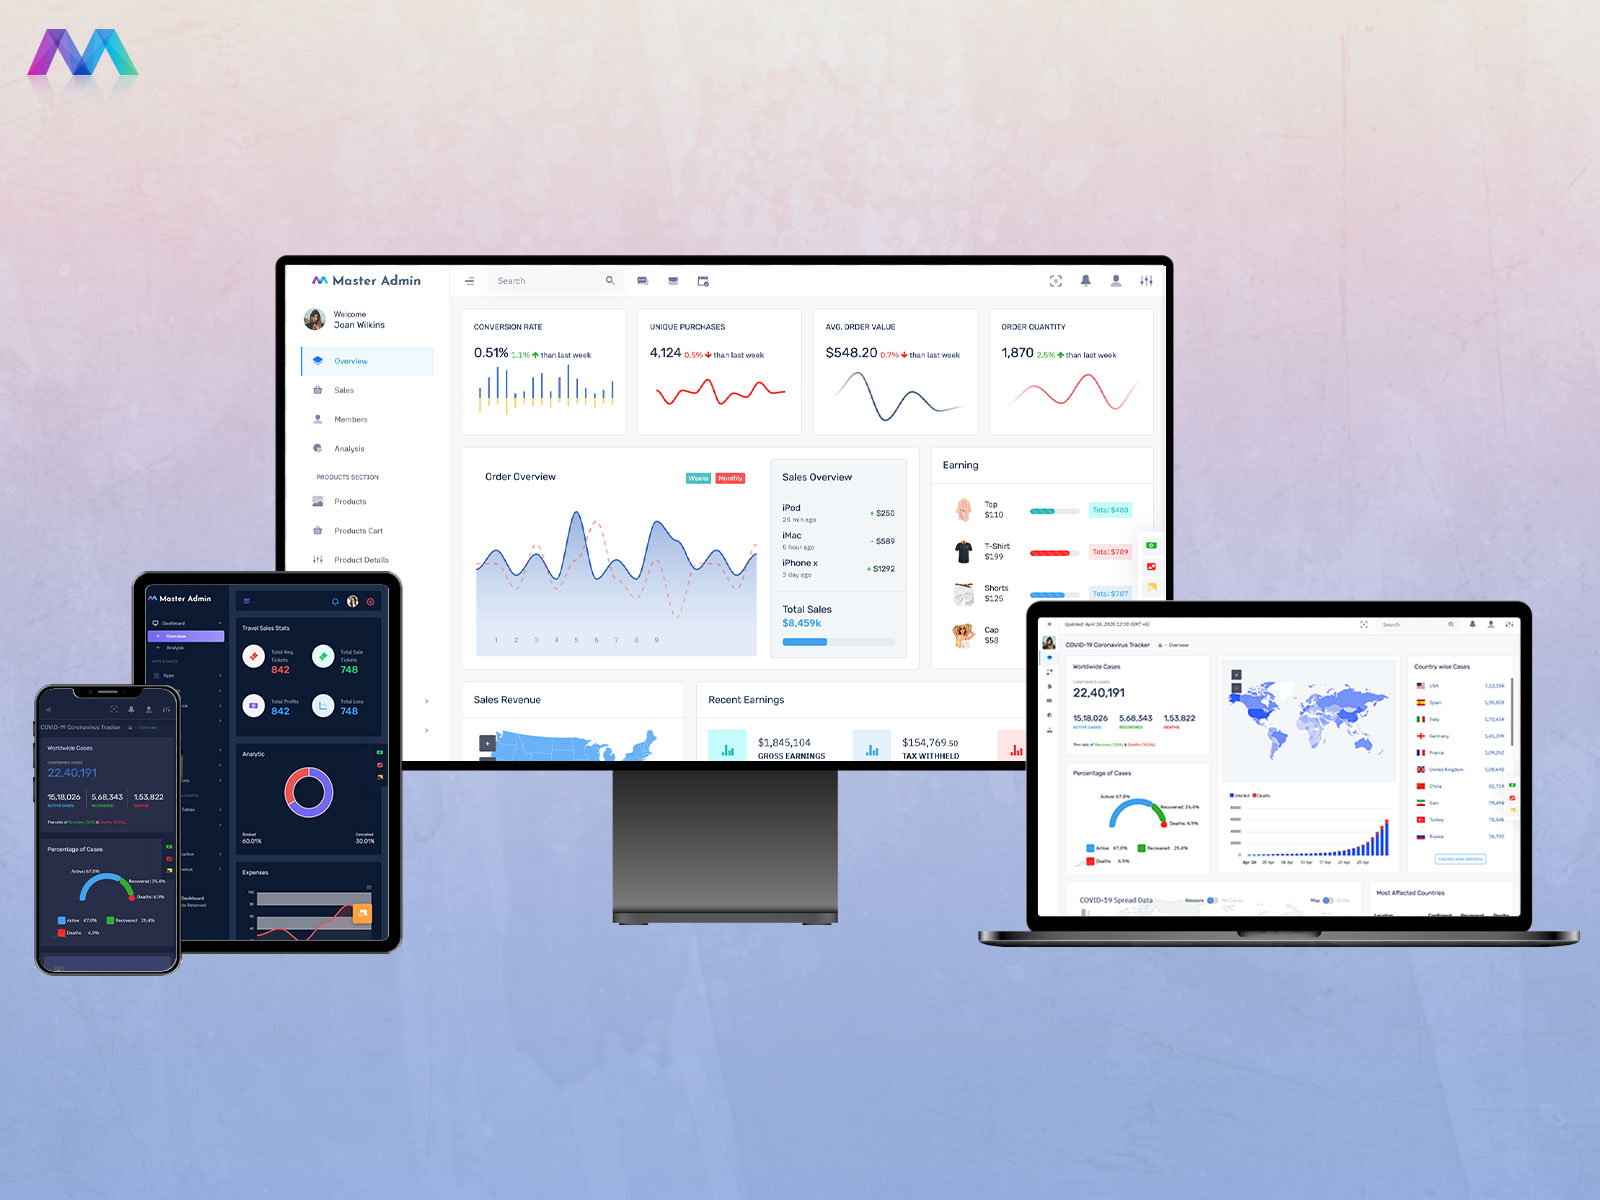
By using a Master Dashboard or Admin Dashboard UI that consolidates these metrics into one place, teams can view the bigger picture and stay informed about all aspects of sales performance, rather than working in isolation.
3. Empowerment and Ownership
Sharing the Dashboard Template with the team helps empower them by giving them ownership of the data. It’s no longer just the responsibility of managers or leadership to analyze and interpret the data. Instead, every team member has a stake in the sales performance, which can lead to higher engagement and motivation.
For example, when Sales This Month are underperforming, the entire sales team can see it in real-time and understand their role in improving it. Whether it’s closing more deals, targeting new clients, or increasing conversion rates, team members can actively work to improve their individual performance in line with company goals. This sense of responsibility and ownership over their contributions can lead to a more engaged and motivated team.
4. Better Decision-Making
The use of a Dashboard UI that offers a clear, organized layout with access to detailed metrics is invaluable for better decision-making. Admin Templates like the Bootstrap Admin Panel give you the ability to track various aspects of your sales performance, from Total Income and Total Revenue to History and Spending Income. Having all this information in one place allows managers and team members to make informed decisions based on current performance data.
For instance, if the Utilization Rate of your sales team is low, management can make adjustments such as reallocating resources, offering additional training, or adjusting sales quotas to improve overall team performance. The ability to make real-time decisions based on accurate data helps businesses stay competitive and responsive to market changes.
5. Increased Motivation and Accountability
When sales team members can see how their performance stacks up against others, it fosters healthy competition and motivation. The Dashboard Template allows team members to track their progress in real-time, seeing their Total Sales, Total Clients, and other important metrics. This visibility into performance encourages everyone to do their best.
For example, when team members see their rankings on the Top Agent list, they are motivated to push harder to achieve better results. This sense of competition can help boost productivity and morale. Additionally, Spending Income or underperformance in specific areas can also be addressed with more accountability, as everyone can clearly see the data.
6. Faster Problem-Solving
When the entire team has access to the same sales data, it becomes much easier to identify and resolve issues quickly. Whether it’s a drop in Total Revenue, a decrease in Total Customers, or a sudden spike in Spending Income, having all the relevant data available for everyone to view means that problems can be addressed before they escalate.
For example, if History shows that sales are consistently low during certain months, the team can quickly analyze the data and identify why this might be the case—whether it’s seasonality, marketing strategy, or client preferences. Once the problem is identified, the team can brainstorm solutions and implement corrective measures quickly, avoiding further losses.
7. Streamlined Reporting
Sharing the Dashboard Template reduces the need for time-consuming reporting. Instead of creating individual reports for each team member or department, everyone can simply access the Admin Template and view the data directly. The Bootstrap 5 Dashboard Template allows for real-time updates, so the information is always current.
Additionally, this helps reduce the risk of errors or misinterpretation of data, as the dashboard offers a single source of truth. Team members no longer need to wait for the latest updates or pull reports manually. With the UI Dashboard, everyone can access the data they need, when they need it.
8. Improved Forecasting and Planning
One of the key advantages of sharing your Dashboard Template is that it helps with forecasting and strategic planning. By reviewing metrics like Total Sales, Total Clients, Total Customers, and Sales This Month, your team can predict future performance and trends. Understanding where your business stands in real-time enables you to make more accurate predictions and adjust strategies accordingly.
For example, if History shows a steady increase in sales over the past few months, you can confidently predict continued growth and plan accordingly. Similarly, if Total Revenue has dipped or Total Sales are lagging, adjustments can be made in real-time to ensure goals are still met by the end of the quarter.
9. Data-Driven Culture
Sharing the Dashboard Template helps cultivate a data-driven culture within the team. When everyone has access to the data and can interpret it, they are more likely to make decisions based on facts rather than gut feelings. With tools like the Admin Dashboard UI, you empower your team to make decisions based on real-time performance data.
The Bootstrap Admin Panel and Bootstrap Admin Theme ensure that the data is presented in an easy-to-understand format, making it accessible to all members, regardless of their technical expertise. As a result, employees at all levels can engage with the data, offering insights, suggestions, and improvements.
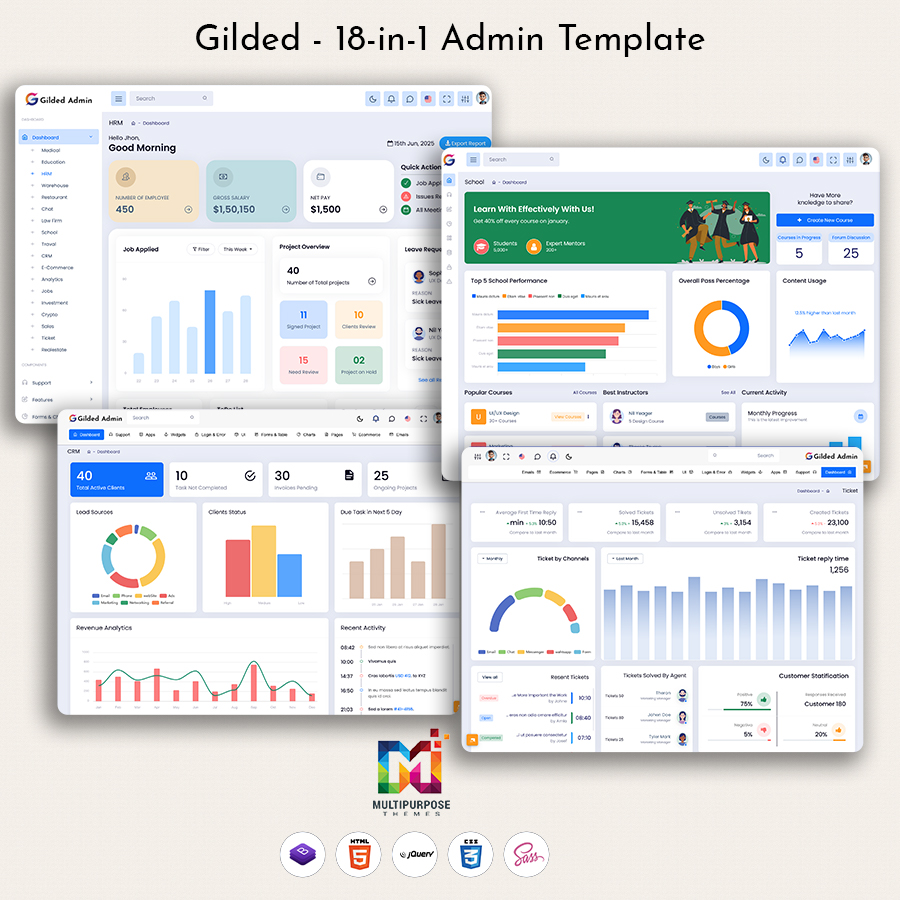
When you integrate various specialized dashboards like Sales Dashboard, CRM Dashboard, Chatbot Dashboard, and others into a single template, the power of data is magnified. By sharing these dashboards, teams from different departments can work with a unified approach and access real-time data across the entire organization.
Sales Dashboard
The Sales Dashboard provides key metrics such as total sales, total revenue, and sales performance. Sharing this data with your sales team empowers them to understand their individual and team performance at a glance. They can make decisions on the spot to improve their numbers, optimize their strategies, and hit their targets. The data in this dashboard also helps managers identify the top-performing agents, analyze trends, and forecast future sales.
CRM Dashboard
A CRM Dashboard gives teams insights into customer data, engagement levels, and overall satisfaction. Sharing this with your customer service and sales teams helps improve communication with clients, identify leads that need attention, and ensure the best customer experience. The real-time data provided can also help identify issues quickly, which leads to faster resolutions and stronger customer relationships.
Chatbot Dashboard
For teams utilizing chatbots for customer support, the Chatbot Dashboard shows key metrics like response times, conversation volume, and customer satisfaction. Sharing this Desktop Chatbot UI Design ensures the support team stays informed about customer interactions and can adjust the chatbot responses or reach out to customers when needed.
LMS Dashboard
An LMS Dashboard is vital for tracking employee training and development. By sharing this with HR and management teams, you can monitor progress, track completion rates, and assess the effectiveness of training programs, allowing you to make data-driven decisions about employee growth.
HRM Dashboard
The HRM Dashboard shows critical employee metrics such as turnover rates, attendance, and performance. Sharing this data with HR teams helps streamline recruitment, retention strategies, and overall workforce management.
Analytical Dashboard
An Analytical Dashboard brings together data from multiple departments—marketing, sales, finance, and more. Sharing this dashboard gives managers and leadership teams a holistic view of business performance, enabling better decision-making based on data trends and analysis.
VoiceX Dashboard
For businesses using VoiceX or voice data analytics, this dashboard tracks call volumes, voice quality, and customer interactions. Sharing this with the team helps improve customer communication, identify problem areas in call management, and maintain high-quality standards.
Warehouse Dashboard
A Warehouse Dashboard allows teams to monitor stock levels, shipping, and inventory turnover. By sharing this data, warehouse teams can optimize storage and distribution, ensuring efficient operations and reducing delays.
EV Dashboard
With a focus on electric vehicle performance, an EV Dashboard tracks key metrics like energy consumption, vehicle health, and driving behavior. Sharing this data allows teams to make adjustments to optimize fleet operations, reducing costs and improving sustainability efforts.
Solar Dashboard
For businesses focused on sustainability, a Solar Dashboard provides real-time data on energy production, usage, and savings. Sharing this dashboard with teams involved in energy management helps monitor efficiency and identify opportunities for reducing energy costs.
By integrating and sharing these dashboards, teams across the business gain access to critical data that helps them make more informed decisions. This transparency ensures everyone is aligned with the same goals, helping businesses achieve better results and improve efficiency. Each specialized dashboard, from Sales to EV or Solar, provides a unique set of insights, and when combined, they create a comprehensive view of the business performance. Sharing this data across departments fosters collaboration, drives accountability, and ultimately leads to better outcomes for the organization.
Conclusion
Sharing your Dashboard Template with the team offers numerous benefits, from improved collaboration and transparency to more informed decision-making and faster problem-solving. By giving everyone access to key metrics like Total Sales, Total Revenue, Total Clients, and Top Agents, you empower your team to make data-driven decisions, monitor performance in real-time, and continuously improve.
A Dashboard Template like the Bootstrap 5 Admin Template brings all these metrics into one place, providing an easy-to-use and customizable solution for teams across industries. By using Admin Templates with powerful features like Dashboard Template, Utilization Rate, and detailed historical data, you ensure that everyone in your organization is on the same page, working toward the same goals.
As you continue to leverage Admin Dashboard UI tools and UI Dashboards, remember that the true power lies in how you share and use the data. By creating a culture of transparency, accountability, and collaboration, you can drive your team’s performance and lead your business to greater success.
Buy Now and Get Started Today!
Click below to purchase and start unlocking the full potential of your business!
BUY NOW
Related Posts


This Post Has 0 Comments