
Managing a solar energy system becomes more challenging when users need to track generation, consumption,…
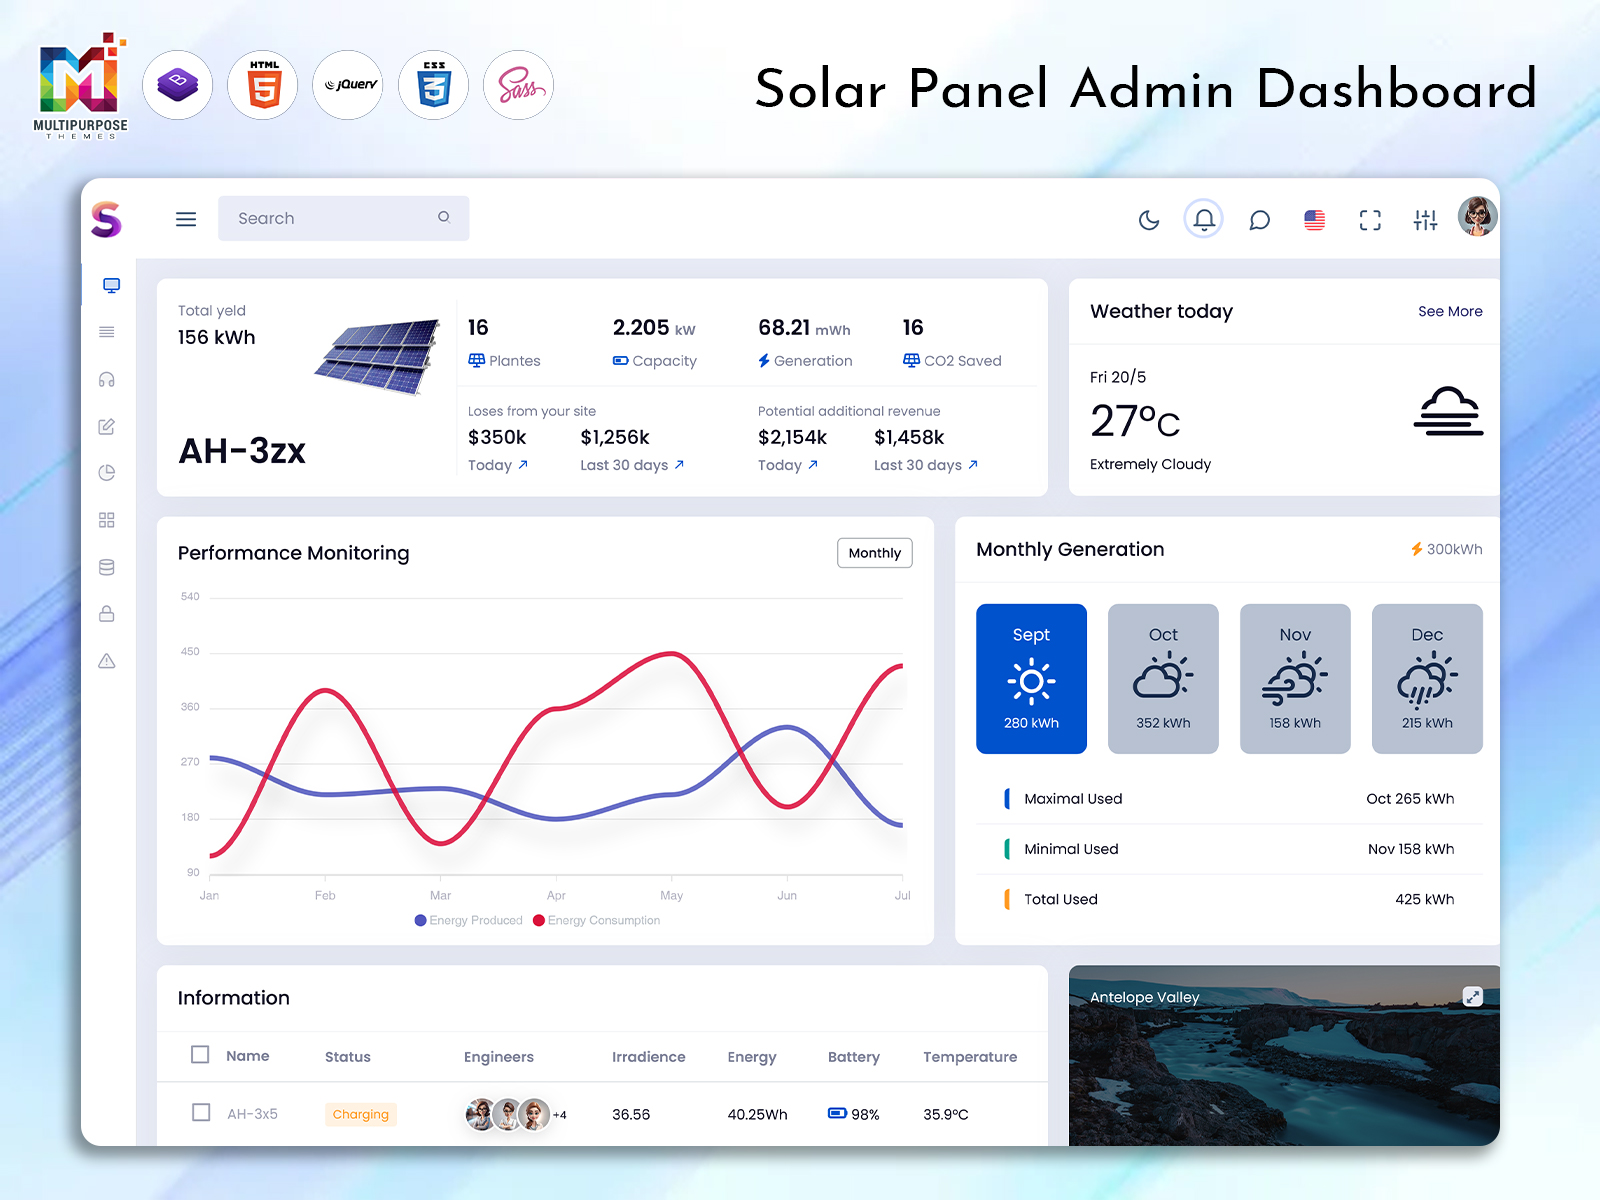
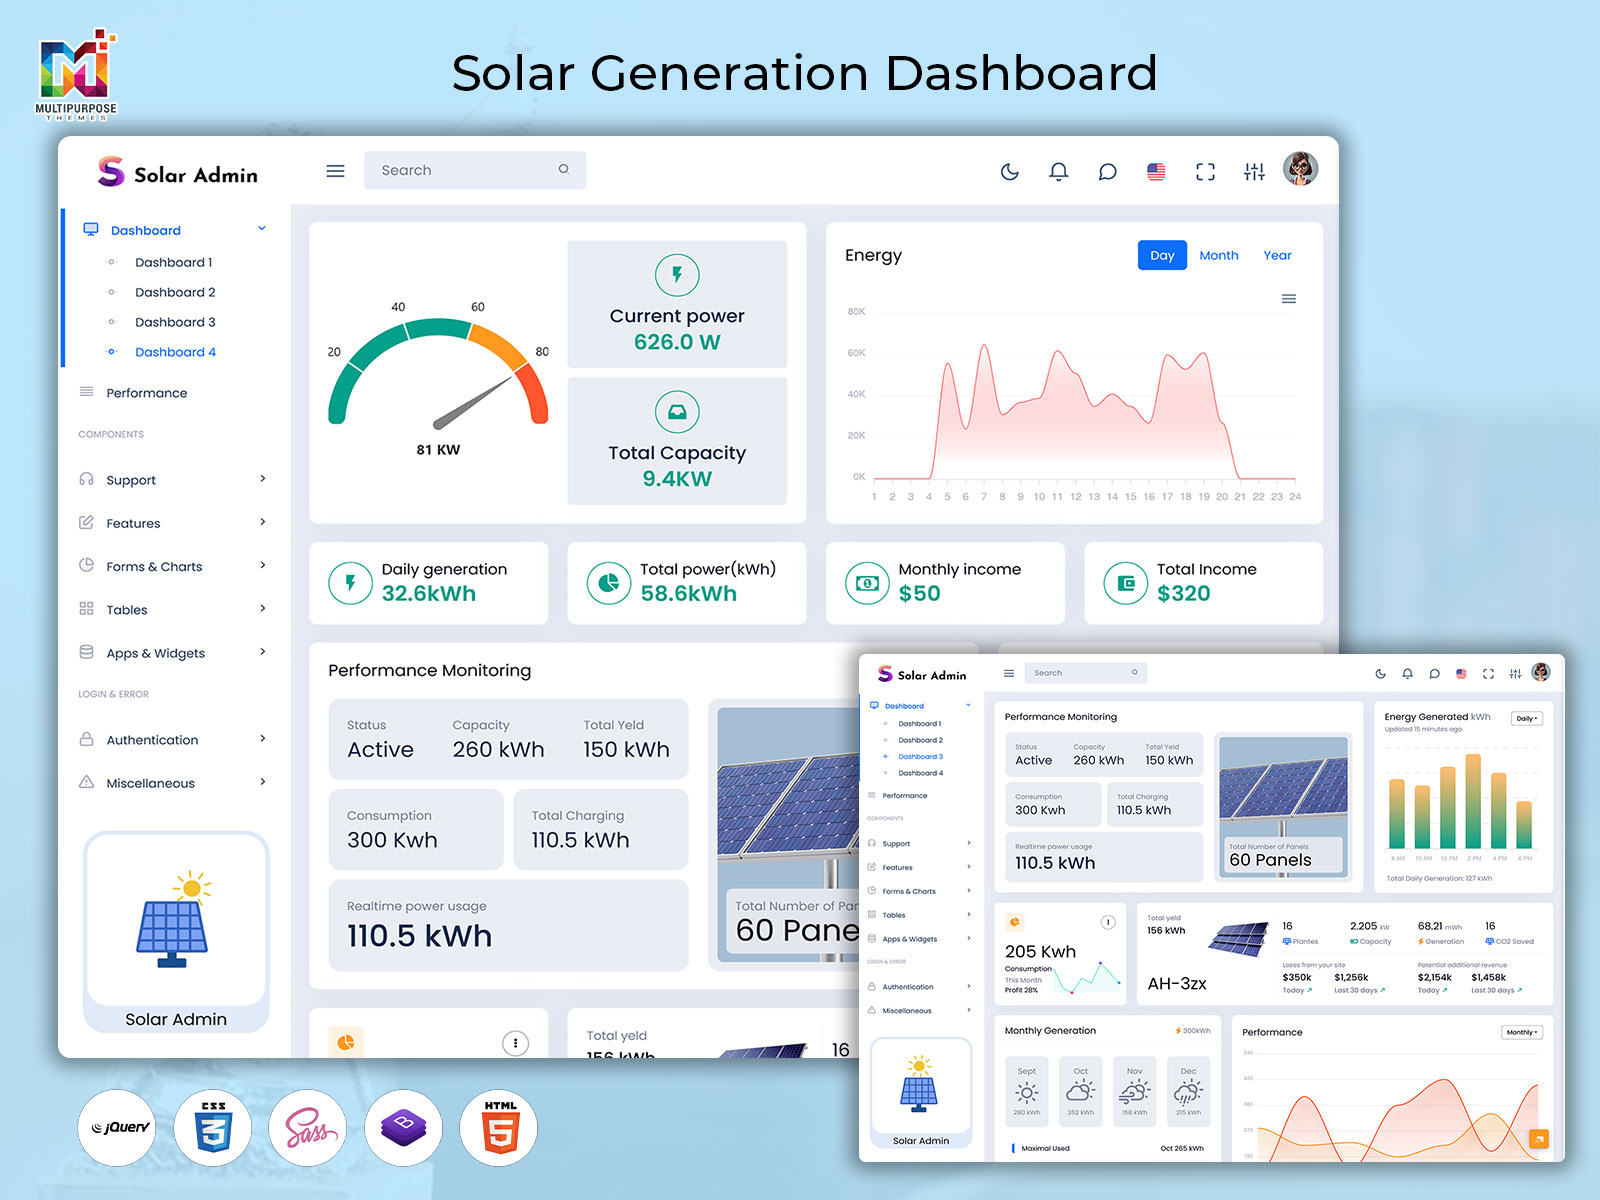
Solar Generation Dashboards Live Solar Panel Performance and Energy Tracking 2026
Reading Time: 9 minutes
The demand for intelligent energy monitoring has rapidly increased with the growth of renewable power systems. Modern industries and households now rely on Solar Generation Dashboards to understand how efficiently their Solar Power System is performing in real time. Solar Generation Dashboards help convert complex energy data into simple insights, allowing users to monitor production, consumption, and system health without technical difficulty. A Solar Dashboard plays a key role in improving visibility and control over daily energy operations.
Watch Full Video
With the help of Solar Modern Dashboards and Solar System Dashboard solutions, users can track Solar Panel Performance, analyze consumption trends, and optimize overall efficiency. Whether accessed through a Solar Web Dashboard or Solar Monitoring Mobile App, these systems provide continuous updates on energy flow. In Solar Commercial PV System environments, Solar Designing Software and Solar System Monitoring App tools further enhance planning, tracking, and decision-making for better long-term energy management.
Challenges Companies Face Without Solar Generation Dashboards
1. Difficulty in Tracking System Performance
Without a dedicated Solar Generation Dashboard, companies often struggle to understand how their Solar Power System is performing on a daily basis. Important metrics such as energy generation, battery status, and equipment efficiency remain scattered across multiple sources, making performance evaluation difficult and time-consuming.
2. Higher Operational and Maintenance Costs
When solar systems are monitored manually, faults and performance declines may go unnoticed for extended periods. This can increase maintenance expenses, reduce equipment lifespan, and create unexpected operational disruptions that impact overall business productivity and energy efficiency.
3. Lack of Data-Driven Energy Planning
Organizations without a Solar Dashboard often lack accurate historical and real-time data needed for strategic energy planning. Without clear insights into consumption trends, storage utilization, and grid dependency, businesses may face inefficient resource allocation and reduced returns from their solar investments.
VIEW DEMO BUY NOW
How Solar Generation Dashboards Solve Energy Monitoring Challenges
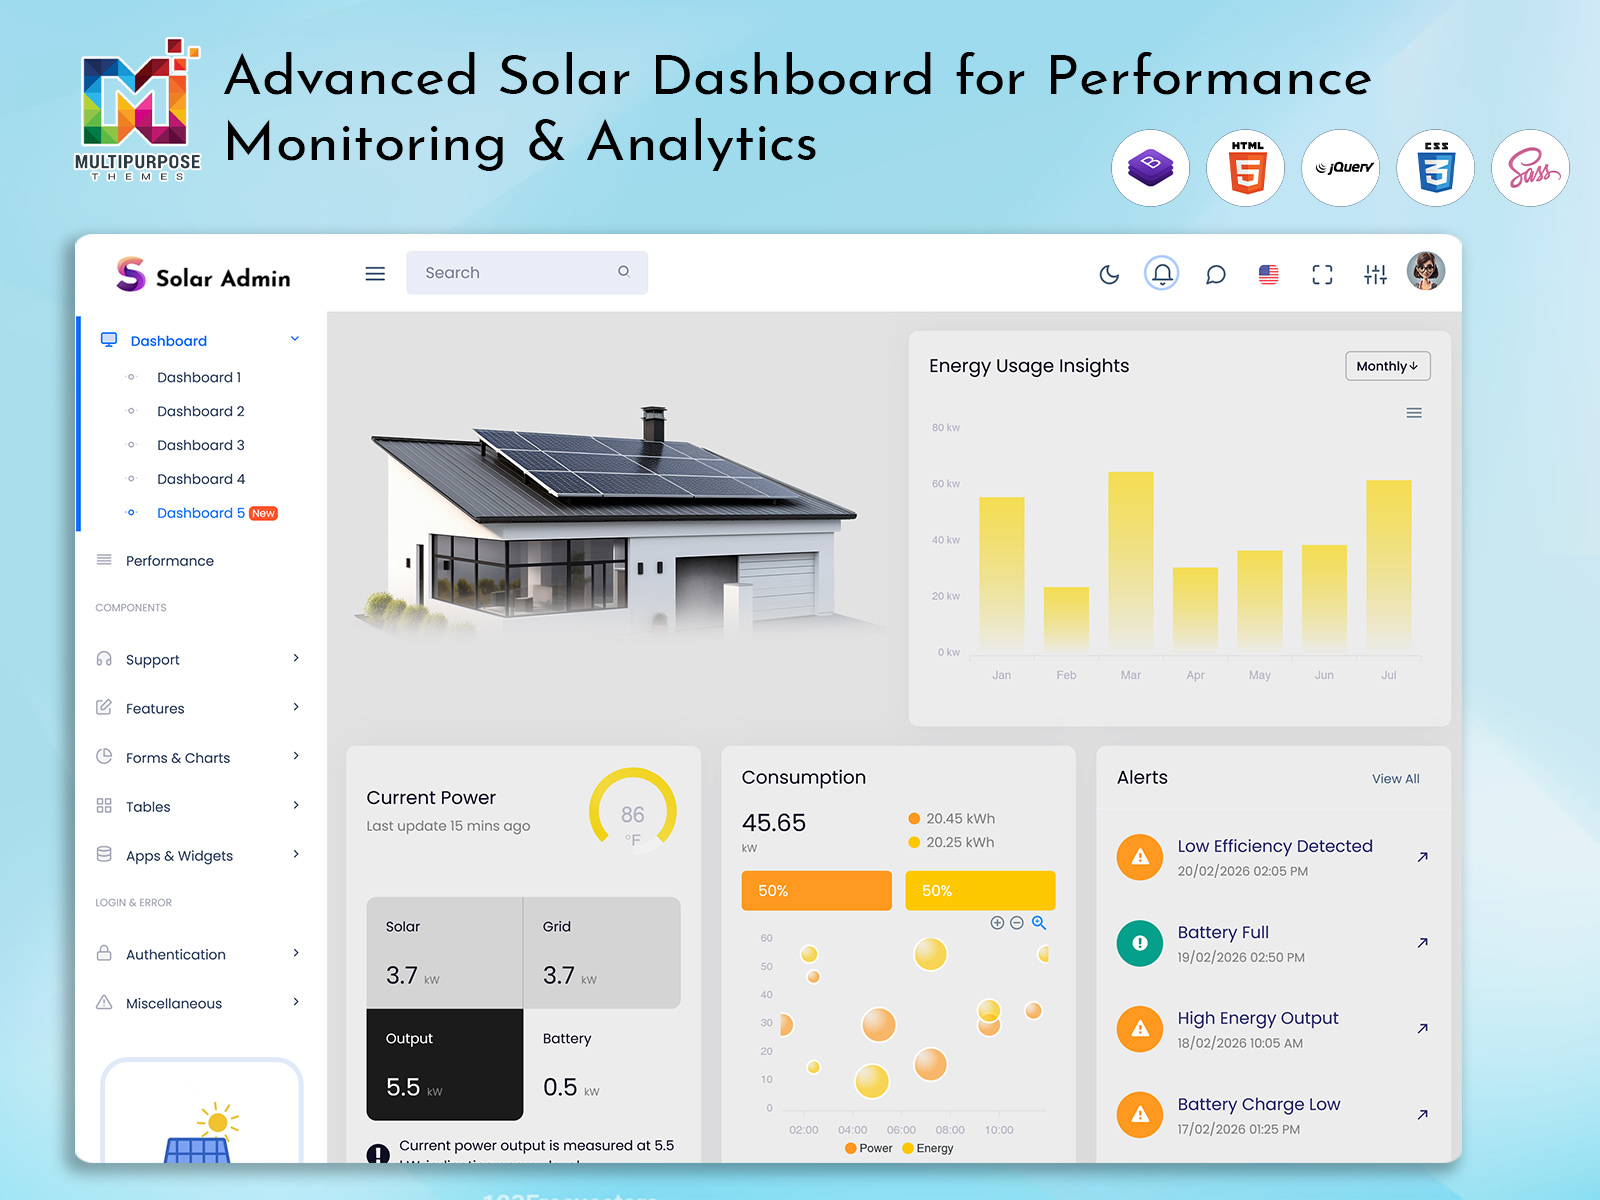
1. Real-Time Performance Monitoring
Solar Generation Dashboards provide live insights into energy production, consumption, and system health. Companies can instantly monitor Solar Panel Performance and identify inefficiencies before they affect overall operations.
2. Instant Alerts and Faster Maintenance
A Solar System Dashboard automatically detects abnormalities and sends alerts when issues occur. This enables maintenance teams to respond quickly, reduce downtime, and maintain consistent Solar Power System performance.
3. Smarter Energy Management and Cost Savings
By analyzing energy flow, battery status, and grid interactions, Solar Generation Dashboards help businesses optimize energy usage. This improves operational efficiency, lowers electricity expenses, and increases the return on solar investments.
Solar Production
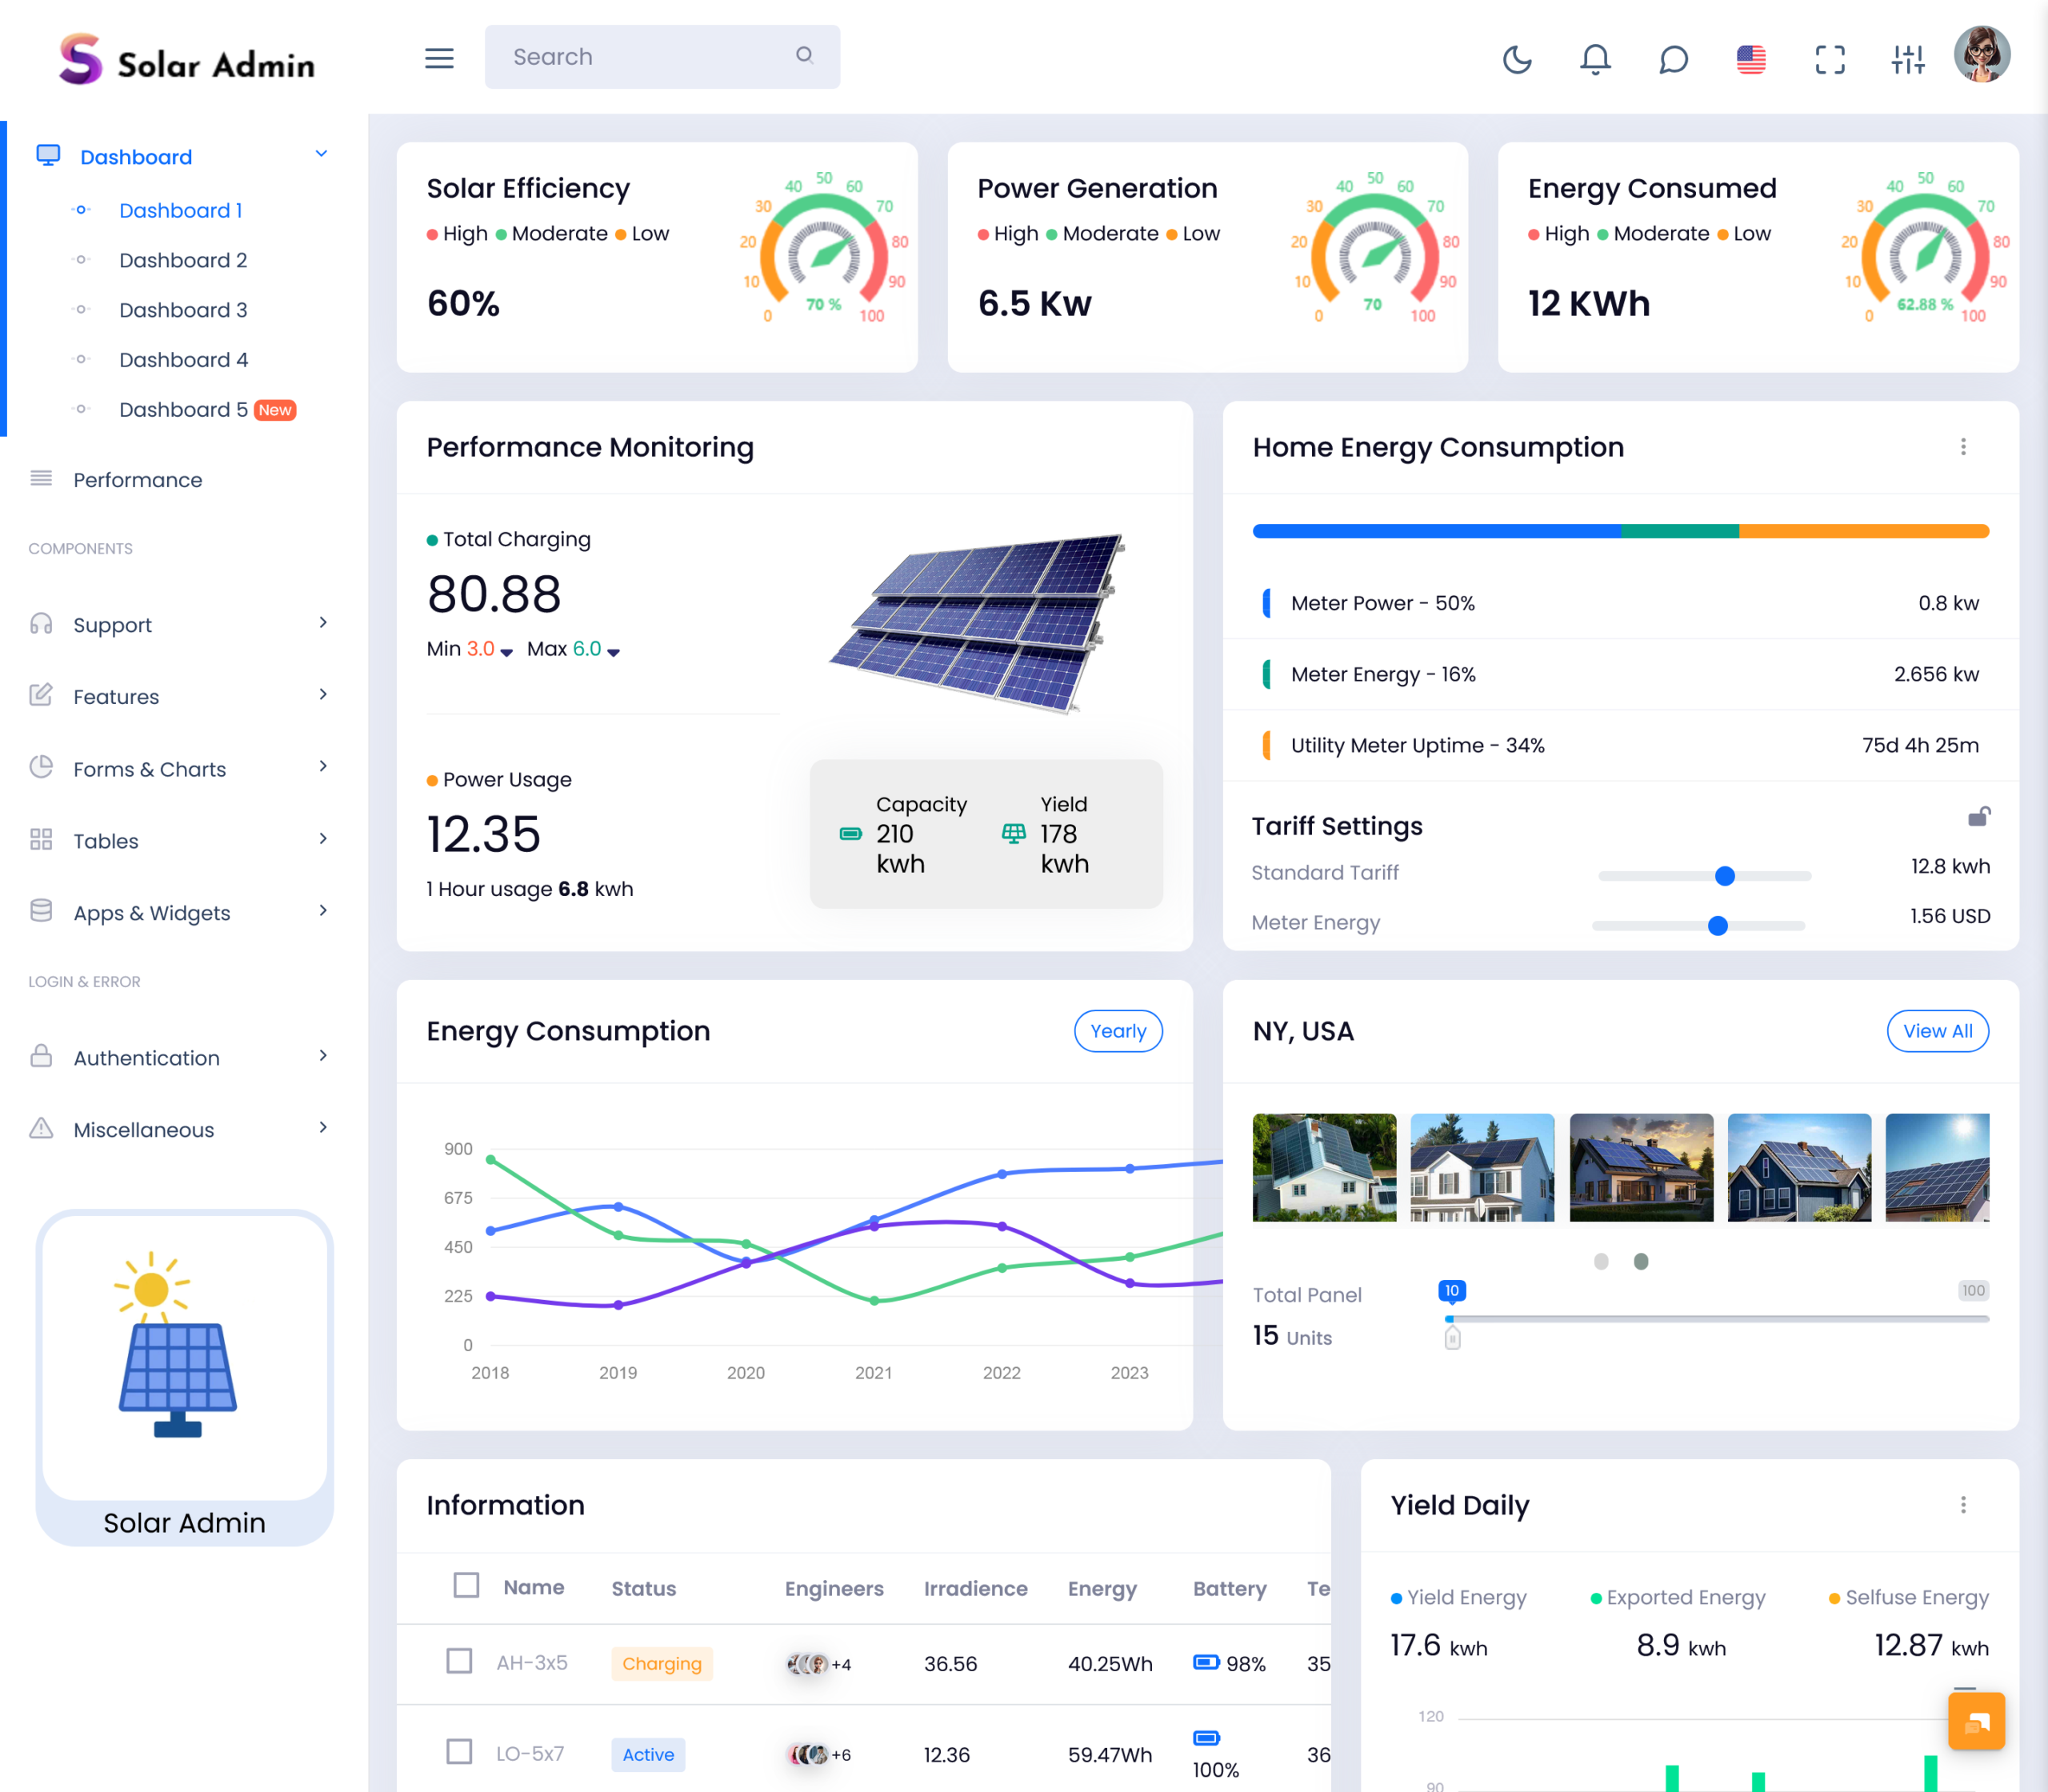
The Solar Production and Real-Time Energy Monitoring Dashboard provides continuous visibility of energy generation from a Solar Power System. It allows users to track live production levels, compare daily output, and understand overall system efficiency in a structured way. Within Solar Generation Dashboards, this module helps convert raw energy data into meaningful insights that support better operational decisions. A Solar Dashboard ensures that users can clearly see how effectively their system is performing at any given moment.
A Solar System Dashboard and Solar Web Dashboard make it easier to monitor Solar Panel Performance across different conditions and time periods. Through Solar Monitoring Mobile App access, users can check real-time updates and analyze fluctuations in energy production. In Solar Commercial PV System environments, this module plays a key role in improving system reliability and ensuring consistent energy output. Integrated with Solar Designing Software, it also supports better planning and optimization of future solar installations
Export to Grid and Import from Grid Energy Tracking System
The Export to Grid and Import from Grid Energy Tracking System is a key part of a Solar Power System that manages how energy moves between the solar installation and the main electricity grid. It helps users understand when surplus energy is exported and when additional power is imported to meet demand. In a Solar Dashboard, this module provides clear visibility of energy exchange patterns, making it easier to optimize usage and reduce dependency on external power sources.
Within Solar Generation Dashboards and a Solar System Dashboard, this feature plays an important role in balancing energy flow efficiently. A Solar Web Dashboard allows users to track export credits and import consumption in real time, ensuring transparency in billing and savings. Through a Solar Monitoring Mobile App or Solar System Monitoring App, users can monitor grid interactions anytime. This is especially valuable in a Solar Commercial PV System where energy cost optimization and performance efficiency are critical for long-term sustainability.
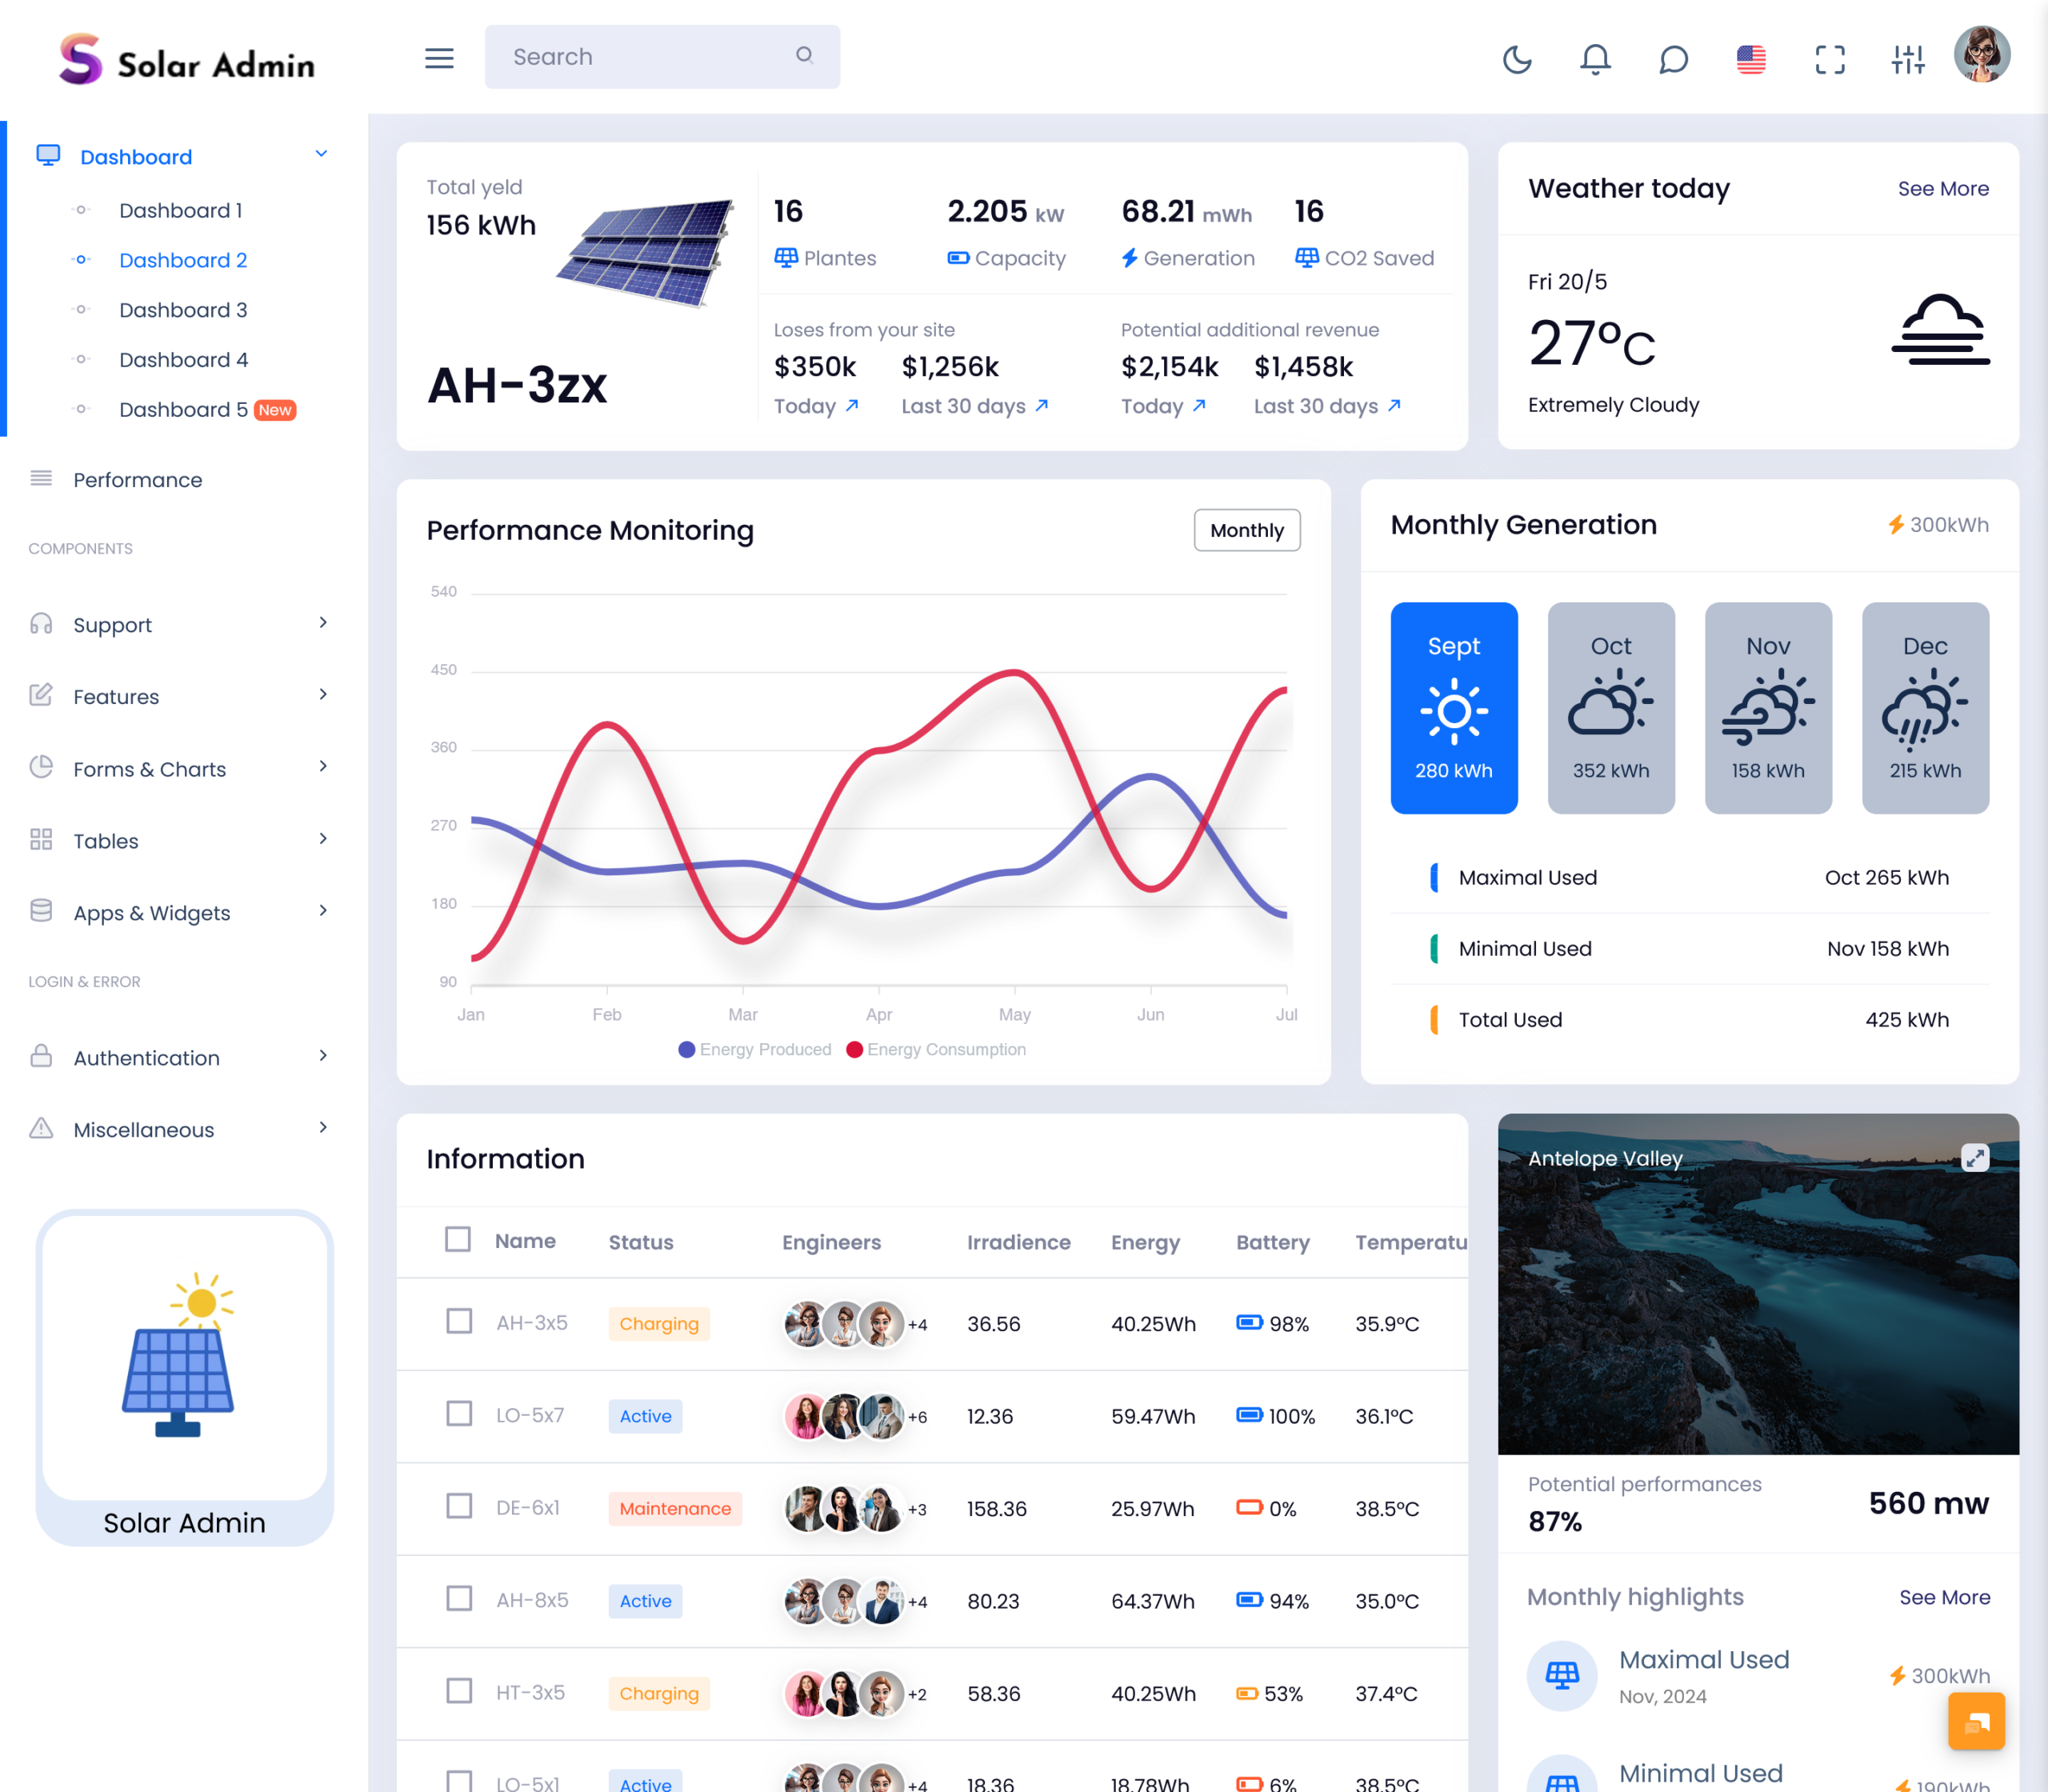
Consumed Energy and Earnings Analysis in Solar Dashboard
The Consumed Energy and Earnings Analysis module in a Solar Power System helps users understand how much energy is being used and how much financial return is generated from solar production. It connects consumption patterns with earnings data, offering a clear overview of cost savings and revenue benefits. In a Solar Dashboard, this feature turns raw usage data into meaningful financial insights that support better energy planning and efficiency improvements.
Within Solar Generation Dashboards and a Solar System Dashboard, this module provides a detailed breakdown of consumption versus earnings in real time. A Solar Web Dashboard allows users to track daily, monthly, and yearly performance trends, while Solar Panel Performance data helps identify efficiency levels. Through a Solar Monitoring Mobile App or Solar System Monitoring App, users can access these insights anytime, making it especially valuable for Solar Commercial PV System environments focused on long-term profitability and optimized energy usage.
VIEW DEMO BUY NOW
Features of Solar Power System Dashboard
1. Real-Time Solar Energy Monitoring System
A Solar Dashboard provides live tracking of energy generation, consumption, and storage within a Solar Power System. Users can instantly view updates through Solar Generation Dashboards, ensuring accurate visibility of system performance. This feature is widely used in Solar Monitoring Mobile App solutions for fast decision-making and better control.
2. Smart Grid Export and Import Tracking
This feature in a Solar System Dashboard helps monitor energy exchange between solar units and the main grid. It tracks exported surplus energy and imported backup power. In Solar Web Dashboard platforms, this function improves billing accuracy and supports efficient energy balancing for Solar Commercial PV System environments.
3. Advanced Solar Panel Performance Analytics
A Solar Panel Performance feature evaluates efficiency, output, and health of solar panels in real time. Integrated with Solar Designing Software, it helps identify underperforming units. Solar Modern Dashboards use this insight to improve productivity and ensure stable performance across the Solar Power System.
4. Mobile-Based Remote System Control Access
Through Solar System Monitoring App and Solar System App, users can access dashboards anytime from mobile devices. This feature allows remote monitoring of Solar Charging Dashboard data, ensuring flexibility and instant response to system alerts, even when users are away from the installation site.
5. Intelligent Energy Consumption and Earnings Report
A key feature of Solar Dashboard systems is detailed reporting of energy usage and earnings. It analyzes consumed power and financial returns, helping users understand profitability. Solar Generation Dashboards use this data to improve efficiency and optimize long-term Solar Power System performance.
Battery Charged and Discharged Energy Flow Management Module
The Battery Charged and Discharged Energy Flow Management Module in a Solar Power System helps users track how energy is stored and utilized within battery units. It provides clear visibility of charging cycles during peak solar production and discharging behavior during low generation periods. In a Solar Dashboard, this module ensures that energy storage is optimized for continuous supply and better system efficiency across all usage conditions.
Within Solar Generation Dashboards and a Solar System Dashboard, this feature plays a vital role in balancing stored energy with real-time demand. A Solar Charging Dashboard helps users understand battery utilization patterns, while Solar Web Dashboard systems display detailed energy flow analytics. Through Solar Monitoring Mobile App or Solar System Monitoring App, users can remotely check battery status. This is especially important in Solar Commercial PV System setups where energy reliability and storage efficiency directly impact overall performance.
HVAC Lighting Machinery and Pump Performance Monitoring System
The HVAC Lighting Machinery and Pump Performance Monitoring System in a Solar Power System helps users track energy usage across essential operational equipment. It measures how heating, ventilation, air conditioning, lighting systems, machinery units, and pumps consume solar energy. In a Solar Dashboard, this module provides clear visibility into device-level performance, helping identify high consumption areas and improving overall efficiency of the Solar System Dashboard.
Within Solar Modern Dashboards and Solar Generation Dashboards, this feature plays an important role in optimizing distributed energy usage. A Solar Web Dashboard allows users to analyze equipment performance in real time, while Solar Designing Software helps improve system planning based on consumption patterns. Through Solar Monitoring Mobile App or Solar System Monitoring App, users can monitor HVAC and machinery performance remotely, making it highly valuable for Solar Commercial PV System environments focused on energy savings and operational control.
Advantages of Solar Power System Dashboard
1. Improved Energy Visibility and Control
A Solar Dashboard provides complete visibility of energy generation, consumption, and storage within a Solar Power System. Users can easily monitor real-time performance through Solar Generation Dashboards, helping them take quick decisions. This improves system awareness and ensures better control over overall energy flow in daily operations.
2. Better Efficiency in Energy Management
With a Solar System Dashboard, users can analyze how energy is used across different systems like HVAC, lighting, and machinery. Solar Panel Performance tracking helps identify inefficiencies and reduce wastage. This leads to optimized energy usage and improved performance in both residential and Solar Commercial PV System environments.
3. Remote Monitoring and Accessibility
Solar Monitoring Mobile App and Solar System Monitoring App allow users to access system data anytime and anywhere. This remote access improves flexibility and ensures instant response to system alerts. It is especially useful for large-scale installations where continuous monitoring is required for stable operation.
4. Increased Cost Savings and Profitability
A Solar Charging Dashboard helps track consumed energy and earnings in real time. By understanding export and import patterns, users can reduce electricity costs and increase financial returns. Solar Web Dashboard systems provide clear financial insights that support long-term profitability and investment planning.
5. Smarter System Planning and Optimization
Using Solar Designing Software integrated with Solar Modern Dashboards, users can improve system design and performance planning. It helps optimize panel placement, energy flow, and storage usage. This ensures long-term efficiency and stability in Solar Power System operations.
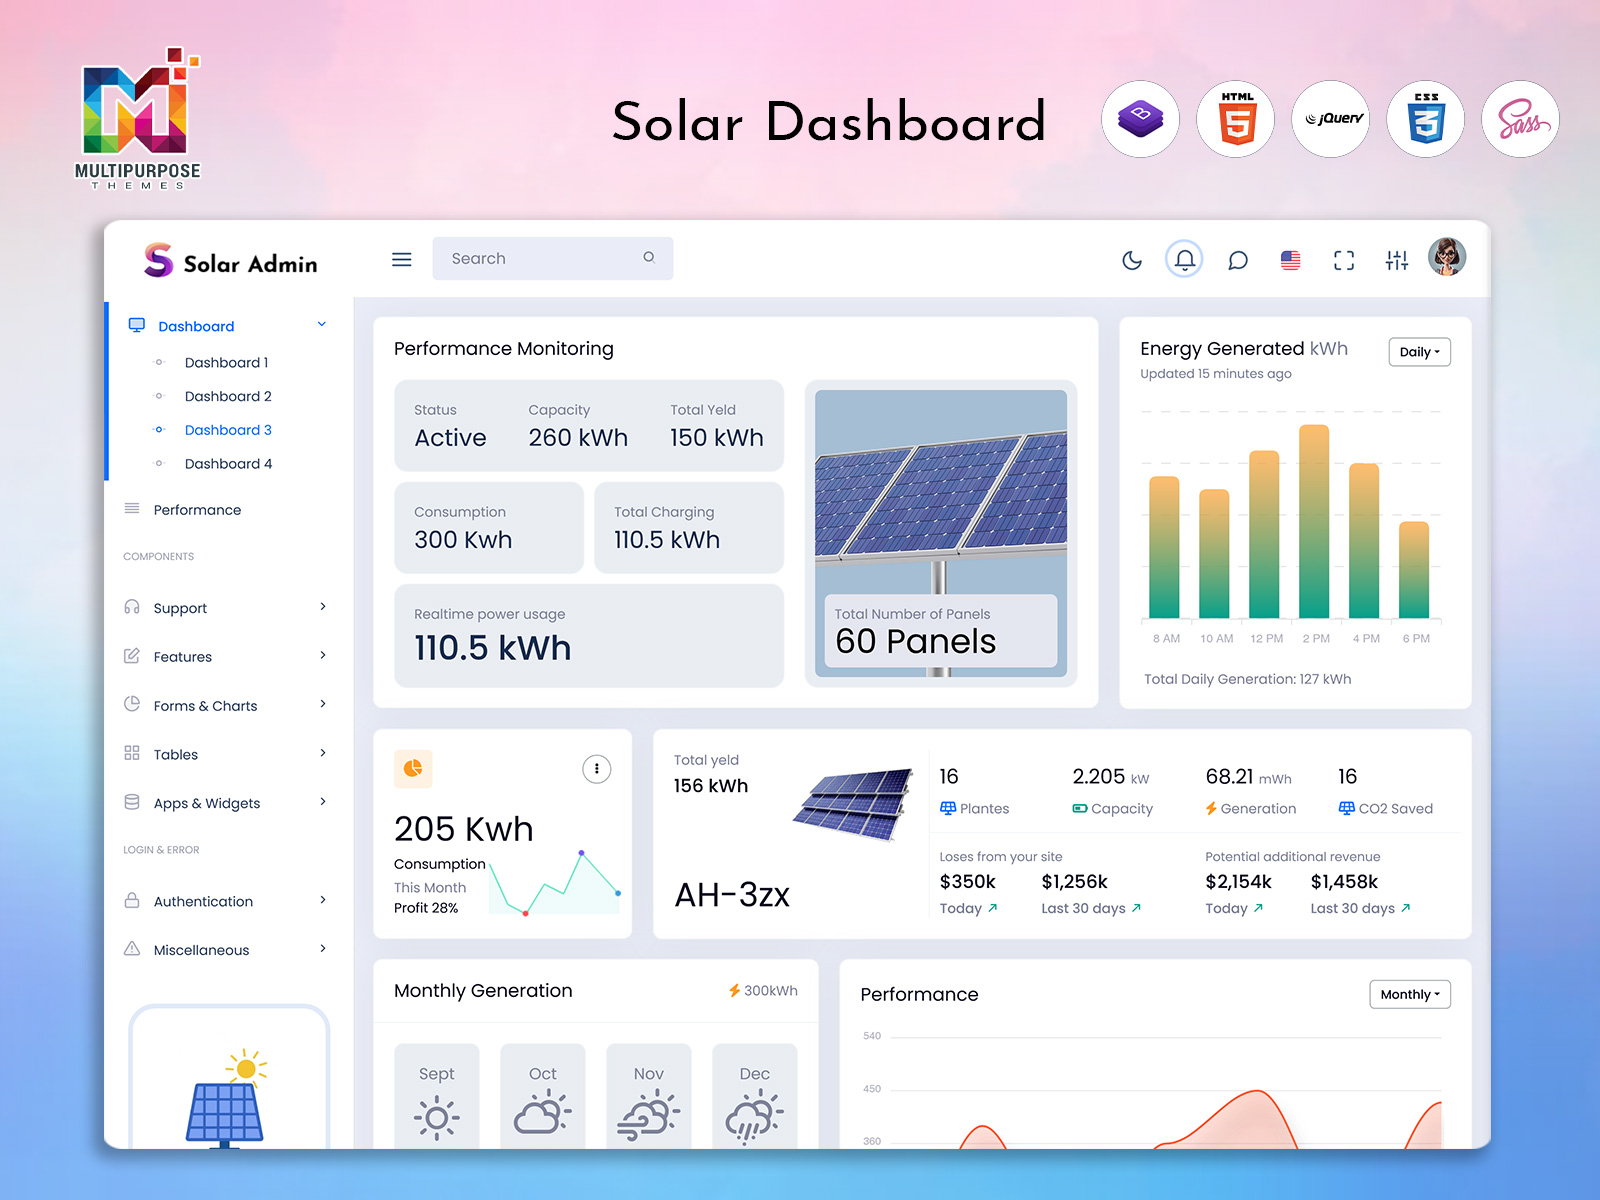
Solar Generation Data Visualization with Production and Usage
The Solar Generation Data Visualization module in a Solar Power System helps users understand energy production and consumption patterns in a simple graphical format. It converts raw data into visual insights such as charts, graphs, and indicators within a Solar Dashboard. This makes it easier to compare how much energy is being produced versus how much is being used across different time periods in real time.
Within Solar Generation Dashboards and a Solar System Dashboard, this feature plays a key role in improving decision-making by showing clear production and usage trends. A Solar Web Dashboard displays live energy flow data, while Solar Panel Performance metrics help identify efficiency changes. Through Solar Monitoring Mobile App or Solar System Monitoring App, users can access visualization reports anytime. This is especially useful in Solar Commercial PV System environments where accurate monitoring of energy behavior is essential for optimization.
Meter Energy Device Performance and Power Statistics Dashboard
The Meter Energy Device Performance and Power Statistics Dashboard in a Solar Power System helps users track energy flow through smart meters and connected devices. It provides accurate readings of imported and exported energy, ensuring transparency in consumption and production. Within a Solar Dashboard, this module gives a clear overview of system performance by combining meter data with real-time analytics for better energy management.
In Solar System Dashboard and Solar Web Dashboard environments, this feature plays a crucial role in monitoring Solar Panel Performance and overall device efficiency. It displays power statistics such as usage trends, energy distribution, and system load behavior. Through Solar Monitoring Mobile App and Solar System Monitoring App, users can access live meter updates anytime. This is especially valuable in Solar Commercial PV System setups where precise energy tracking and performance optimization are required for long-term stability.
Conclusion
A Solar Power System combined with a modern Solar Dashboard creates a powerful solution for real-time energy monitoring, analysis, and optimization. It helps users track production, consumption, storage, and financial performance in a single platform. With tools like Solar Generation Dashboards and Solar System Dashboard, businesses and individuals can manage energy more efficiently and reduce dependency on manual monitoring systems.
By integrating features such as Solar Monitoring Mobile App access, Solar Web Dashboard insights, and Solar Panel Performance tracking, users gain complete control over their energy ecosystem. In Solar Commercial PV System environments, this improves efficiency, reduces costs, and enhances sustainability. Overall, Solar Modern Dashboards and Solar Designing Software make energy management smarter, more transparent, and highly effective for long-term growth.
FAQs
1. What is a solar monitoring system used for?
A solar monitoring system is used to track electricity generation, energy usage, and battery storage from solar panels in real time. It helps users understand system performance and improve efficiency using solutions from MultiPurpose Themes.
2. How do I check my solar panel performance?
You can check solar panel performance through a solar monitoring dashboard or mobile app that shows daily energy production, efficiency, and system status. Many dashboard solutions from MultiPurpose Themes provide real-time tracking features.
3. Is there an app to monitor solar power generation?
Yes, solar monitoring apps allow users to track energy generation, battery level, and power consumption from anywhere. MultiPurpose Themes provides dashboard-based systems that can be integrated with mobile monitoring solutions.
4. How can I track solar energy production at home?
You can track solar energy production using a monitoring dashboard that displays daily, monthly, and yearly generation data. MultiPurpose Themes offers dashboard templates designed for clear energy tracking and analytics.
5. What is solar energy monitoring used for?
Solar energy monitoring is used to measure system performance, detect issues, track savings, and optimize energy usage. Platforms like MultiPurpose Themes help visualize this data in an easy-to-understand dashboard format.
6. Why is my solar panel not producing enough power?
Low solar output can happen due to shading, dust, weather changes, or system faults. A solar dashboard helps identify performance issues quickly, and MultiPurpose Themes provides tools for monitoring these insights.
7. Can I monitor solar panels remotely?
Yes, modern solar systems allow remote monitoring through web dashboards and mobile apps. MultiPurpose Themes supports responsive dashboard designs that enable real-time remote access.
8. How do I know if my solar system is working properly?
You can check system health using a solar dashboard that shows energy output, inverter status, and alerts. MultiPurpose Themes dashboard systems help users monitor performance continuously.
9. What affects solar panel efficiency?
Solar efficiency depends on sunlight exposure, temperature, dust, installation quality, and system condition. MultiPurpose Themes dashboards help users track these factors through performance analytics.
10. Do solar monitoring systems help reduce electricity bills?
Yes, by tracking energy generation and usage, solar monitoring systems help optimize consumption and reduce electricity costs. MultiPurpose Themes provides dashboards that support better energy management and savings insights.
Related Posts


This Post Has 0 Comments