
Modern businesses generate large volumes of information every day, and managing that information efficiently has…
Analytical Dashboard 2026: Up-to-Date Data for Faster Growth
Reading Time: 7 minutes
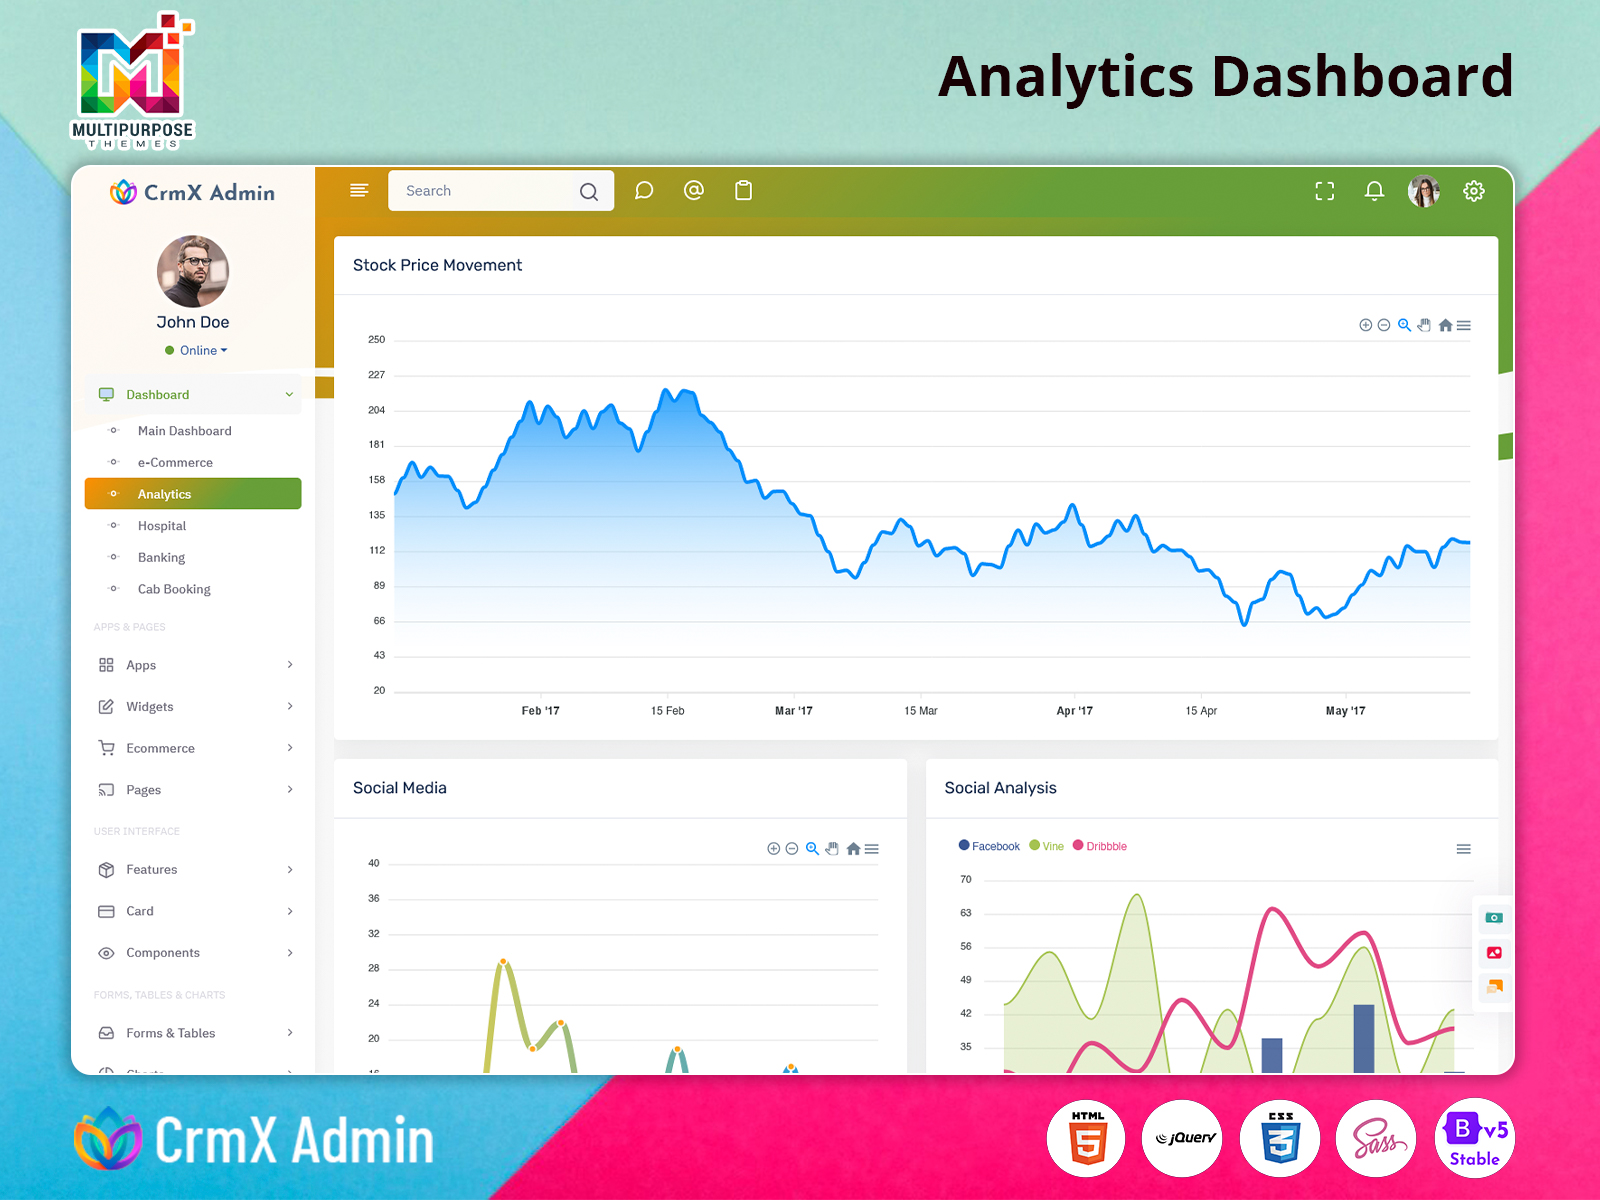
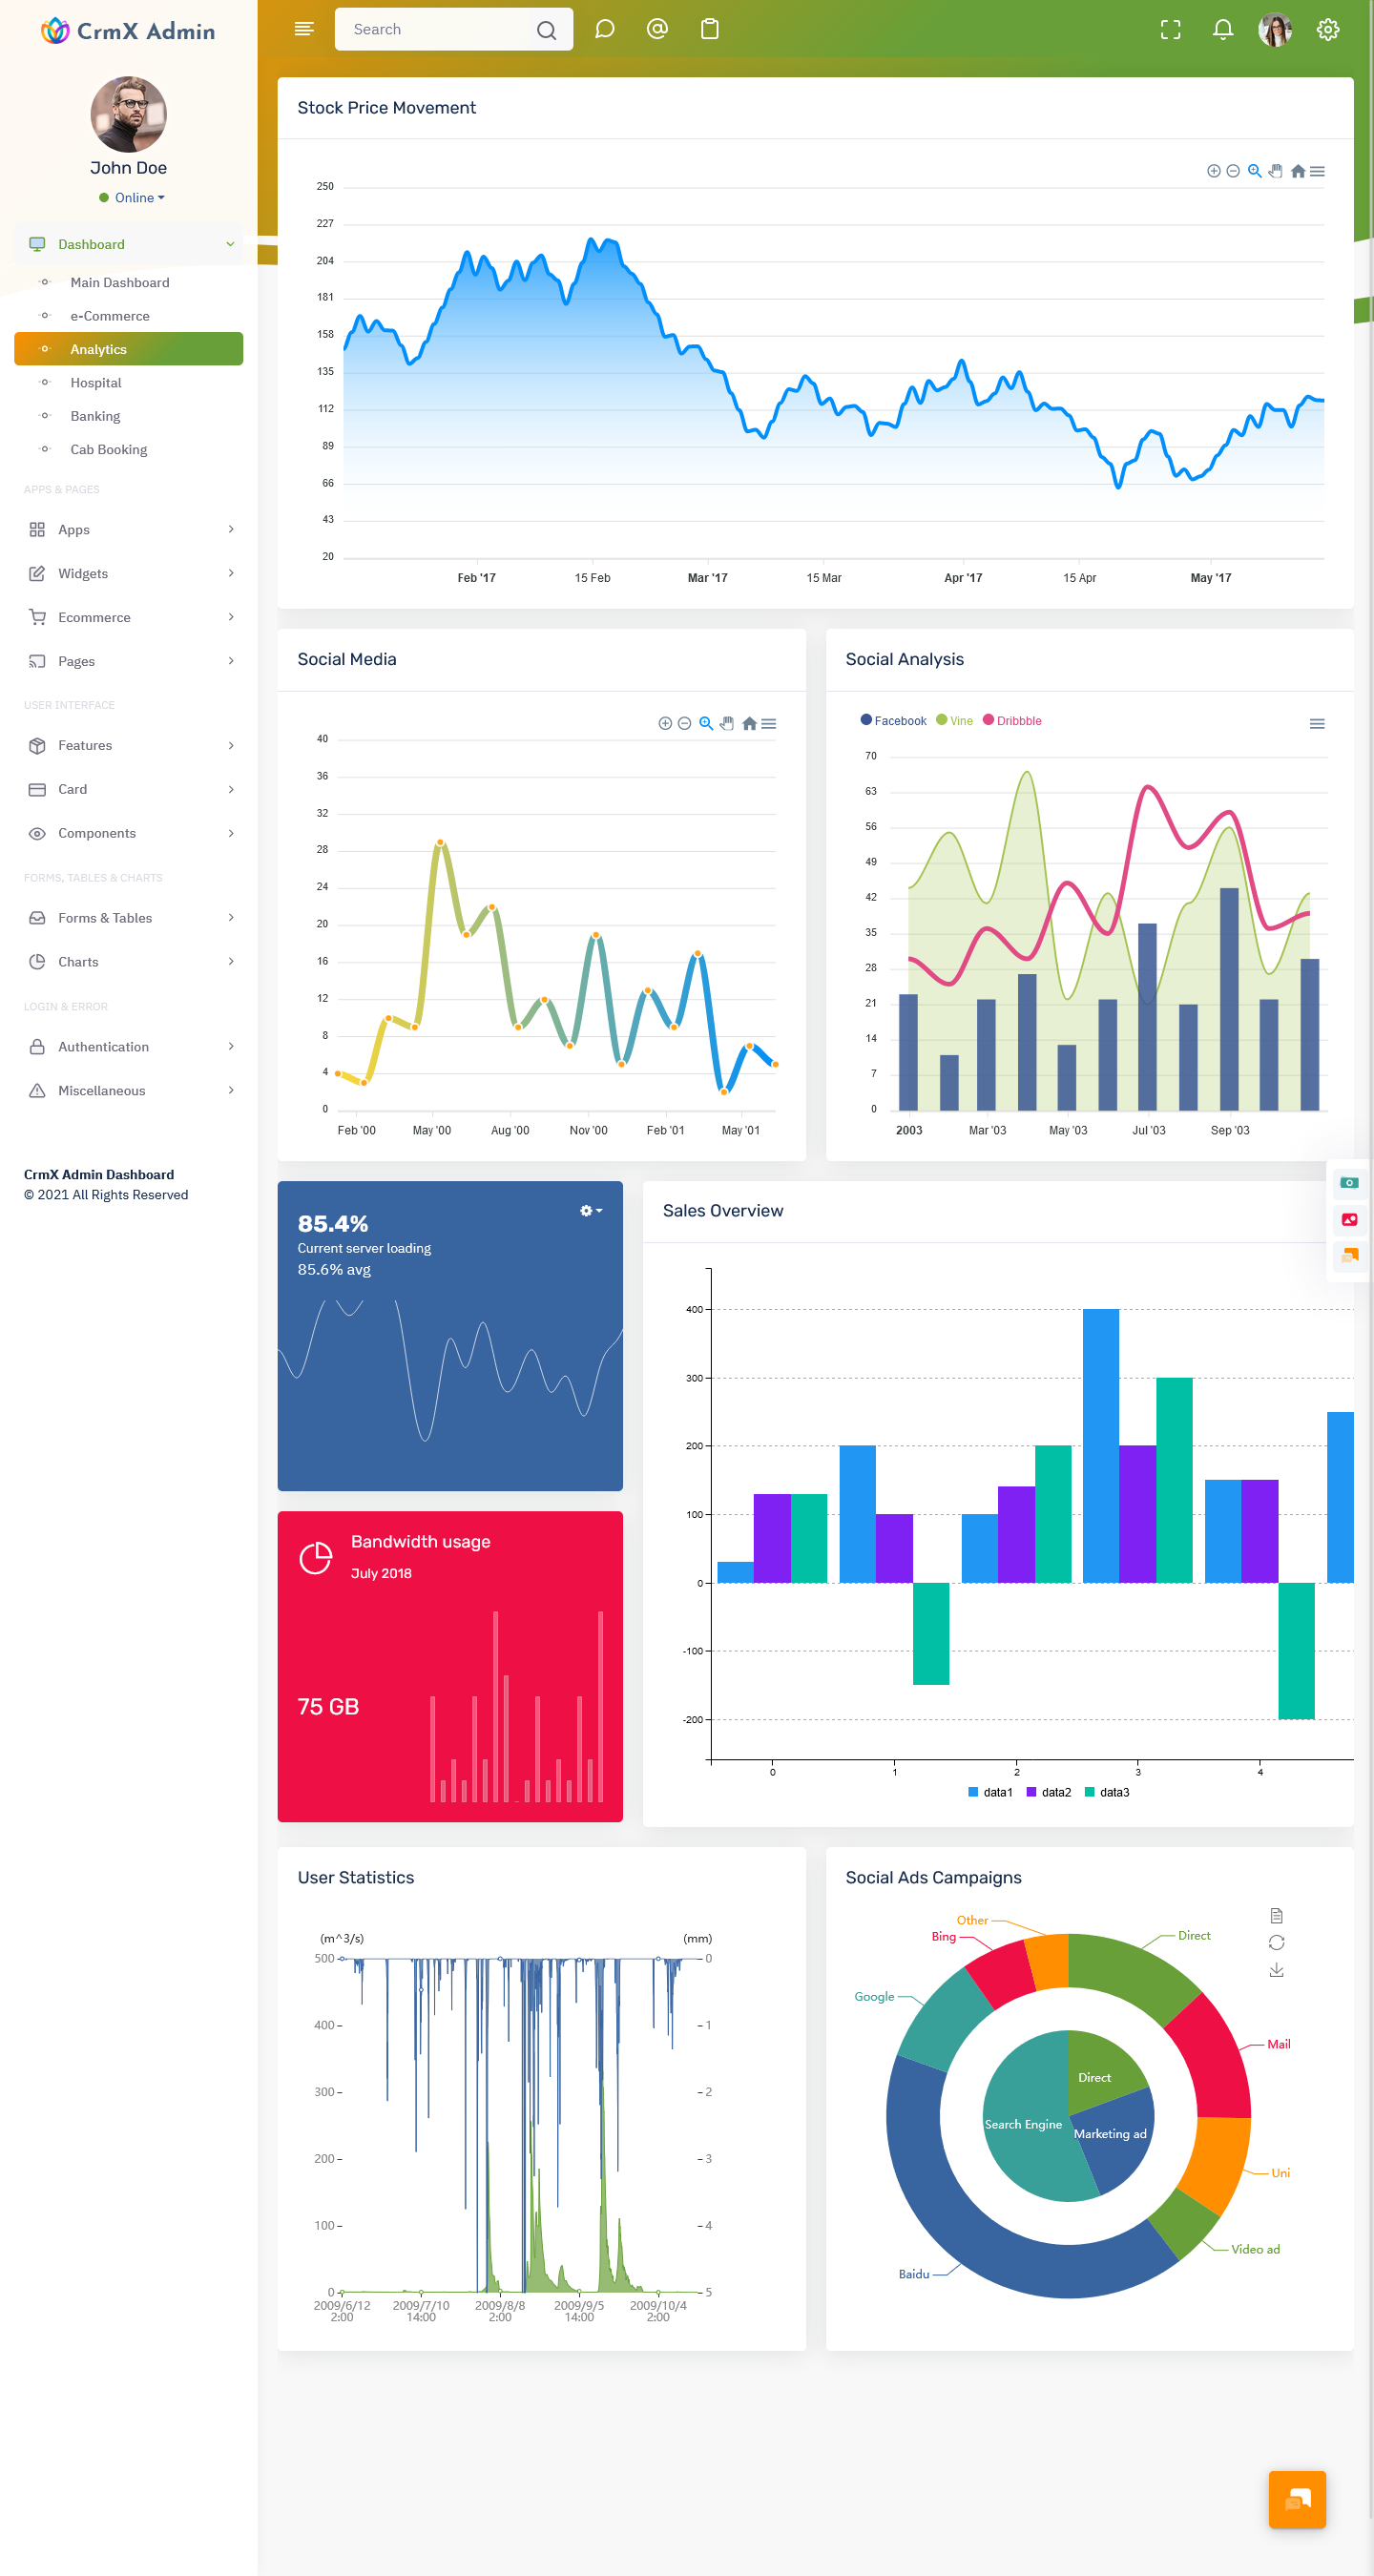
An Analytical Dashboard is a powerful tool that helps businesses understand their data in a clear and visual way. Instead of going through complex spreadsheets or raw numbers, companies can view everything in one place through charts, graphs, and summaries. This makes it easier to track performance, identify trends, and make smart decisions quickly.
In today’s fast-moving digital world, data plays a huge role in business success. An Analytics Dashboard allows teams to monitor important metrics like sales, customer behavior, and growth patterns in real time. Whether it is a startup or a large enterprise, having a Data Analytics Dashboard improves efficiency and helps in planning future strategies.
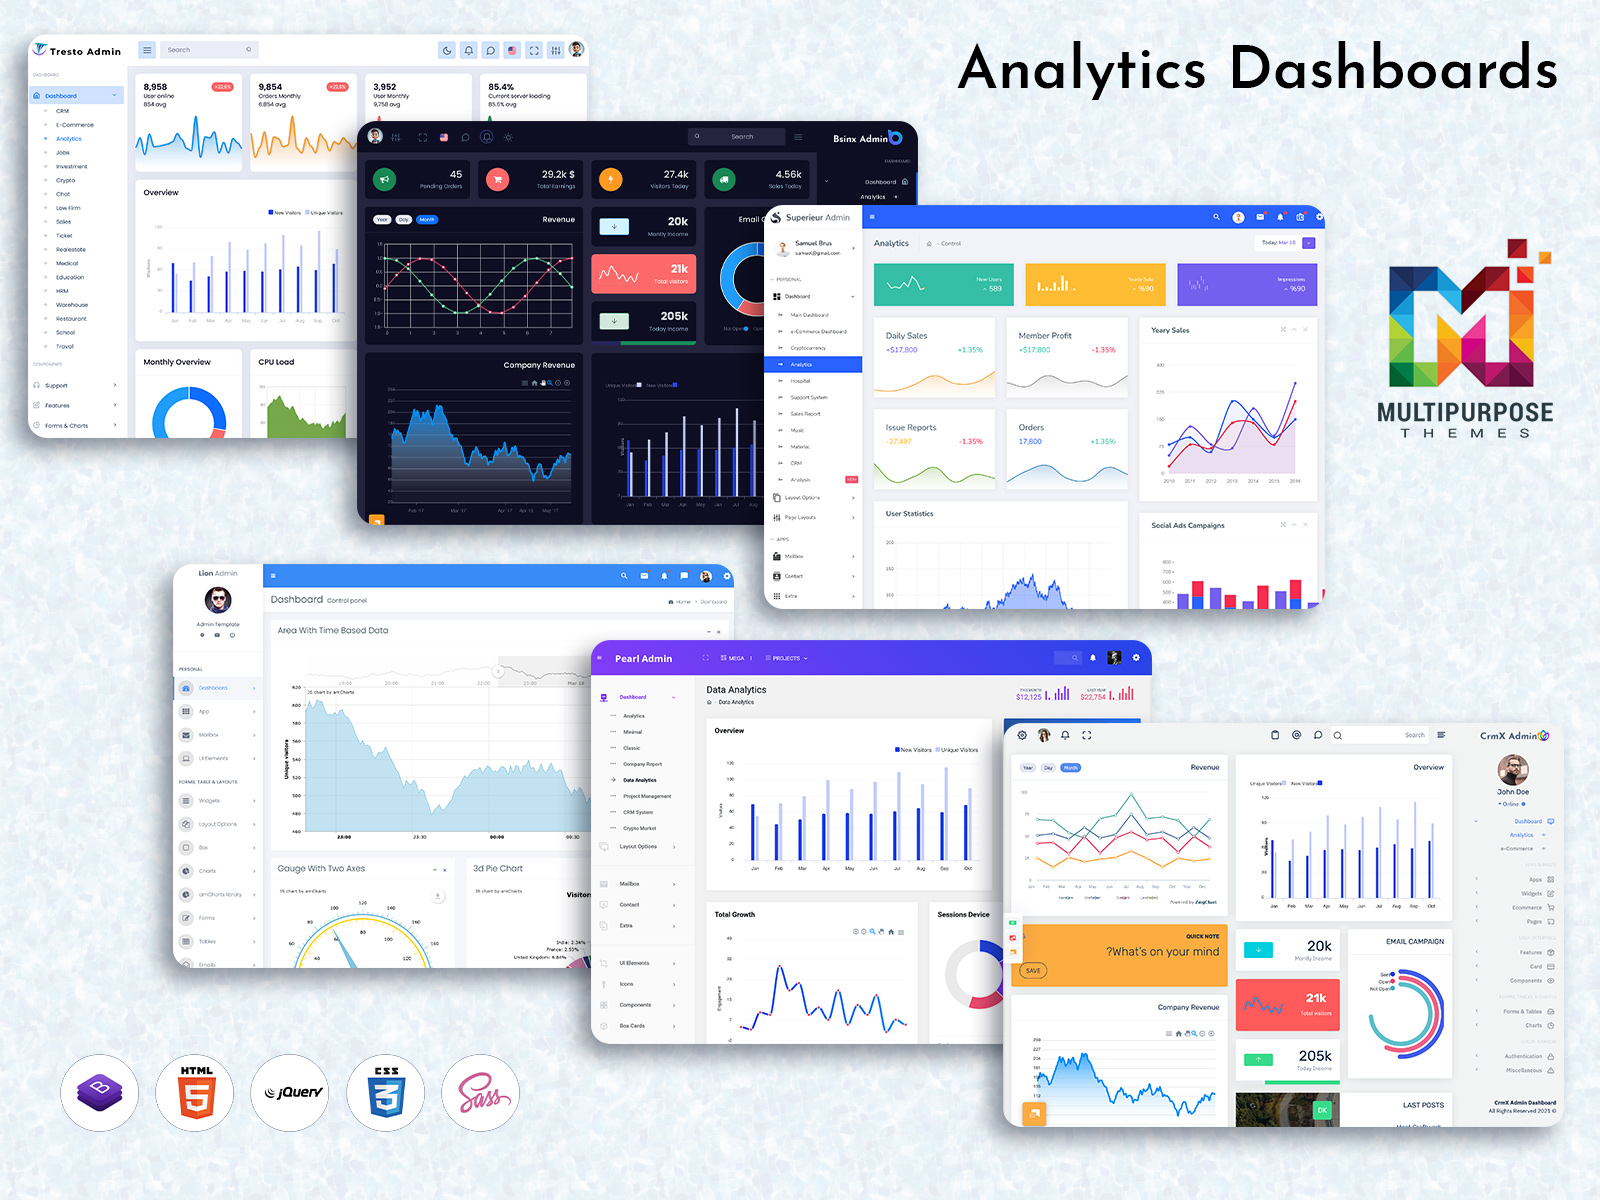
With the help of modern tools like an Analytics Admin Panel or Analytics Software, businesses can turn raw data into meaningful insights. This is why Analytical Dashboard solutions have become an essential part of every website or application.
Watch Full Video
Role of Analytical Dashboard in Business Growth
An Analytical Dashboard plays a key role in helping businesses grow faster and smarter. It provides real-time data that allows companies to react quickly to market changes. Instead of relying on guesswork, businesses can use data-backed insights to make decisions.
For example, if sales drop in a particular region, the Analytics Dashboard can instantly highlight the issue. This allows teams to take action immediately. Similarly, marketing campaigns can be tracked using Analytics Data Charts, helping businesses understand what works best.
A well-designed Analytics Admin UI Kit also improves user experience by presenting data in a simple and interactive way. When businesses use Business Analytics Software effectively, they can reduce risks, improve performance, and increase profitability over time.
E-commerce & Retail Industry
In the e-commerce and retail sector, an Analytical Dashboard helps businesses manage large amounts of customer and sales data efficiently. Online stores deal with daily transactions, product performance, and customer behavior, which can be difficult to track manually. A Data Analytics Dashboard makes it easy to monitor sales trends, best-selling products, and customer preferences.
With an Analytics Bootstrap Admin interface, businesses can quickly view reports and optimize their strategies. For example, if a product is not performing well, the dashboard highlights it instantly. Retailers can also track seasonal trends and improve inventory planning. This leads to better decision-making and higher revenue growth.
Explore Live Dashboard – Just Click Demo
BUY NOW DEMO
Finance & Banking Industry
The finance and banking industry relies heavily on accurate data, and an Analytical Dashboard plays a crucial role in managing it. Financial institutions use Analytics Software to monitor transactions, detect fraud, and analyze customer activity. A well-structured Analytics Admin Panel allows teams to access real-time financial data securely.
Using Analytics Data Charts, banks can visualize spending patterns and risk factors. This helps them make better lending decisions and improve customer services. A Data Analytics Dashboard also ensures transparency and compliance with regulations. Overall, it enhances operational efficiency and builds trust with customers.
Healthcare Industry
In healthcare, an Analytical Dashboard helps manage patient data, appointments, and medical reports effectively. Hospitals and clinics generate large volumes of data every day, and a Data Analytics Dashboard makes it easier to organize and analyze this information.
With the help of an Analytics Admin UI Kit medical staff can quickly access patient history, track treatment progress, and manage schedules. Analytics Software also helps in identifying trends, such as common diseases or patient flow patterns. This improves decision-making and ensures better patient care. A well-designed Analytics Bootstrap Admin system also enhances overall hospital management.
Education and LMS Platforms
Educational institutions and LMS platforms use Analytical Dashboard systems to track student performance and course progress. Teachers and administrators can use an Analytics Dashboard to monitor attendance, assignments, and learning outcomes in real time.
A Data Analytics Dashboard helps identify students who need extra support and improves overall learning quality. With an Analytics Admin Panel, institutions can manage courses, track engagement, and analyze results efficiently. Analytics Software also helps in improving course content based on student feedback and performance trends. This creates a better and more personalized learning experience.
Travel & Hospitality Industry
The travel and hospitality industry benefits greatly from an Analytical Dashboard by managing bookings, customer preferences, and seasonal demand. A Data Analytics Dashboard helps businesses track reservations, cancellations, and revenue trends.
With an Analytics Bootstrap Admin interface, travel companies can analyze customer behavior and improve their services. For example, hotels can identify peak booking periods and adjust pricing strategies. Analytics Data Charts also help in understanding customer feedback and improving overall experience. This leads to higher customer satisfaction and better business growth.
Real Estate Industry
In the real estate sector, an Analytical Dashboard helps track property listings, sales performance, and client interactions. Real estate firms deal with multiple properties and clients, making data management essential. A Data Analytics Dashboard simplifies this process by providing a clear overview of all activities.
Using an Analytics Admin Panel, agents can monitor leads, track conversions, and analyze market trends. Analytics Software also helps in identifying high-demand areas and pricing strategies. With an Analytics Bootstrap Admin system, real estate businesses can improve efficiency and close deals faster.
SaaS & IT Companies
SaaS and IT companies rely on Analytical Dashboard systems to track user activity, subscriptions, and performance metrics. A Data Analytics Dashboard provides insights into user behavior, helping companies improve their products and services.
An Analytics Admin UI Kit allows developers and managers to monitor system performance and detect issues quickly. Analytics Software also helps in tracking revenue, churn rate, and customer engagement. With the help of Analytics Data Charts, companies can make data-driven decisions and enhance their offerings. This leads to better user experience and business growth.
Marketing Agencies
Marketing agencies use Analytical Dashboard tools to track campaign performance and measure results. A Data Analytics Dashboard helps monitor website traffic, conversions, and user engagement.
With an Analytics Admin Panel, marketers can analyze which campaigns are performing well and which need improvement. Analytics Software also provides insights into audience behavior and preferences. Using Analytics Data Charts, agencies can present data in a visually appealing way to clients. This improves transparency and helps in achieving better marketing results.
HR & Corporate Firms
HR departments and corporate firms use Analytical Dashboard systems to manage employee data, attendance, and performance. A Data Analytics Dashboard provides a clear view of workforce metrics, helping HR teams make informed decisions.
An Analytics Bootstrap Admin system allows easy access to employee records and reports. Analytics Software also helps in tracking productivity and identifying areas for improvement. With an Analytics Admin UI Kit, HR teams can streamline operations and improve overall efficiency. This leads to better workforce management and organizational growth.
Support & Helpdesk Systems
Support and helpdesk systems benefit from an Analytical Dashboard by tracking tickets, response times, and customer satisfaction. A Data Analytics Dashboard helps teams monitor support performance and identify issues quickly.
Using an Analytics Admin Panel, businesses can manage customer queries efficiently and improve response time. Analytics Software also provides insights into common problems faced by customers. With Analytics Data Charts, teams can analyze trends and improve their support services. This enhances customer experience and builds trust.
Advantages of Using Analytical Dashboard
One of the biggest advantages of an Analytical Dashboard is that it simplifies complex data into easy-to-understand visuals. Businesses can quickly access important information without spending hours analyzing raw data. A Data Analytics Dashboard also improves decision-making by providing real-time insights.
Another major benefit is increased efficiency. With an Analytics Admin Panel, teams can automate reports and reduce manual work. Analytics Software also helps in identifying trends and opportunities, allowing businesses to stay ahead of competitors. The use of Analytics Data Charts makes data more interactive and engaging. Overall, an Analytical Dashboard enhances productivity, reduces errors, and supports long-term business growth.
Advantages of Using Bootstrap 5 for Analytical Dashboard
Using Bootstrap 5 for building an Analytical Dashboard offers several practical benefits. It provides a responsive design, ensuring that the dashboard works smoothly on all devices, including mobile, tablet, and desktop. An Analytics Bootstrap Admin built with Bootstrap 5 is easy to customize and saves development time.
Another advantage is consistency in design. With a well-structured Analytics Admin UI Kit, developers can create clean and modern interfaces quickly. Bootstrap 5 also supports fast performance and compatibility with modern browsers. This makes it an ideal choice for developing Analytics Software. Overall, it helps businesses create user-friendly dashboards with minimal effort.
Conclusion
An Analytical Dashboard is no longer a luxury but a necessity for modern businesses. It helps organizations turn data into valuable insights and make better decisions. From e-commerce to healthcare and from finance to marketing, every industry can benefit from a well-designed Data Analytics Dashboard.
With the support of tools like Analytics Admin Panel, Analytics Software, and Analytics Bootstrap Admin, businesses can improve efficiency and achieve their goals faster. When combined with Bootstrap 5 and a powerful Analytics Admin UI Kit, companies can create dashboards that are not only functional but also visually appealing.
In the end, an Analytical Dashboard empowers businesses to grow, adapt, and succeed in a data-driven world.
FAQs on Analytical Dashboard
1. What is an Analytical Dashboard?
An Analytical Dashboard is a visual tool that displays business data using charts and graphs. It helps users understand performance, track key metrics, and make better decisions quickly.
2. How does an Analytics Dashboard help businesses?
An Analytics Dashboard helps businesses monitor real-time data, identify trends, and improve decision-making. It reduces manual work and allows teams to respond quickly to changes in performance.
3. What is the difference between Analytics Software and an Analytical Dashboard?
Analytics Software processes and analyzes raw data, while an Analytical Dashboard visually presents that data in an easy-to-understand format using charts, graphs, and summaries.
4. Why is a Data Analytics Dashboard important?
A Data Analytics Dashboard is important because it converts complex data into simple visuals. It helps businesses track growth, measure performance, and make data-driven decisions more effectively.
5. Can small businesses use an Analytics Admin Panel?
Yes, small businesses can use an Analytics Admin Panel to track sales, customers, and performance. It is cost-effective and helps in improving operations and business growth.
6. Why use Bootstrap 5 for an Analytics Bootstrap Admin?
Bootstrap 5 helps create responsive and user-friendly dashboards. It saves development time, ensures compatibility across devices, and provides a clean design for Analytics Bootstrap Admin templates.
7. What are Analytics Data Charts used for?
Analytics Data Charts are used to represent data visually through graphs and charts. They help users easily understand trends, comparisons, and performance without analyzing complex numbers.
Related Posts


This Post Has 0 Comments