
The demand for intelligent energy monitoring has rapidly increased with the growth of renewable power…

Solar Dashboard: Analyze and Predict Solar Irradiance Sensor Data
Reading Time: 6 minutes
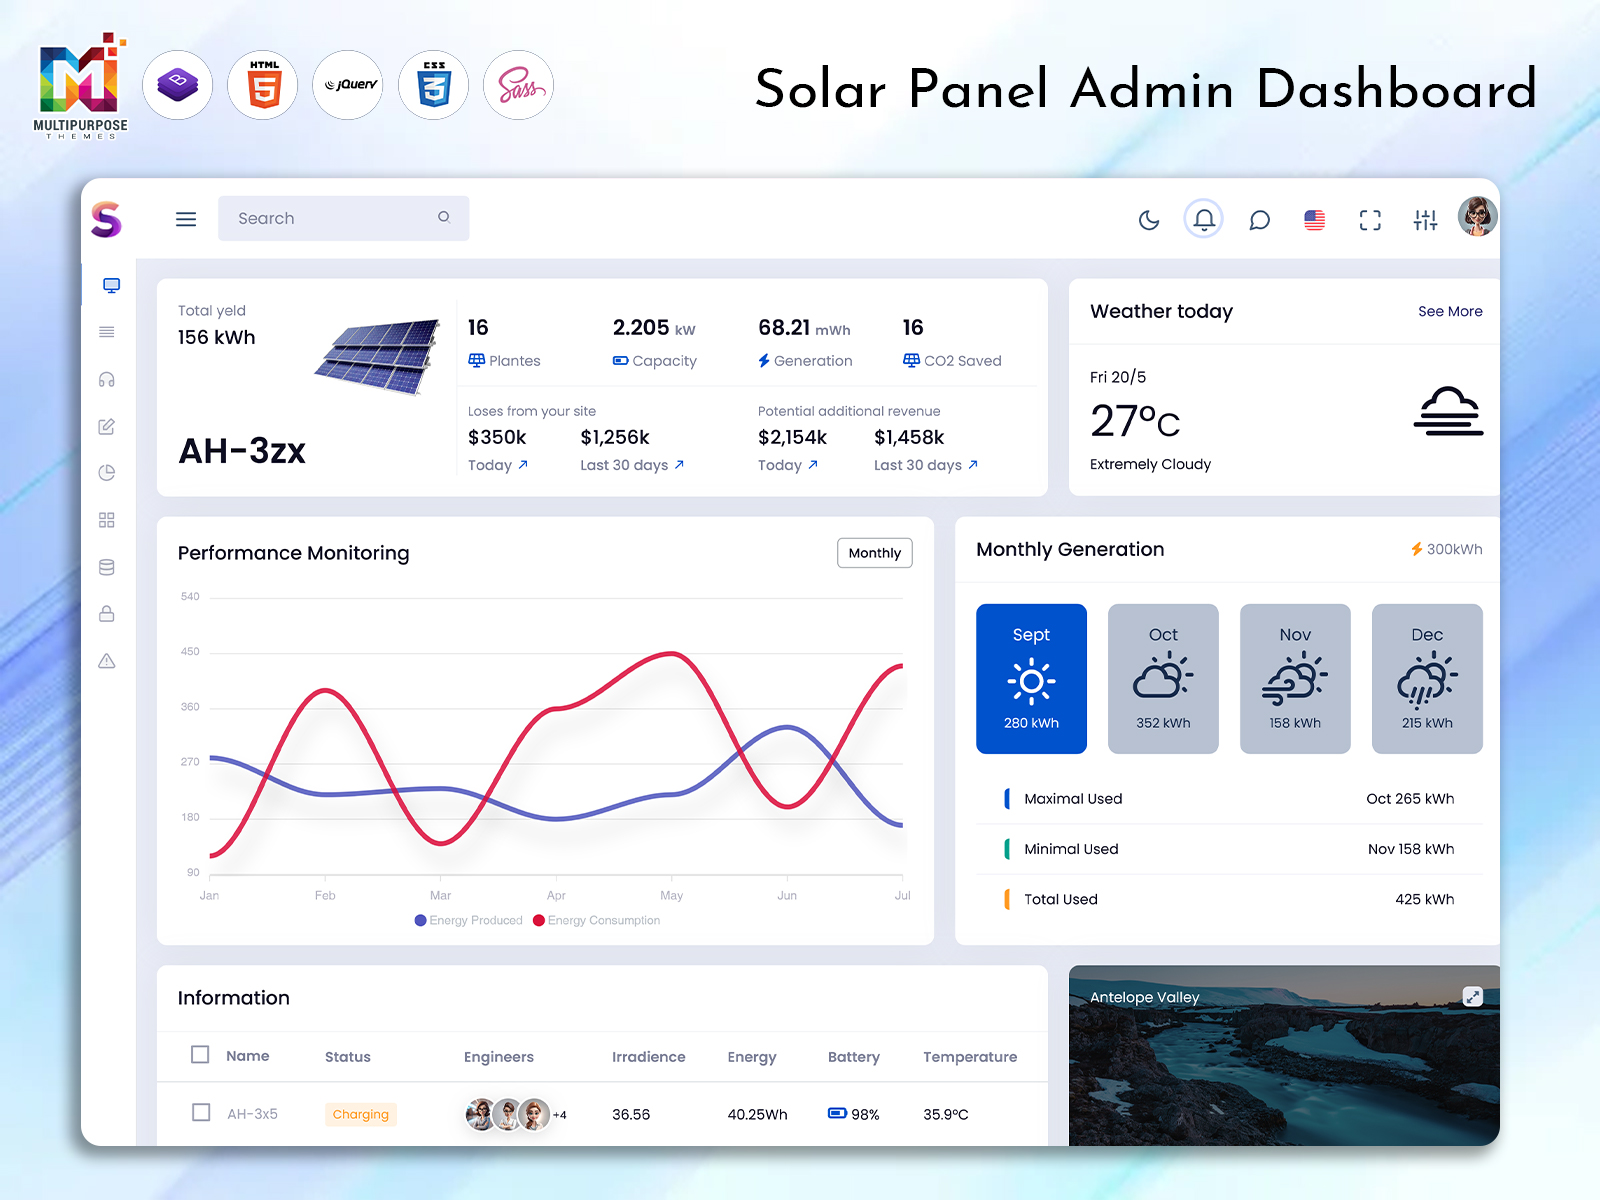
A Solar Dashboard is becoming an essential digital tool in the renewable energy world. As solar power systems grow more advanced, the need to monitor, analyze, and predict solar energy output accurately has increased. At the center of this progress is solar irradiance sensor data, which measures the amount of sunlight reaching solar panels. A Solar Dashboard helps convert this raw sensor data into meaningful insights that support better energy planning, system optimization, and performance prediction.
By combining real-time data with historical trends, a Solar Dashboard allows users to understand how sunlight intensity affects energy generation. This makes solar systems more reliable, efficient, and predictable for both small and large-scale applications.
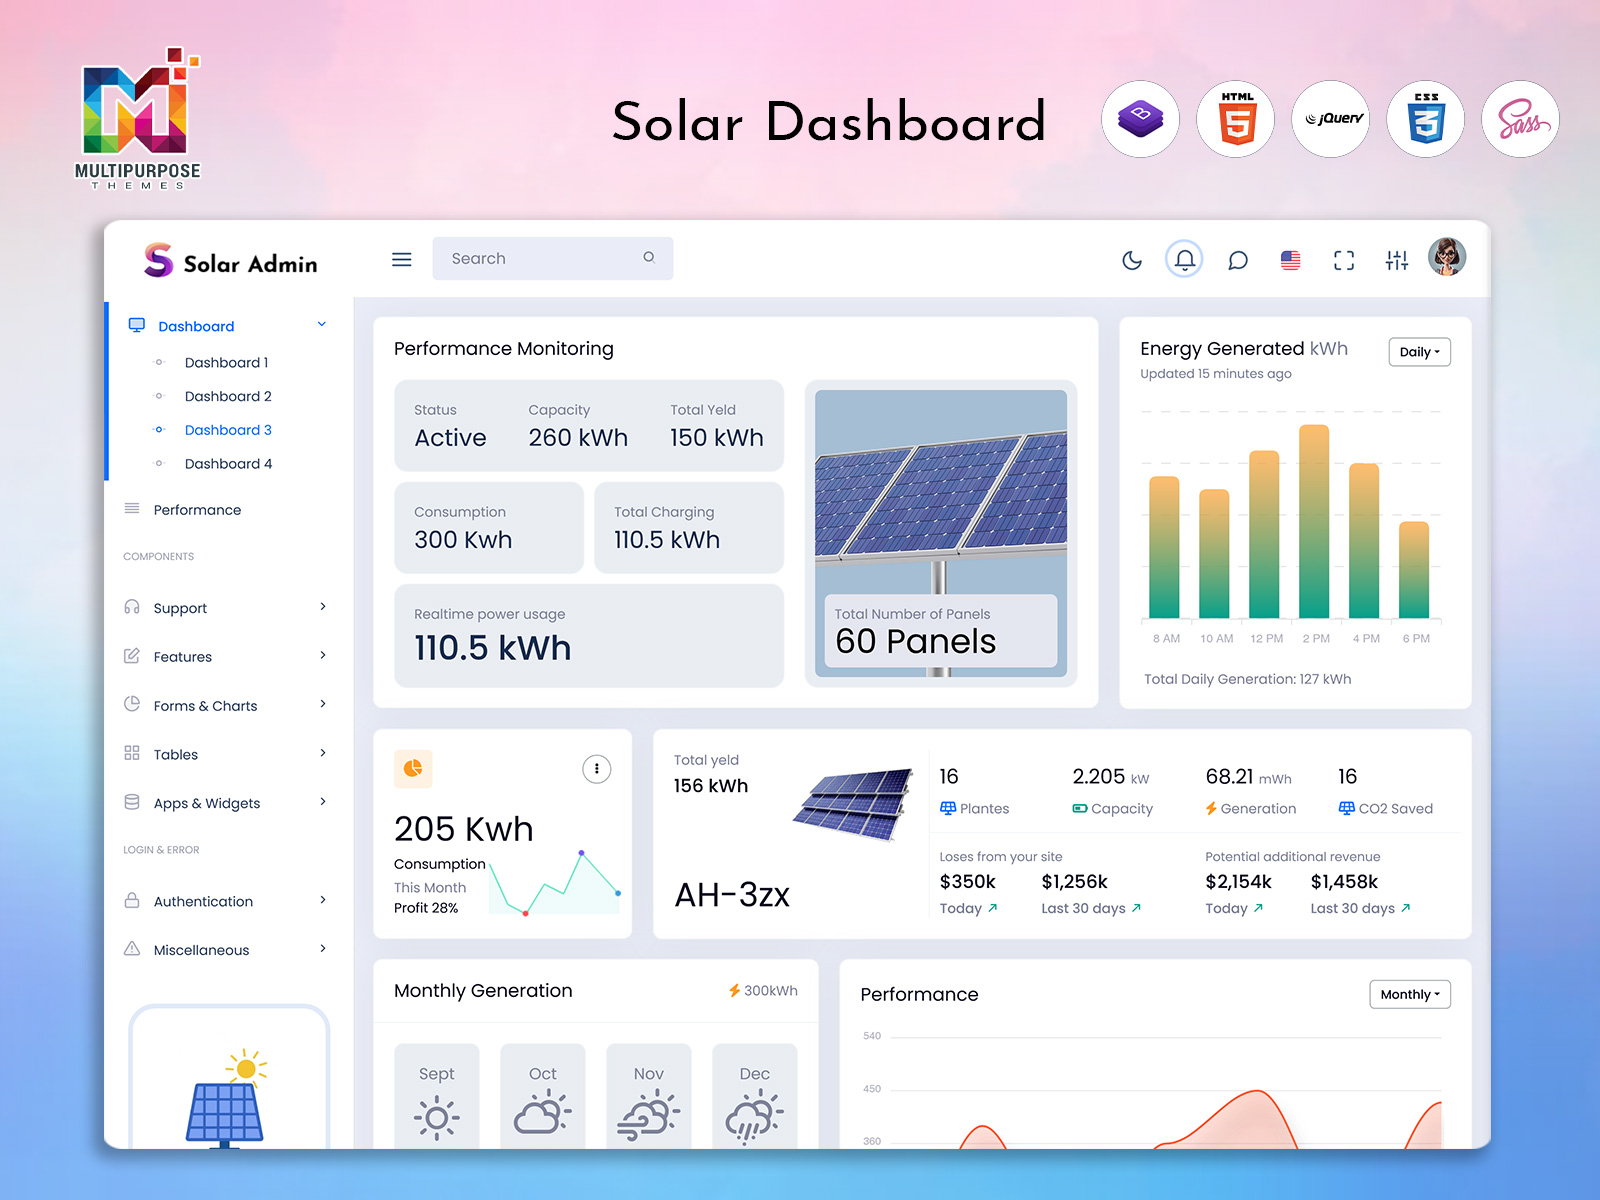
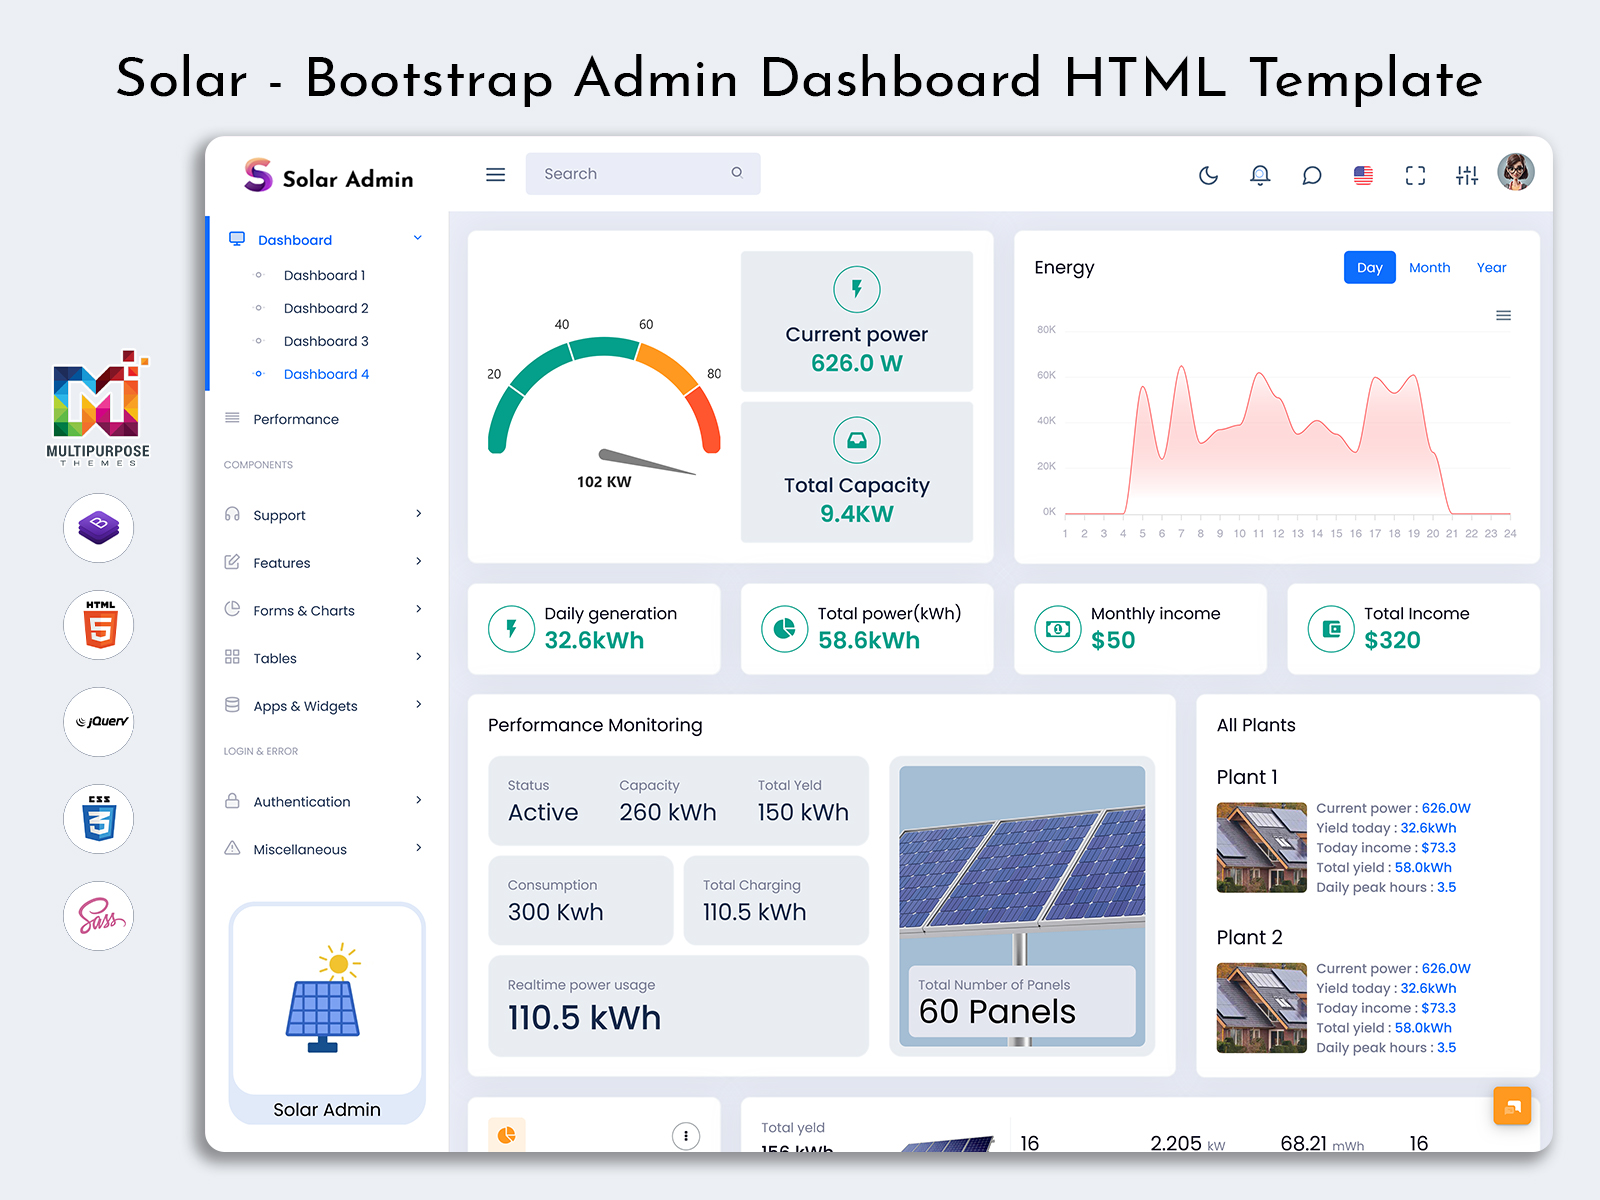
Explore Solar Dashboard Design
Dashboard: 1
BUY NOW DEMO
Dashboard: 2
BUY NOW DEMO
Dashboard: 3 (New)
BUY NOW DEMO
Dashboard: 4 (New)
BUY NOW DEMO
Understanding Solar Irradiance and Its Impact on Solar Energy
Solar irradiance refers to the power of sunlight received per unit area. It directly influences how much electricity a solar panel can produce. Solar irradiance sensors continuously measure sunlight levels, including changes caused by clouds, weather conditions, time of day, and seasonal variations.
Without proper visualization, irradiance sensor data can be difficult to interpret. A Solar Dashboard organizes this data into a clear and readable format. It helps users see patterns in sunlight availability and understand how environmental conditions impact solar energy production. This insight is critical for predicting output and improving overall system efficiency.
Role of a Solar Dashboard in Irradiance Data Analysis
A Sun-based Dashboard acts as the bridge between complex sensor data and human understanding. It collects data from solar irradiance sensors and displays it in a structured way. Users can observe real-time irradiance values, historical trends, and performance correlations with energy output.
By analyzing irradiance data through a Admin Dashboard, users can identify peak sunlight hours, seasonal performance changes, and unexpected drops in solar intensity. This information supports smarter energy decisions and allows systems to operate closer to their maximum potential.
Sun-powered Dashboard for Predicting Solar Energy Generation
Prediction is one of the most valuable features of a Sun-powered Dashboard. Using past solar irradiance sensor data, the dashboard can help forecast future energy production. This is especially useful for energy planning and load management.
Predictive insights allow users to anticipate power availability and adjust energy usage accordingly. Industries can plan operations during high solar availability, while grid-connected systems can balance solar input more effectively. A Solar Bootstrap 5 Dashboard turns irradiance data into actionable predictions rather than just static numbers.
Solar Charging Dashboard and Irradiance-Based Charging Decisions
A Solar Charging Dashboard focuses on how solar energy is stored and used for charging batteries or energy storage systems. Solar irradiance data plays a key role here, as charging efficiency depends heavily on sunlight intensity.
By analyzing irradiance sensor data, a Sun-powered Charging Dashboard helps optimize charging cycles. It ensures batteries are charged efficiently during peak sunlight periods and protected during low irradiance conditions. This improves battery lifespan and enhances overall energy reliability, especially in off-grid and hybrid solar systems.
Solar Meter Dashboard and Irradiance Correlation
A Sun-powered Meter Dashboard provides detailed insights into energy generation, consumption, and grid interaction. When combined with solar irradiance sensor data, it becomes even more powerful. Users can compare actual energy output with expected output based on irradiance levels.
This comparison helps identify system losses, equipment inefficiencies, or environmental issues such as shading or dust accumulation. A Solar Meter Dashboard supported by irradiance data ensures accurate performance evaluation and transparent energy reporting.
Solar System Dashboard for End-to-End Visibility
A Sun-powered System Dashboard brings together all components of a solar setup, including panels, inverters, meters, batteries, and irradiance sensors. It provides a complete view of how sunlight is converted into usable energy across the system.
With irradiance data integrated, a Solar System Dashboard helps users understand the relationship between sunlight input and system output. It allows operators to detect faults early, maintain system health, and ensure long-term performance stability.
Monitoring Solar Panel Performance Using Irradiance Data
Solar Panel Performance cannot be evaluated accurately without considering solar irradiance. A drop in energy output does not always indicate a panel issue; it may simply be due to reduced sunlight. A Sun-powered Dashboard helps distinguish between these scenarios.
By comparing panel output with irradiance sensor readings, users can determine whether panels are operating efficiently. This ensures fair performance assessment and prevents unnecessary maintenance actions. Over time, this data-driven approach improves system reliability and cost efficiency.
Integration of Solar Designing Software with Solar Dashboards
Solar Designing Software is used to plan and simulate solar systems before installation. When integrated with a Solar Dashboard, it allows users to validate design assumptions using real irradiance sensor data.
This integration helps engineers and designers compare predicted output with actual performance. It improves future designs and ensures that solar systems are optimized for specific locations and sunlight conditions. A Sun-powered Dashboard combined with Solar Designing Software creates a complete lifecycle solution for solar energy projects.
Web-Based Solar Dashboards for Centralized Monitoring
Many organizations now use Solar Energy Dashboards through web applications to manage multiple solar installations. Web-based dashboards allow centralized access to irradiance data from different locations, making it easier to compare performance across regions.
These dashboards are especially useful for companies operating solar plants at scale. Decision-makers can access real-time and historical data remotely, ensuring faster response to performance issues and better strategic planning.
Firms That Need Solar Dashboards with Irradiance Sensor Data
Solar energy companies rely heavily on Solar Dashboards to monitor and optimize their installations. EPC firms, solar installers, and maintenance providers use dashboards to ensure systems perform as expected under varying sunlight conditions.
Manufacturing industries with large rooftop solar systems need Solar Power Dashboards to align production schedules with solar availability. Accurate irradiance-based predictions help reduce energy costs and improve operational efficiency.
Energy research firms and renewable energy consultants use Admin Dashboards to analyze irradiance trends and prepare performance reports. These insights help clients make informed investment and expansion decisions.
Utility companies and power distribution firms use Solar Meter Dashboards supported by irradiance data to manage grid stability and energy forecasting. Educational institutions and research centers also depend on these dashboards for solar studies and training programs.
Technology startups building clean energy platforms integrate Solar Dashboards into their web and mobile applications. These dashboards become a core feature that delivers value to end users through transparency and control.
Solar Dashboards for Mobile Applications and Smart Energy Systems
Modern Solar Dashboards are often available as mobile applications, allowing users to access irradiance data anytime. These apps provide instant visibility into sunlight conditions and energy production.
Smart energy systems use irradiance-based insights from Sun-powered admin Dashboards to automate decisions. Appliances, charging systems, and energy storage units can respond dynamically to sunlight availability, making solar power more efficient and user-friendly.
Importance of Data Accuracy and Reliability
Solar irradiance sensor data must be accurate and consistent to deliver meaningful insights. A well-designed Admin Dashboard ensures proper data validation and reliable visualization.
Accurate data builds trust among users and supports long-term planning. Historical irradiance data stored in the dashboard also helps in performance benchmarking and trend analysis, which are essential for continuous improvement.
Future of Solar Admin Dashboards and Irradiance Analytics
The future of Solar Dashboards lies in advanced analytics and predictive intelligence. As technology evolves, dashboards will use machine learning to improve irradiance-based forecasts and system recommendations.
Future Solar Dashboards will not only display data but also guide users on how to maximize energy generation. This evolution will further strengthen the role of dashboards in sustainable energy management.
Conclusion: Solar Power Dashboard as a Data-Driven Solar Intelligence Tool
A Solar Dashboard focused on solar irradiance sensor data transforms sunlight measurements into valuable intelligence. From Sun-powered Charging Dashboard and Solar Meter Dashboard to complete Solar System Dashboard solutions, every component benefits from accurate irradiance analysis.
By connecting Solar Panel Performance insights with Solar Designing Software, a Admin Dashboard supports smarter planning, monitoring, and prediction. It serves homeowners, businesses, industries, and energy firms alike.
FAQs
What is a Solar Dashboard?
A Solar Dashboard is a digital platform that shows real-time and historical data of a solar power system. It helps users monitor energy generation, system health, and performance using data collected from solar panels, meters, and irradiance sensors.
What is solar irradiance sensor data?
Solar irradiance sensor data measures the amount of sunlight reaching the solar panels. This data is important because solar energy production depends directly on sunlight intensity. A Bootstrap Dashboard uses this data to analyze and predict solar power output.
How does a Solar energy Dashboard use solar irradiance data?
A Sun-powered Dashboard collects irradiance sensor data and converts it into visual insights. It helps users understand how sunlight changes throughout the day and how those changes affect solar energy generation and system performance.
What is the benefit of predicting solar energy using a Admin Dashboard?
Predicting solar energy helps users plan energy usage better. With irradiance-based predictions, industries, utilities, and building owners can manage loads, reduce energy costs, and improve overall efficiency.
What is a Solar Charging Dashboard?
A Solar Charging Dashboard focuses on battery charging and energy storage. It uses solar irradiance data to optimize charging cycles, protect batteries, and ensure efficient energy storage during peak sunlight hours.
How does a Solar Meter Dashboard work with irradiance data?
A Solar Meter Dashboard shows how much energy is generated, consumed, or sent to the grid. When combined with irradiance data, it helps compare expected output with actual output, making it easier to detect system losses or inefficiencies.
Why is solar irradiance data important for Solar Panel Performance?
Solar Panel Performance cannot be judged accurately without irradiance data. Low energy output may be caused by low sunlight, not panel failure. A Solar Admin Dashboard helps separate environmental effects from technical issues.
Can Solar Designing Software work with a Admin Dashboard?
Yes, Solar Designing Software can integrate with a Bootstrap Dashboard. This allows users to compare planned solar output with real performance based on actual irradiance sensor data, improving future system designs.
Which firms need a Sun-powered Dashboard with irradiance data?
Solar EPC companies, renewable energy firms, utility providers, manufacturing industries, commercial buildings, research institutions, and clean energy startups all benefit from Sun-powered Dashboards for web apps, websites, and mobile applications.
Is a Solar Dashboard useful for web and mobile applications?
Yes, Solar Dashboards are widely used in web and mobile applications. They allow remote monitoring, real-time alerts, and easy access to irradiance and performance data from anywhere.
Does a Admin Dashboard help in long-term solar planning?
Yes, by storing historical irradiance and performance data, a Admin Dashboard supports long-term planning, system optimization, and investment analysis for solar projects.
Related Posts


This Post Has 0 Comments