
In today’s fast-moving digital landscape, data is one of the most valuable assets for any…

New Upgraded Power BI Admin Dashboard Launched for Modern Developing Firms
Reading Time: 6 minutes
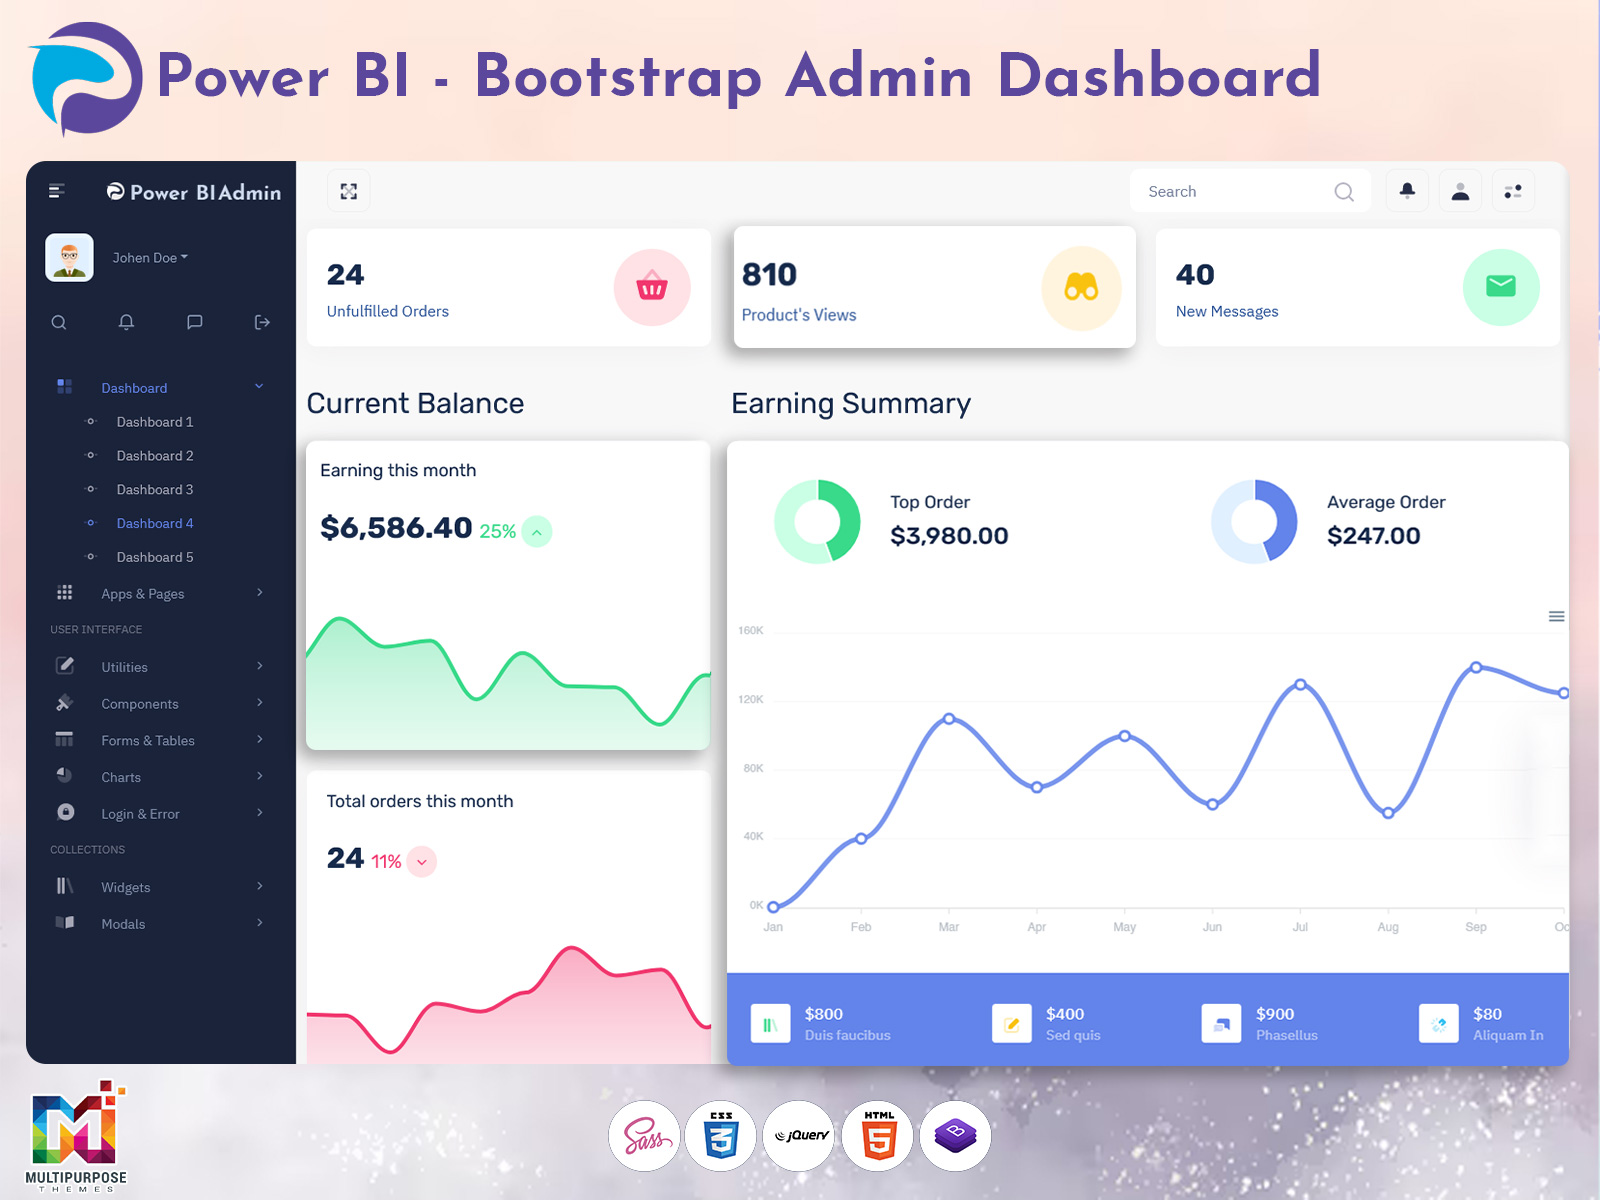
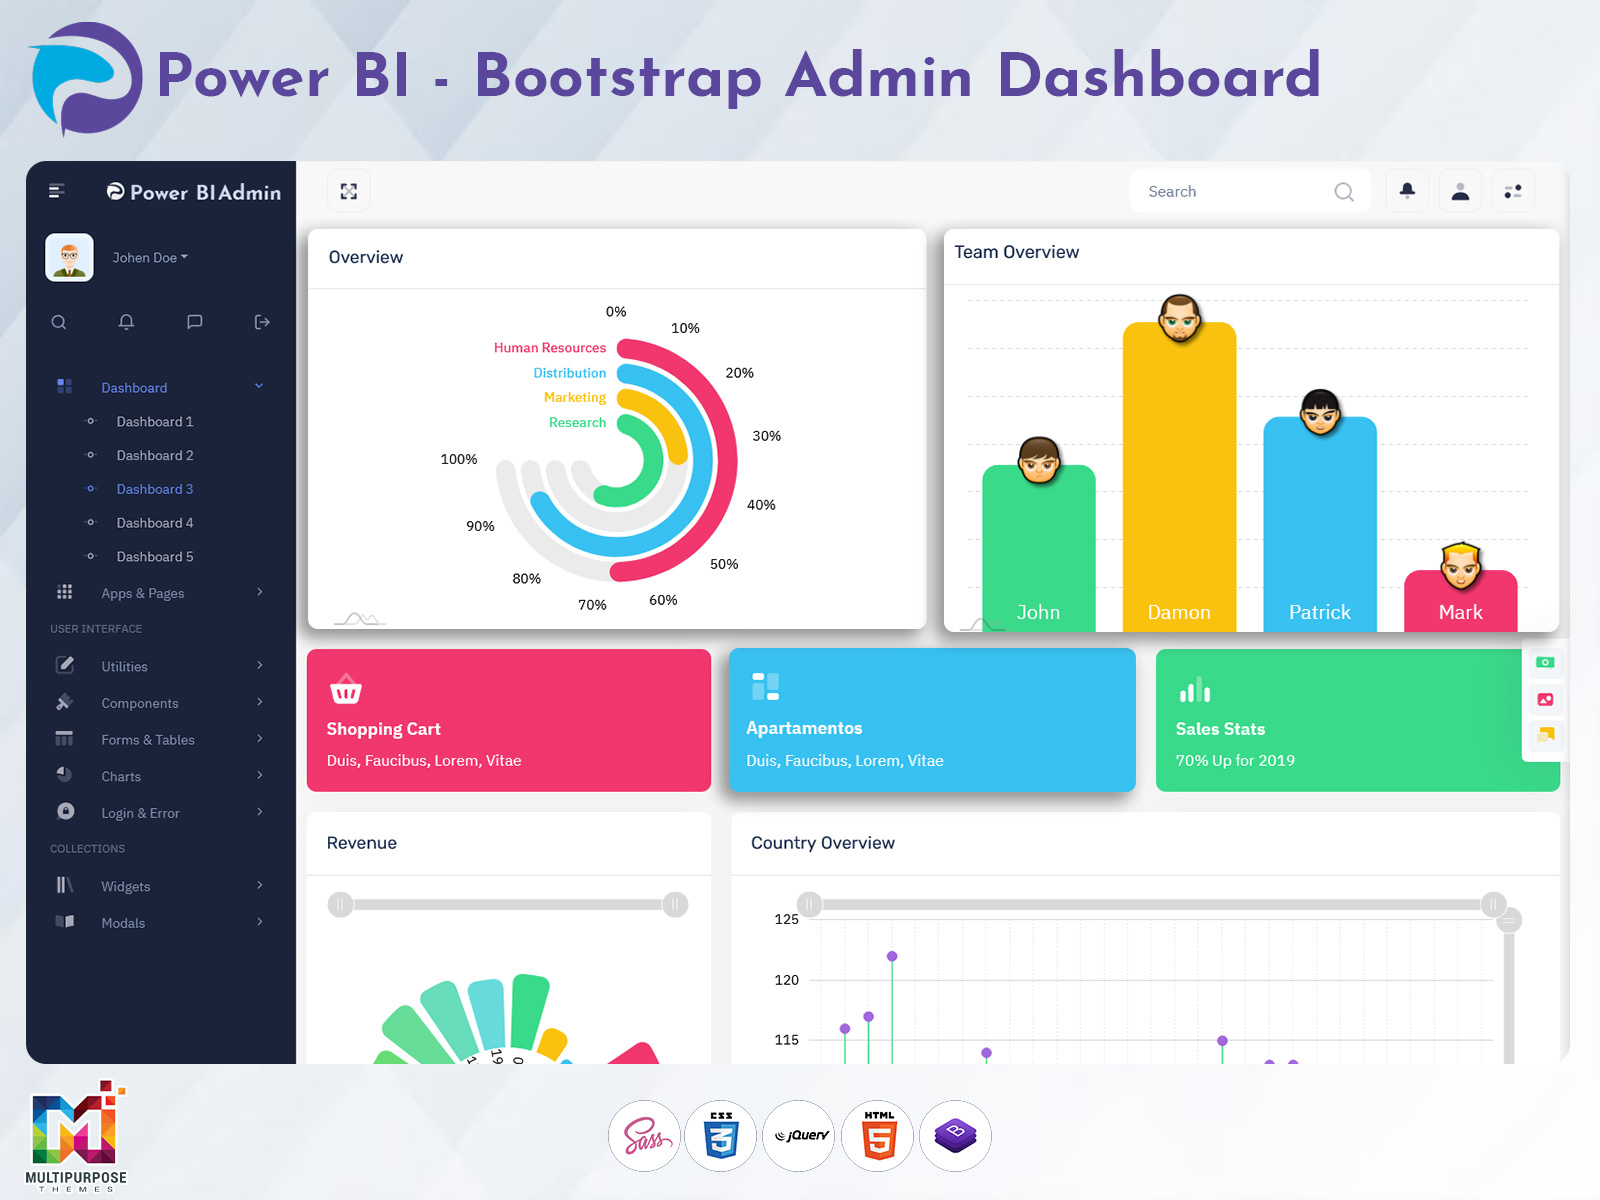
We are excited to announce the launch of our newly upgraded Power BI Admin Dashboard, designed specifically to enhance the experience of managing and customizing Power BI analytics with far more flexibility, speed, and visual clarity. Built with powerful usability improvements and modern UI enhancements, this new release transforms how businesses interact with business intelligence data, monitor performances, and handle reporting at scale.
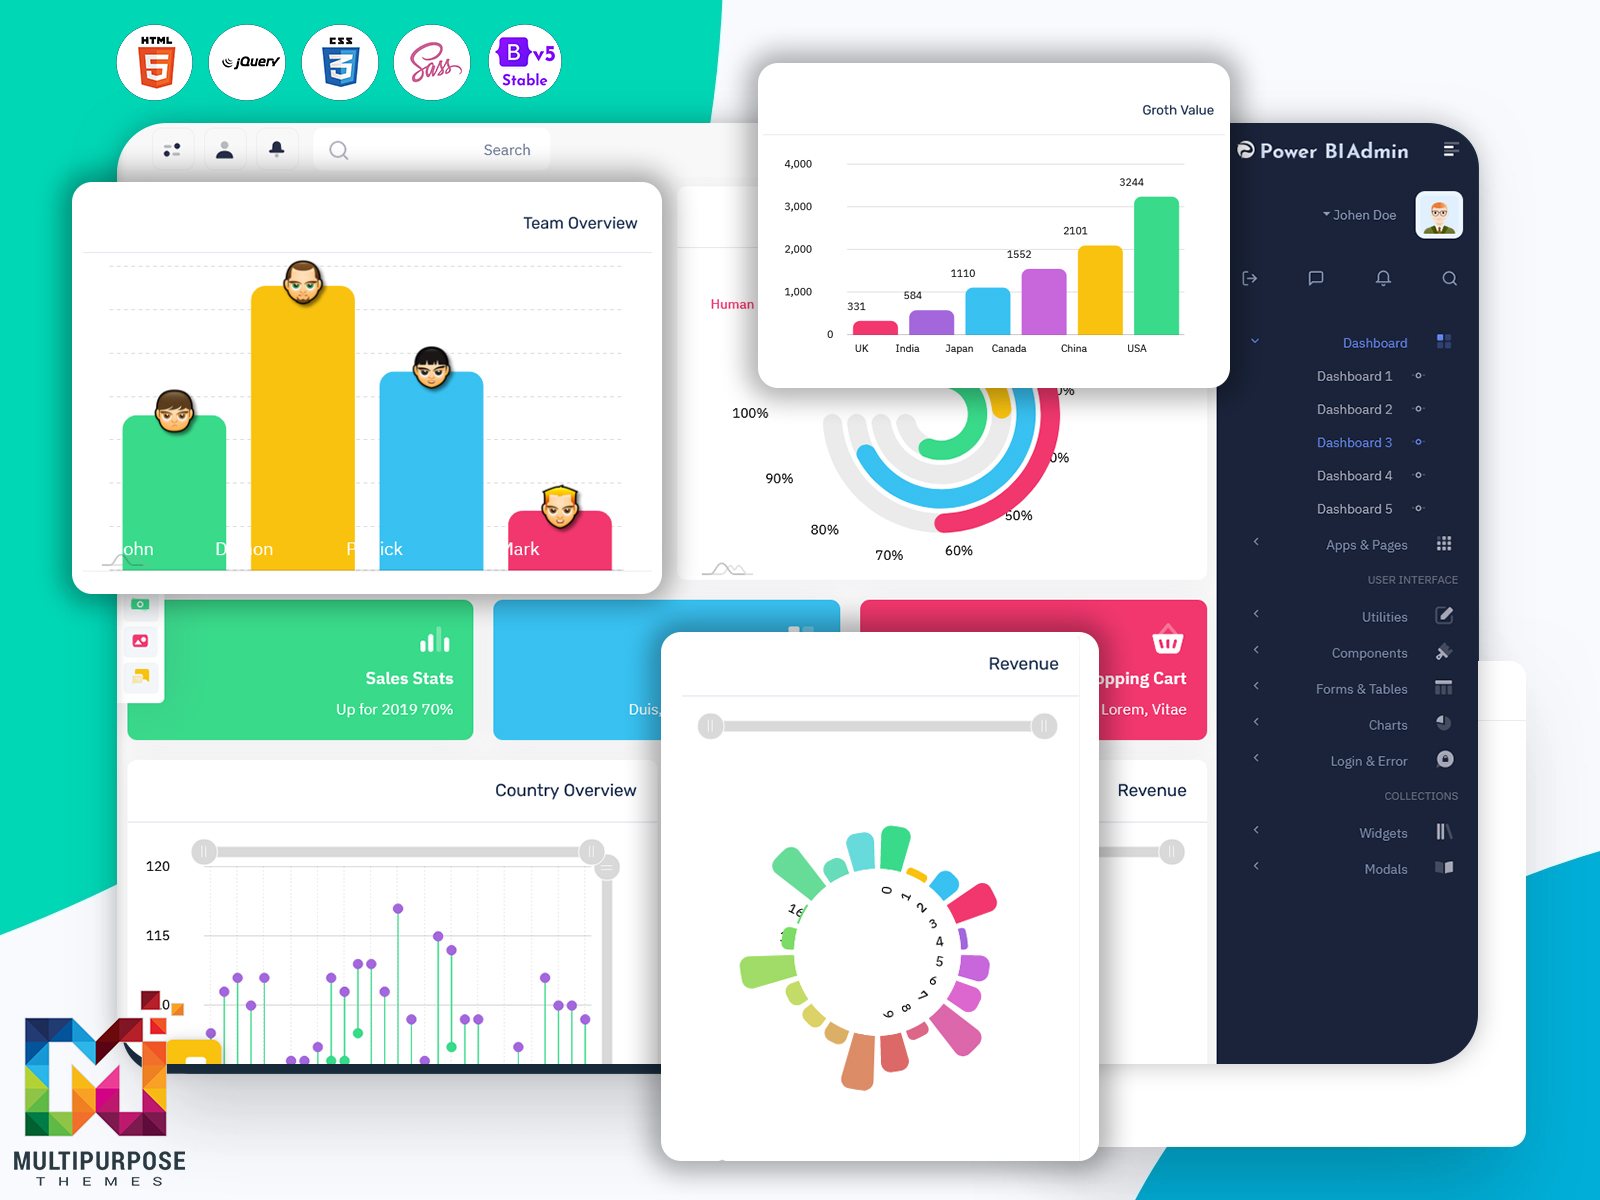
Our upgraded design is built on top of a highly optimized Power BI Admin Template, engineered using the latest technologies like Bootstrap 5 Dashboard architecture and a flexible Power BI UI Framework. Whether you are an enterprise data manager, a BI analyst, or a development team handling dashboards for clients, this new design ensures a seamless, intuitive, and performance-driven interface.
This new Dashboard Template offers improved layout usability, responsive design, real-time monitoring capabilities, advanced performance analytics, and better accessibility settings, enabling organizations to streamline dashboard workflows and eliminate the complexity of controlling multiple Power BI reports. It’s the perfect solution for teams that want to manage data and performance smarter, faster, and more confidently.
Built for scalability and reliability, the upgraded Power BI Admin Dashboard now allows users to handle large datasets, track system health, monitor reports, customize widgets, and share insights more efficiently than ever before. It delivers a true next-level business intelligence experience, going beyond traditional dashboards by providing modern UI elements, improved visual hierarchy, optimized performance graphs, and actionable insights all in one interface.
Explore Dashboard Design

BUY NOW DEMO
Features of Our New Upgraded Power BI Admin Dashboard
Below are the upgraded and newly introduced features, each explained in detail:
1. Advanced Power BI Report Monitoring
One of the biggest improvements in our upgraded Power BI Admin Template is the enhanced report monitoring system. Administrators can now easily track the live status of all Power BI reports and dashboards, ensuring that they remain updated, optimized, and visible to the right users. The monitoring panel highlights report refresh frequencies, accessibility status, performance issues, and dataset health.
If a report is failing, loading slowly, or showing incomplete data, the dashboard instantly flags the problem and provides alerts. This saves valuable troubleshooting time that administrators previously spent manually checking multiple reports. With deeper performance insights and smart notification capabilities, decision-makers can ensure that mission-critical dashboards always run smoothly.
This new feature helps organizations maintain consistency and reliability while scaling their BI operations across multiple teams, departments, or clients.
2. Customizable Widget & Layout Management
The upgraded dashboard interface now supports fully customizable layouts and modular widgets, allowing users to create their perfect workspace. With this enhancement, each user can rearrange sections, modify chart styles, change visualization types, or adjust the layout based on specific operational priorities.
This flexibility helps analysts and organizations visualize various Power BI metrics—like revenue performance, customer analytics, or operational efficiency—based on their priorities rather than relying on rigid fixed layouts. Custom widget management gives decision-makers more control and personalization, helping them quickly identify actionable insights without scrolling through irrelevant data.
Whether you need a clean, minimal overview or a deeply detailed analytical interface, this customization capability supports both power users and beginner BI analysts.
3. Real-Time Data Health & Pipeline Performance Tracking
Our upgraded Power BI admin dashboard introduces a powerful data health tracking system that gives administrators a clear understanding of how well datasets and pipelines are functioning. Instead of waiting for end-users to face data loading problems, admins can now proactively detect issues such as broken pipelines, slow data refreshes, missing values, or connectivity time-outs.
This feature is essential for enterprises that handle multiple databases, real-time APIs, and constantly updating metrics. With detailed logs, performance visualization graphs, and issue reporting tools, this dashboard ensures high uptime and business continuity. The system also highlights which datasets are performing effectively and which require immediate attention.
This makes data quality management smarter, faster, and more reliable—empowering teams to make confident decisions based on accurate information.
4. Enhanced Performance Visualization & Usage Analytics
Our new design includes advanced visualization tools that track user behavior and Power BI report usage patterns. Administrators can now access detailed analytics about which reports are opened frequently, which dashboards contribute the highest engagement, and which ones are underutilized.
This is particularly beneficial when prioritizing improvements, minimizing design clutter, or allocating data resources effectively. With clear visual feedback and structured reporting tools, admins can improve dashboard relevance and user experience across the organization.
This performance insight helps companies evaluate BI ROI (Return on Investment) and refine data presentation strategies to maximize value.
5. Enterprise-Grade Security & Access Control
Data security and access permissions are among the primary concerns of any business intelligence system. The upgraded dashboard now provides a much more streamlined approach to user-level access control, role-based permissions, and report distribution.
Organizations can now easily define who can view, edit, download, share, or manage specific reports with a clean and intuitive permission control interface. It also supports auditing logs, tracking data interactions, and preventing unauthorized access or accidental data leakage.
With security improvements built into the Power BI UI Framework, this Dashboard Template supports compliance, governance, and secure enterprise operations.
6. Fully Responsive & Optimized Bootstrap 5 Dashboard Design
Our updated Dashboard UI is developed using a modern Bootstrap 5 Dashboard structure, offering high-speed UI rendering, responsive layouts, and compatibility across all devices—desktop, laptop, tablet, and mobile.
This ensures uninterrupted dashboard management even on the go, helping teams make decisions more flexibly. Lightweight code, optimized components, improved transitions, and usability improvements contribute to smoother performance even with large datasets.
With clean modern design and user-first layout architecture, this update ensures ease of use for all technical and non-technical users.
Types of Web Development That Need This New Dashboard Design
This upgraded dashboard is a perfect fit for a wide variety of development environments and industries that rely on data visualization and analytics. Below are examples of domains that will benefit most:
1. Enterprise Software & Corporates
Large-scale organizations and enterprise management systems depend heavily on real-time data monitoring and multi-level reporting. The updated Power BI Admin Dashboard supports distributed teams, multi-department workflows, and consolidated KPIs in one place.
Enterprises can use this dashboard to track financial performance, workforce productivity, project timelines, and operational KPIs at scale. With advanced performance visualization and secure access management, large businesses can achieve faster decision-making and better resource allocation. It simplifies BI infrastructure across different departments such as HR, finance, operations, and supply chain.
2. Digital Agencies & IT Service Companies
Agencies that develop dashboards or analytics solutions for clients require a flexible and customizable Dashboard Template that can be modified quickly according to client needs.
The new design supports dynamic widget configuration, custom branding options, and rapid layout adjustments, helping agencies deliver professional-grade dashboards efficiently with reduced development time. It also improves client presentation, making data easier to understand and visually impressive—ideal for product demos, BI consulting, and project reporting.
3. SaaS (Software-as-a-Service) Platforms
SaaS platforms dealing with reporting, AI analytics, automation, or CRM systems require reliable, scalable, and aesthetically pleasing dashboards.
The upgraded Power BI Admin Template provides real-time performance tracking, modular UI structure, and modern responsive design suitable for SaaS integration. It decreases maintenance effort and enhances customer usability, making SaaS platforms more competitive and user-friendly.
4. Financial & Banking Applications
Financial institutions depend on high-accuracy dashboards that display revenue metrics, transaction volume, fraud detection alerts, expense tracking, and investment analytics.
The new dashboard supports fast rendering and high-volume data visualization, making it ideal for banks, insurance companies, and financial services platforms. Real-time alerts ensure risk management and better regulatory compliance.
5. Ecommerce & Retail Analytics Systems
For ecommerce companies, understanding real-time sales indicators, customer behavior patterns, and marketing performance is crucial.
This dashboard enables retailers to track product performance, conversion tracking, return statistics, seasonal buying trends, and inventory efficiency—all in one smart dashboard environment. Custom reporting improves forecasting and sales strategy planning.
6. Healthcare & Hospital Management Systems
Hospitals and medical analytics systems rely heavily on accurate and accessible data regarding patient records, appointment flows, resource management, and operational efficiency.
This new dashboard architecture supports analytics securely and visually, integrating performance monitoring tools ideal for healthcare BI solutions.
How Our Latest Dashboard Outperforms Other Admin Dashboard Solutions
Compared to other traditional Admin Dashboards, our upgraded Power BI Admin Dashboard stands out because of its advanced customization options, faster performance, enhanced usability, and powerful data monitoring features.
Where many dashboards focus only on visualization, ours provides deeper system visibility, proactive performance alerts, improved security, robust access control, and meaningful usage insights.
The flexibility of the Power BI UI Framework combined with a modern Bootstrap 5 Dashboard front-end makes the experience smoother, smarter, and far more efficient than standard fixed-layout dashboard solutions.
It’s not just about analytics—it’s about delivering the fastest, cleanest, and most manageable BI system that grows with your business.
Conclusion
The newly upgraded Power BI Admin Dashboard sets a new benchmark for business intelligence and dashboard management. It brings together modern UI design, advanced performance monitoring, customizable layout features, improved security, and an interactive analytics environment built for real-world challenges.
Whether you’re managing internal dashboards or client-facing BI applications, this enhanced Dashboard Template provides everything needed to maintain data accuracy, improve visualization, enhance productivity, and scale confidently.
This upgrade is more than a design improvement—it’s a strategic tool designed to help organizations make smarter decisions, faster.
FAQs
1. What is the Power BI Admin Dashboard?
It is a central management system used to monitor, control, and customize Power BI reports, dashboards, and datasets efficiently across teams and applications.
2. Who can benefit from this Power BI Admin Template?
Data analysts, BI managers, IT teams, enterprises, SaaS platforms, digital agencies, and reporting teams dealing with large datasets.
3. Is the new dashboard design mobile-friendly?
Yes, the new upgraded dashboard is fully responsive and built using Bootstrap 5, making it accessible across all devices.
4. Can I customize widgets and layouts?
Absolutely. The template includes a modular UI system that allows full customization based on business priorities.
5. What makes this dashboard better than others?
It offers deeper performance monitoring, advanced data health tracking, customizable UI, enterprise-grade security, and smarter user experience.
6. Can this dashboard integrate into custom applications?
Yes, it is built for integration and can be adapted to any modern web system.
Related Posts


This Post Has 0 Comments