

Most homeowners go solar to save money. But here is what many people miss —…

New Solar Dashboard for Admin Template with Real-Time Monitoring
Reading Time: 8 minutes
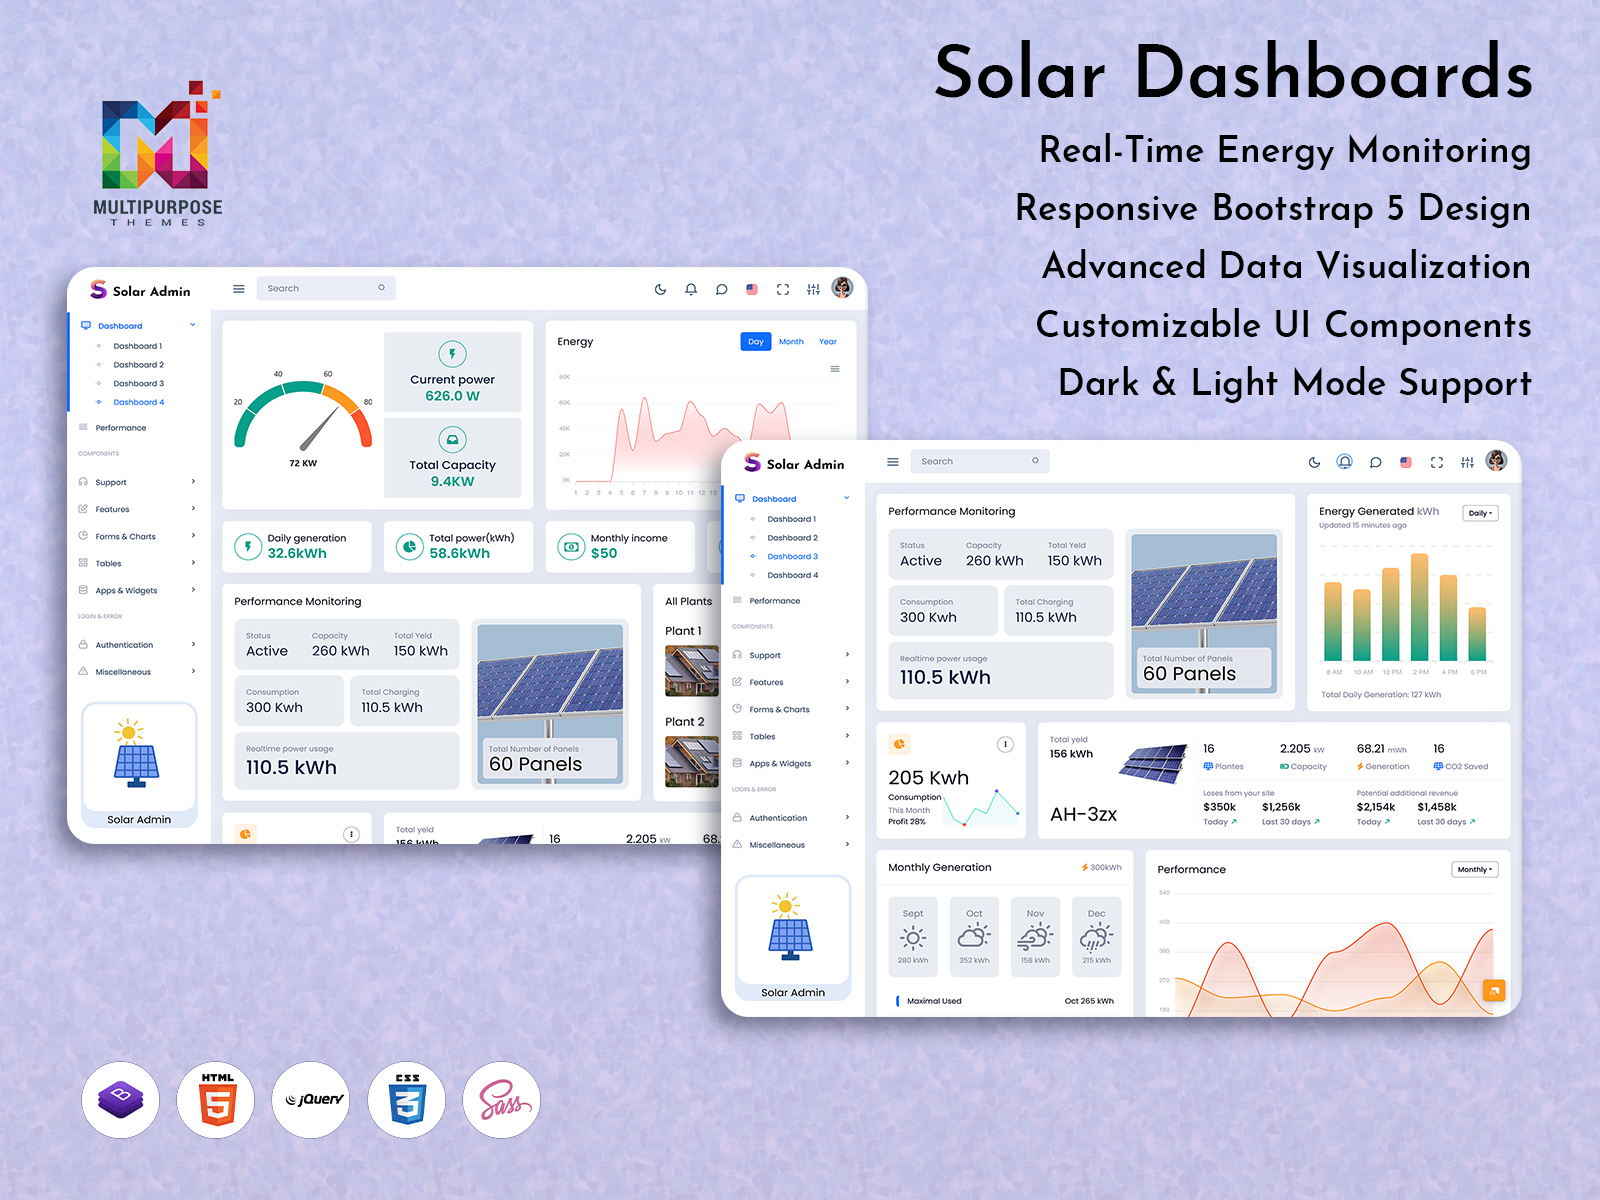
We are excited to introduce the newly upgraded Solar Dashboard design in our Solar Admin Template, created to enhance the monitoring and management experience for solar energy systems. As the global shift toward clean and renewable energy continues to grow rapidly, digital monitoring tools have become essential for ensuring efficiency, transparency, and performance accuracy. Our latest update focuses on delivering a smarter, more intuitive, and visually powerful interface that helps users track real-time solar production, consumption, system performance, and maintenance activities through a seamless digital environment.
This upgraded dashboard is built using the latest Bootstrap 5, ensuring an ultra-responsive and lightweight interface that adjusts perfectly across all screen sizes, including desktop, tablet, and mobile devices. Whether you are managing residential solar installations, commercial power plants, EV charging stations, or large industrial renewable energy networks, this updated Solar Meter Dashboard helps bring clarity to complex energy data and enables better decision-making.
Our mission behind this redesigned Solar Dashboard is to empower users with a modern interface that provides deeper insights into solar performance, energy trends, predictive maintenance, and operational status without overwhelming them with technical complexity. The dashboard is thoughtfully structured to allow anyone—from solar technicians to business owners and energy analysts—to monitor everything from one single place. With the new design, data interpretation becomes easy, actionable, and visually engaging.
This newly released Solar System Dashboard offers powerful visualization tools, interactive graphs, numeric widgets, and live notifications that help users stay informed about system output, performance health, efficiency metrics, cost savings, and sustainability contribution. Today’s world requires fast access to real-time data, and our Monitoring Dashboard is developed exactly for that purpose, delivering instant updates and clear insights with a clean, user-friendly experience.
View New Dashboard of Solar Admin

BUY NOW DEMO
BUY NOW DEMO
What’s New in the Updated Solar Dashboard Design
The new version of our Solar Dashboard includes significant improvements in UI structure, feature layout, responsiveness, data visualization, customization options, and performance optimization. Along with enhanced graphical analytics, users can now track live solar energy generation, grid output, battery storage, consumption levels, and daily/monthly comparison reports. The interface has been carefully built to reduce unnecessary complexity and help users focus on what matters most.
Users can instantly analyze variations in energy patterns, detect system drops, calculate how much power is being saved, and use historical data insights to make intelligent energy planning decisions. The dashboard also integrates real-time alerts and notifications to help identify and resolve system issues before they escalate. With flexible theme options like light mode, dark mode, RTL compatibility, and horizontal or vertical navigation layouts, the experience becomes even more adaptable and visually appealing.
This upgraded Solar Charging Dashboard is ideal for modern solar and EV charging businesses that rely on live system tracking and performance analytics. We created this improvement with the goal of delivering not only a visually attractive interface but also a dashboard that strengthens operational efficiency for solar companies and energy professionals.
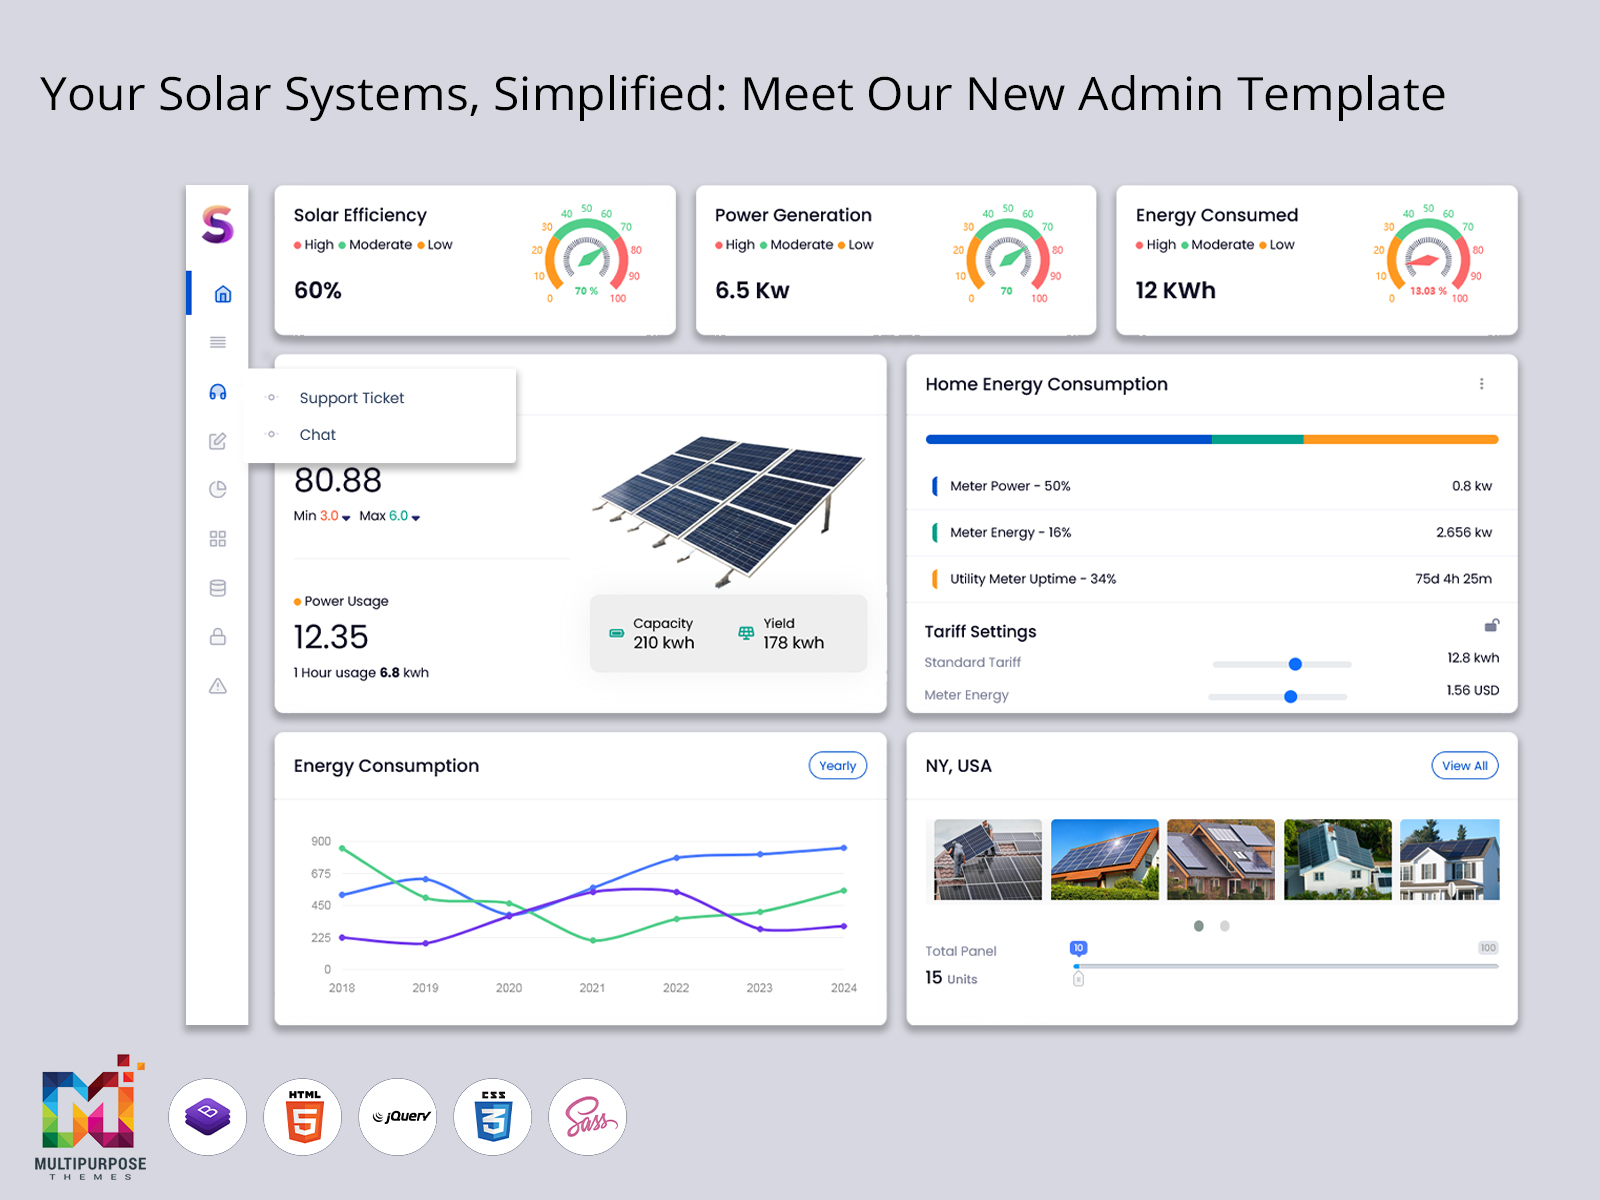
Real-Time Solar Meter Dashboard
One of the most important enhancements in this update is the new Real-time Solar Meter Dashboard, developed to help users track solar power generation and energy consumption round-the-clock. Real-time energy tracking is crucial today, as renewable energy systems depend heavily on accurate and continuous monitoring to ensure maximum efficiency and system reliability. This feature visualizes live readings of solar watt output, voltage levels, current flow, and panel performance, enabling users to monitor energy peaks and fluctuations instantly. It combines real-time metrics with performance insights to show exactly how much energy is being produced and consumed at any given moment.
Users can identify when solar generation is at its highest, when consumption exceeds production, and how efficiently the system is converting sunlight into electricity. This helps in adjusting loads, preventing system overload, optimizing energy usage, and reducing dependency on external grids. The live behavior of the system displayed through numeric counters, charts, and indicators provides complete control and clear visibility. Whether managing multiple solar installations or a single rooftop system, this feature brings transparency and actionable insights into daily performance through a visually engaging interface.
Interactive Solar Generation Analytics
The updated Solar Dashboard includes advanced and interactive analytics that help users review performance trends through various time-based data sets such as hourly, daily, weekly, and monthly comparisons. With advanced graphical charts and visual elements, the Solar Generation Analytics area transforms raw technical data into meaningful insights. Users can compare performance between different seasons, identify production patterns based on weather conditions, and calculate system ROI through visually rich trend analysis.
These analytics empower solar companies and system operators to evaluate efficiencies of installed panels, measure improvements after upgrades, and identify areas that may need performance optimization. The use of animated and interactive chart styles makes the experience intuitive rather than complicated. With support for multiple chart formats including bar charts, line graphs, comparison views, and real-time progress maps, solar monitoring becomes more engaging and highly informative. This feature plays a crucial role in planning energy distribution, predicting future demand, and maximizing solar output.
Responsive & Mobile-Friendly Layout
In modern technology environments, energy tracking must be accessible everywhere, not only from office desktops. Our redesigned Solar System Dashboard is fully responsive and optimized for smartphones, tablets, laptops, and all screen resolutions, providing a smooth and consistent experience across every device. The Bootstrap 5 framework ensures fast navigation, quick loading times, flexible grid structure, and simple adaptation to both landscape and portrait views.
Users managing solar plants, remote monitoring stations, or field operations can now easily check performance while traveling or working onsite. Every visual component restructures intelligently to maintain readability and usability on smaller screens. Graph sections automatically shift to single-column mode, widgets resize automatically, and navigation becomes simplified. This mobile-friendly design supports remote decision-making and ensures that critical system updates are never missed, regardless of device location. Whether accessing from mobile or desktop, the workflow remains clean, smooth, and uninterrupted.
Customizable Widgets & Cards
The updated Solar Dashboard includes a variety of customizable widgets and data cards that allow users to personalize their monitoring experience according to priority needs. These widgets display key information such as energy output, system health, cost savings, carbon offset, storage levels, solar radiation intensity, and EV charging status. Each widget can be rearranged, resized, or configured based on the importance of metrics for different types of operators including residential users, solar farm managers, or corporate facility managers.
Customization improves efficiency by bringing the most critical data to the top of the dashboard. Users can choose what information they want to see first and hide less relevant data from their workspace. With personalization features, the dashboard becomes more flexible and adaptive to different project requirements. These intelligent widgets transform raw system data into easy-to-understand visual summaries that help users take smarter decisions quickly. Customization also supports branding needs for companies that want to integrate their identity into the dashboard.
Multi-Theme Support
The newest version of our Monitoring Dashboard includes multiple visual theme options such as Light Mode, Dark Mode, RTL (Right-to-Left) support, and both Horizontal and Vertical layout navigation. These customization choices improve comfort, accessibility, and usability for different audiences. Light and dark mode options support different lighting conditions, reduce eye strain, and create a visually appealing interface suitable for extended monitoring environments.
RTL support ensures global usability for languages such as Arabic, Persian, Urdu, and Hebrew, opening opportunities for worldwide adoption. Theme options also help organizations maintain consistent branding styles across different platforms and devices. With layout flexibility, users can choose vertical menu navigation for a compact and modern workspace or switch to a horizontal layout for wider screen dashboards. These improvements contribute to creating a more versatile solar monitoring experience where users feel comfortable and in control of the interface environment.
Pre-Built UI Pages & Components
One of the biggest benefits of this updated Solar Dashboard is the availability of pre-built pages and UI components that significantly reduce development time. Instead of building dashboards from scratch, developers can quickly integrate ready-formatted pages such as system overview dashboards, analytics pages, device management screens, user profiles, EV charging status pages, alerts pages, and more. This allows faster project deployment and helps businesses launch solar monitoring products without long development cycles.
These pre-built components are designed with clean UI structure and reusable code patterns, supporting better scalability for complex applications. They can be customized easily to meet specific requirements and integrate smoothly into modern web applications. This helps startups, solar agencies, and enterprise developers move from idea to production at a much faster pace. With reusable modules and UI elements, development costs decrease and efficiency increases for long-term maintenance and enhancements.
Alerts & System Notifications
The updated Solar System Dashboard now includes real-time alerts and notifications to help users detect and respond to performance issues quickly. Solar energy systems require continuous health supervision, and early detection of problems can prevent major failures and costly downtime. This new alerting feature notifies users about sudden performance drops, maintenance requirements, unexpected shutdowns, weather risk impact, and abnormal energy fluctuations.
These smart notifications ensure immediate action and improve system reliability. Alerts can be configured for different levels of priority such as advisory alerts, warning alerts, and urgent alerts, giving users complete insight into the status of their solar equipment. Whether the system detects voltage irregularities, low production output, inverter malfunction, temperature spikes, or grid interruptions, users receive real-time updates on the dashboard or via connected devices. This feature transforms the dashboard into a proactive monitoring system that protects operational continuity while maximizing energy performance.
Discover More Dashboards of Solar
Dashboard: 1
BUY NOW DEMO
Dashboard: 2
BUY NOW DEMO
Dashboard: 3
BUY NOW DEMO
Who Can Use This Solar System Dashboard
This powerful and modern Solar Dashboard is designed for a wide range of industries and energy applications. It is ideal for solar energy companies managing multiple installations, monitoring service providers, distributed solar networks, IoT-based renewable energy solutions, EV charging stations, and industrial solar plants. It is also useful for residential community solar networks, sustainability agencies, government energy programs, and commercial building managers.
With customizable UI and integration capabilities, the dashboard can be adapted for energy analytics platforms, power distribution companies, research-based environmental projects, and solar engineering teams. The Solar Charging Dashboard helps EV infrastructure companies monitor charging energy performance, grid usage, and consumption efficiency. For enterprise-level solar solutions, the dashboard can manage thousands of installations from a centralized control panel with consistent performance and responsive visuals.
Conclusion
The new and fully redesigned Solar Dashboard brings a modern and highly intelligent monitoring solution for the renewable energy industry. By combining real-time data tracking, powerful analytics, responsive UI design, live alerts, and customizable components, it helps users understand their solar system performance better than ever before. This enhanced Solar Meter Dashboard provides a simplified and enjoyable user experience while supporting advanced energy insights and operational accuracy.
As clean energy continues to expand across the world, having a strong and efficient Monitoring Dashboard becomes a necessity rather than an option. Our new Solar System Dashboard is developed to meet these evolving needs and empower organizations to make data-driven decisions, improve energy output, and reduce operational risk. With this upgrade, building solar management platforms becomes faster, easier, and more powerful, helping companies lead confidently in the renewable energy space.
We welcome you to explore the new update and experience how this redesigned Solar Dashboard can transform the way you monitor and manage solar performance. Build your solar application faster, smarter, and more efficiently with our modern intuitive interface built in Bootstrap 5.
FAQs
1. What is a Solar Dashboard and why is it important?
A Solar Dashboard helps monitor real-time solar energy production, consumption, and system performance. It provides clear insights for better decision-making and improves overall energy efficiency.
2. How does the Solar Meter Dashboard help in live monitoring?
The Solar Meter Dashboard displays live generation, usage, voltage, and performance data. It allows users to track efficiency instantly and detect energy drops or abnormal system behavior quickly.
3. Is the Solar System Dashboard suitable for both small and large installations?
Yes, the Solar System Dashboard supports residential rooftop systems, commercial solar plants, and industrial networks, offering scalable features for any size of solar project.
4. Can I customize the Solar Charging Dashboard layout and widgets?
Yes, users can customize widgets, rearrange dashboard cards, choose themes, and personalize the interface to prioritize important metrics and create a smooth monitoring experience.
5. Do real-time alerts help in maintaining system performance?
Real-time alerts notify users about maintenance needs, performance issues, and failures so problems can be resolved before causing damage or energy loss.
6. Is the Monitoring Dashboard mobile-friendly and responsive?
Absolutely. Built using Bootstrap 5, it provides a smooth responsive experience on desktop, tablet, and mobile devices, supporting remote access anywhere, anytime.
Related Posts


This Post Has 0 Comments