

In today’s fast-moving digital world, education is no longer limited to classrooms and physical books.…
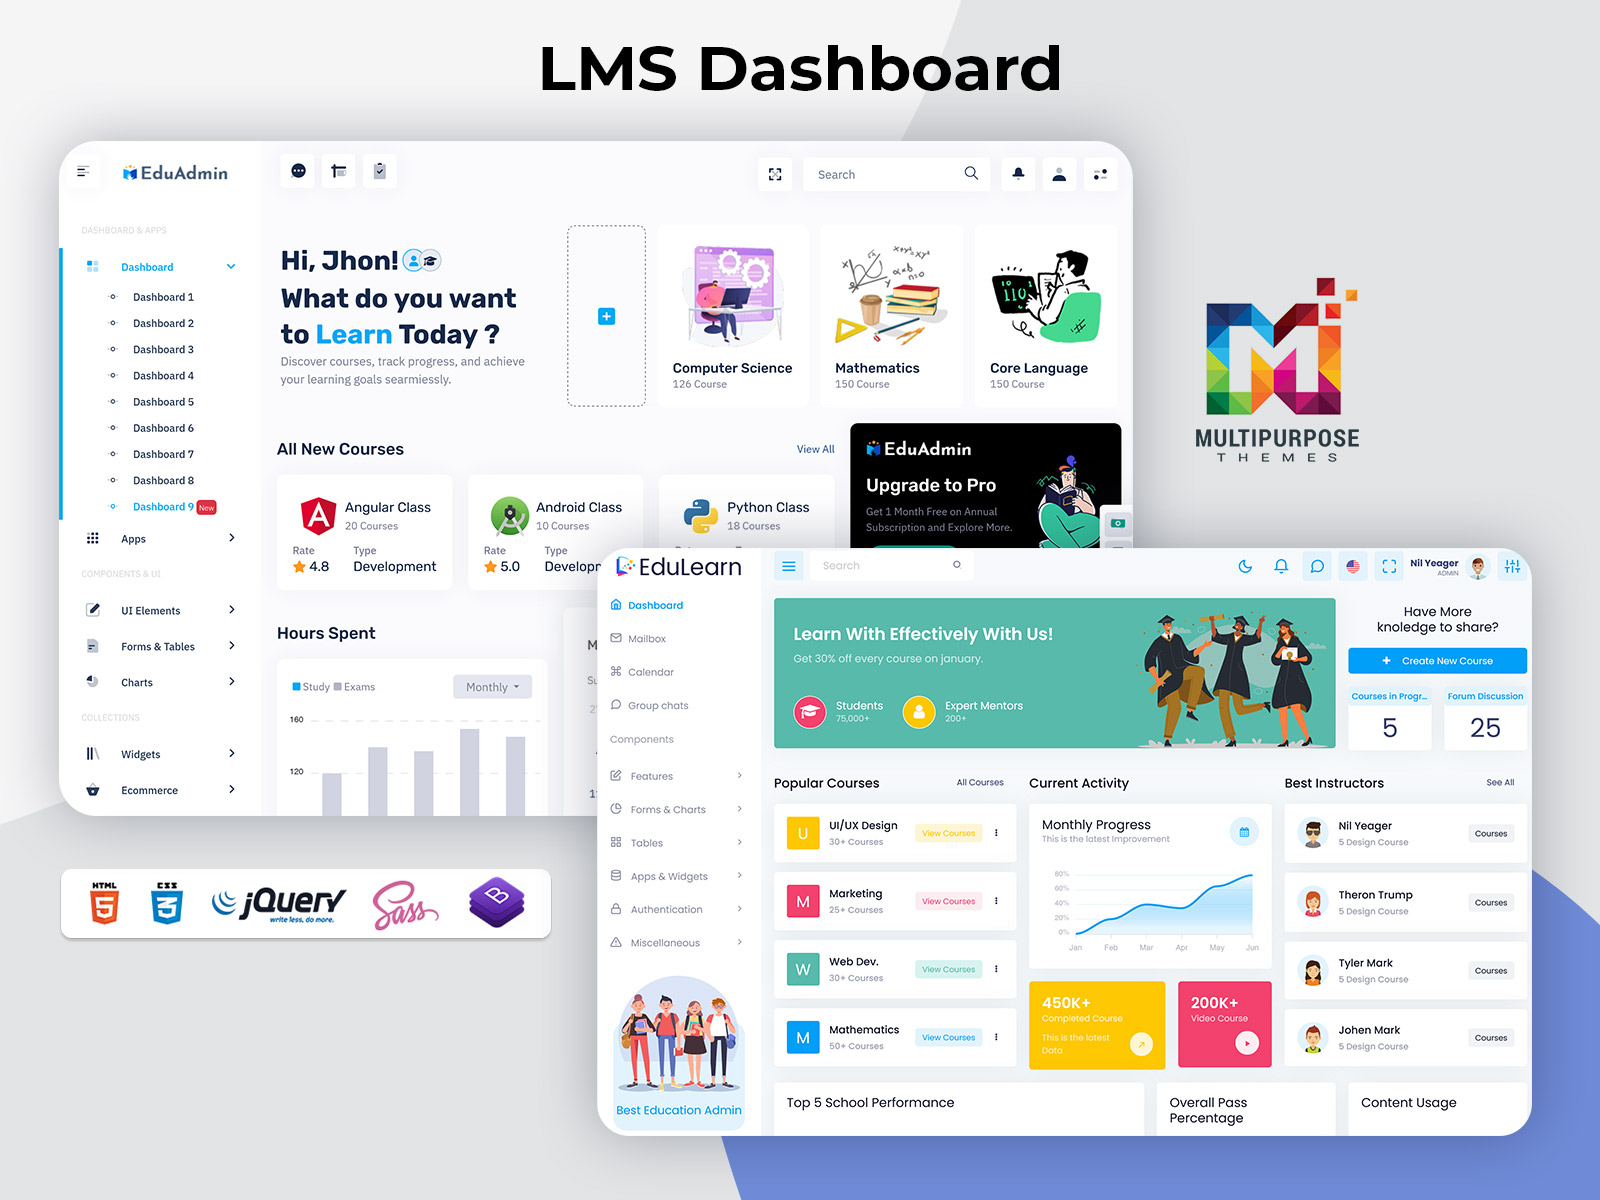
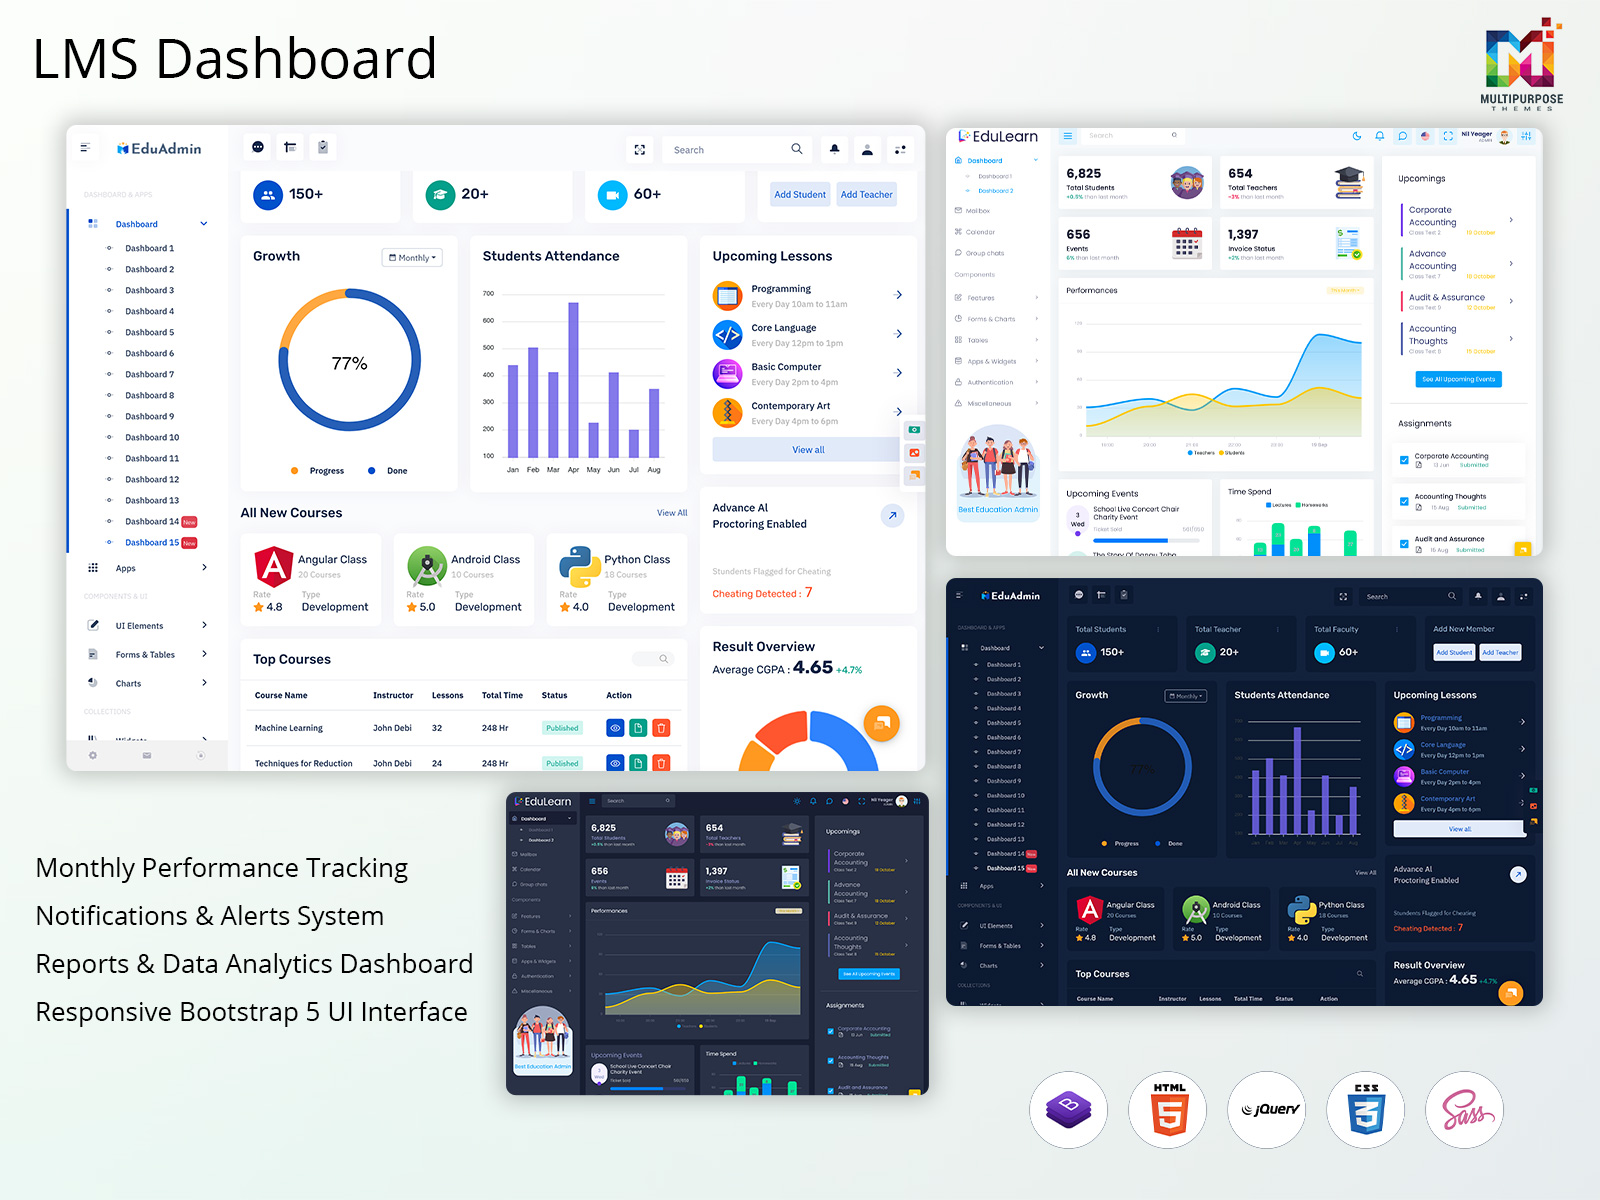
LMS Dashboard e-learning made easy with Learning Management Systems
Reading Time: 5 minutes
A learning management system (LMS) is an essential platform for educational institutions and businesses to host, manage, track, report on, and deliver online courses and training programs. A major component of any LMS is the dashboard – an information management tool that provides at-a-glance views of key data and metrics for different LMS users.
LMS Dashboard allow administrators, instructors, and learners to monitor engagement, participation, course effectiveness, and learner outcomes through data visualizations and analytics reporting. The right LMS dashboard brings together the most impactful numbers, stats, and insights in a visual format for rapid and easy assessment.
EduLearn Admin Dashboard
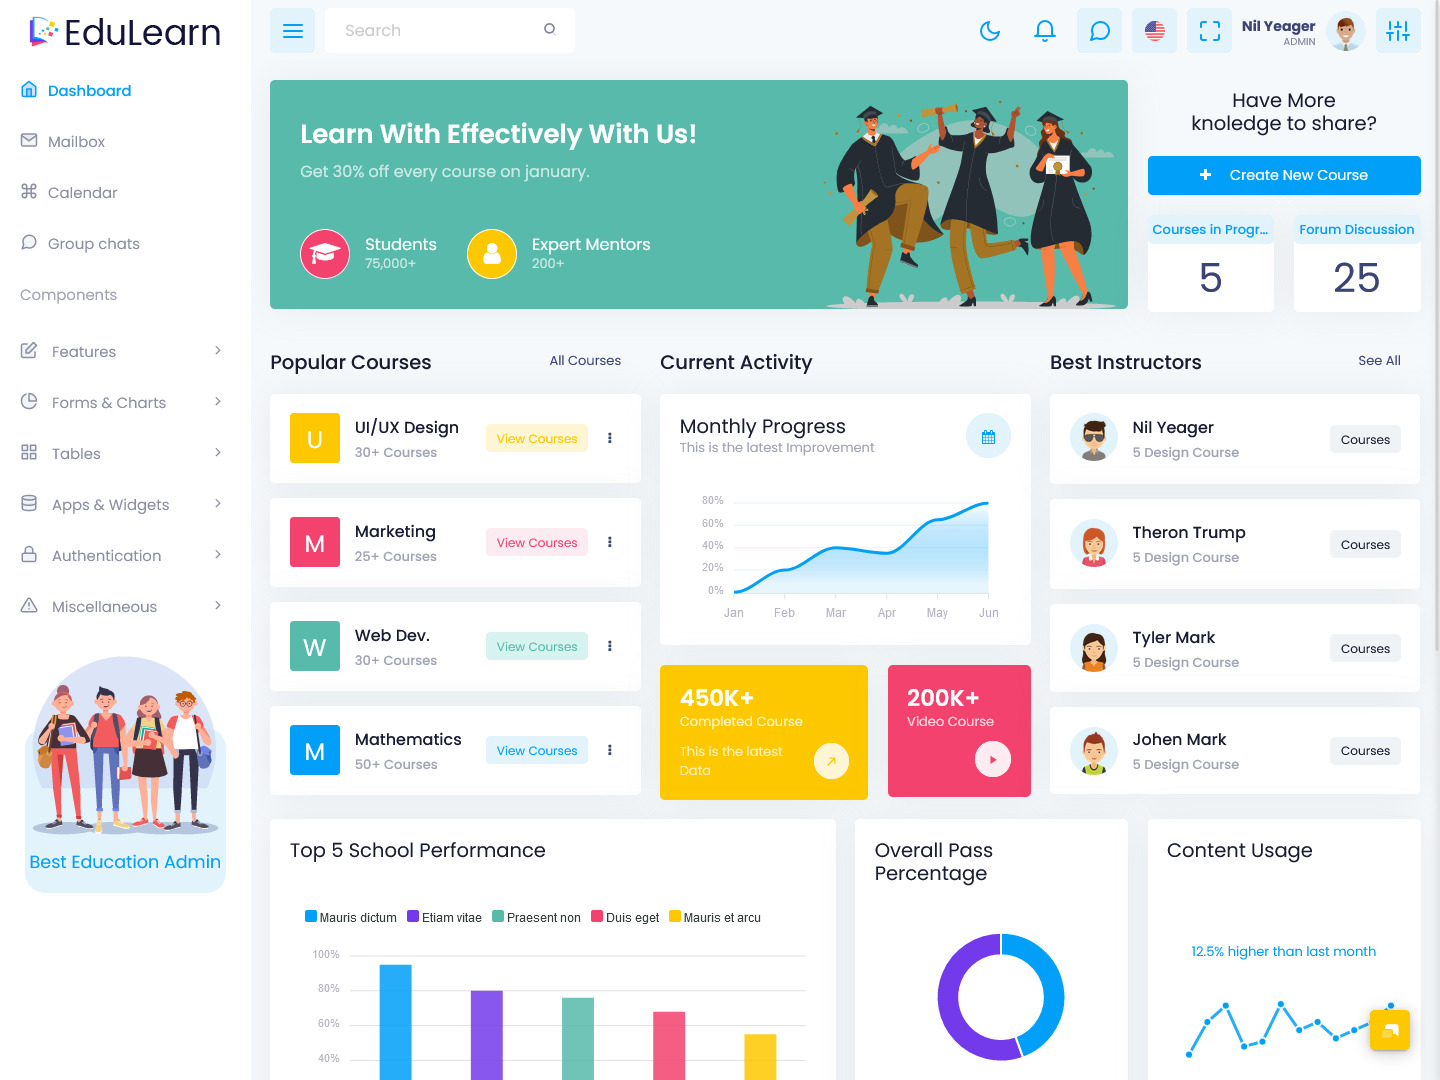
MORE INFO / BUY NOW DEMO
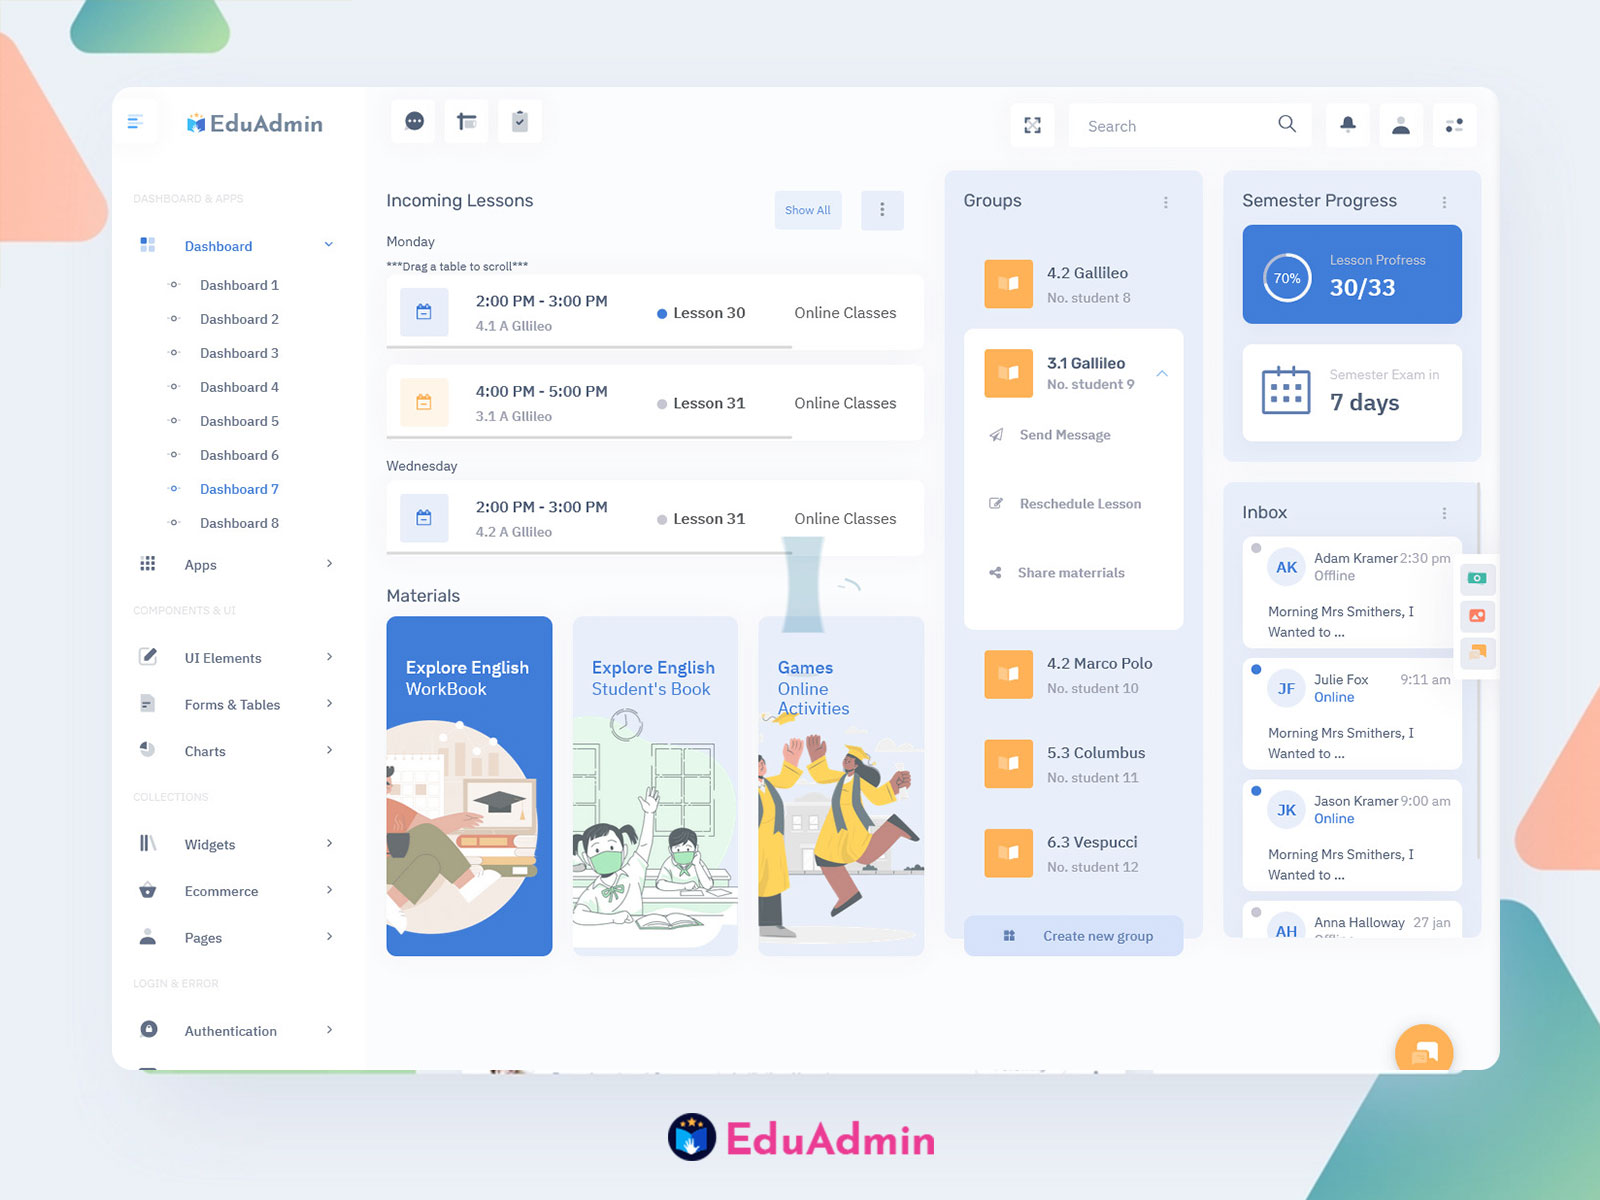
EduAdmin Dashboard
MORE INFO / BUY NOW DEMO
The Importance of Good LMS Dashboards
Optimized LMS Education Dashboard is hugely beneficial for tracking learning initiatives. The data and insights presented on LMS dashboards empower administrators and educators to:
- Monitor student progress and engagement
- Identify courses or content needing improvement
- Spot participation and retention issues
- Inform decisions around course structure, instruction plans, and resource allocation
- Track effectiveness of curriculum development strategies
Without the bird’s eye view provided by LMS dashboard analytics, it is much more difficult and time-consuming to discern learning trends and build strategies for boosting outcomes. Customizable dashboards also allow tailoring displayed data to different user needs – with students accessing engagement and progress stats, instructors reviewing course analytics, and administrators evaluating program-wide metrics.
Videos of EduLearn Admin
Videos of EdAdmin
Key Metrics to Include in LMS Dashboards
So, what should feature on your LMS Webapps dashboards to provide maximum value? Alongside selecting the right LMS platform, strategically determining dashboards metrics is vital. Below are some of the most impactful categories of data to include:
- Student Enrollment & Demographics
Get an overview of total active students, new vs returning learner breakdowns, country/state representations, age brackets, and other demographic groupings. Segment by academic department or corporate division as needed.
- Course Completion & Certification Rates
At both the macro and micro levels, course completion percentages provide tangible metrics for gauging learner retention, content efficacy, and areas needing improvement. Compare completion rates course-by-course and cohort-by-cohort.
- Assessment Scores & Grades
Centralized tracking of grades across different assessments helps instructors monitor student performance, mastery of concepts, and aid individuals struggling with particular materials.
- Content Access & Consumption
Valuable engagement metrics reveal content modules learners are accessing most/least, helping highlight strong vs weak areas of courses and where added content or instruction may lift outcomes.
- Attendance & Participation
User logins per course and frequency, content downloads, discussion forum views and posts, video views etc. showcase level of learner activity and involvement. Sudden participation drops or segments with low activity may require investigation.
- Satisfaction & Feedback Surveys
Dashboard inclusion of course and instructor satisfaction scores and student feedback survey results assists administrators in pinpointing popular courses to replicate and problem areas needing resolution.
Creating Better LMS Dashboard Templates
Rather than building Education Software Dashboard from scratch every time, dashboard templates allow for quick customization to meet organization or department requirements. LMS templates feature pre-built data visualizations, metric categories, color schemes, and layout formats.
Benefits of quality LMS dashboard templates include:
- Significant cuts in set-up time and effort
- Pre- integration of crucial metric categories
- Optimized visual design and layouts
- Ability to instantly edit and tailor
In selecting templates, check they allow changes to color schemes, data visualizations, and metrics displayed to match institutional branding and analytics goals. Ensure your provider issues updates as new LMS features and metrics emerge.
Using the template editor, administrators can showcase key statistics like enrollment numbers prominently atop the hierarchy display order and group other data clusters into sub-categories. Well-designed templates enable revisions without overhaul.
Best practices for dashboard UX design include:
- Establishing clear visual hierarchy focusing on most important metrics
- Intuitive navigation and data filtering options
- Charts, graphs and gauges to break up dense data
- Responsiveness across device sizes
Online Course Dashboards
In addition to centralized Learning Management System Dashboard with system-wide metrics, creating unique dashboards for individual online courses provides a micro-level perspective for instructors. These course-specific Elearning Dashboard zone in on engagement, comprehension, and learner progress within single classes.
Valuable course dashboard metrics include:
- Per course completion percentage
- Grade average and grade distribution analysis
- Unit, lesson, and assignment progress tracking
- Content module access and downloads analytics
- Discussion forum participation rates
- Assessment and quiz scores breakdown
Centralizing these measures through course-level dashboards allows instructors to identify topics learners excel or struggle with, boost lagging participation, deliver interventions to at-risk students, and continuously improve instruction delivery.
For example, a course dashboard may reveal:
- A sudden drop in participation during certain course units
- Assessment scores declining after introduction of new module
- Overdue assignments spiking after third week of term
- Video completion rates falling short of thresholds
Pinpointing such trends facilitates data-driven decisions to realign curriculum, update course materials, modify deadlines, intensify student outreach and provide academic support.
Within LMS platforms, steps for creating standalone online course dashboards include:
- Enable course analytics add-on if not in-built
- Access course dashboard editor interface
- Select visualization formats for metric data
- Import metrics from LMS analytics API integrations
- Filter, group, and display key course analytics
Quality course-specific dashboards, mirrored across all online classes and updated dynamically, are invaluable for boosting instruction standards, student success, and learning outcomes.
Final Words
As discussed throughout, optimized Online Classes Dashboard provide significant value via easy-to-interpret performance analytics leading to better administrational decision making and instructional strategies. They shine light on course shortcomings and provide goal benchmarks to scale learning impact – both at the macro level institutionally and for individual online courses.
Pre-built templates allow fast customization to focus LMS dashboards on key metrics like enrollment, course completion, learner engagement, satisfaction levels and more. Online course dashboards further filter insights to the cohort level for targeted improvements.
With their capacities to help track and enhance online education ROI plus inform strategic objectives, configurable online course dashboard should be a focal point of any LMS set-up and adoption roadmap. Their ability to help continually optimize course delivery, learning experience, and learner outcomes warrants significant investment. With the above best practices, education administrators can leverage Learning Management System Dashboard to their full potential.
Thanks for Taking the Time – We Appreciate Your Read!
Unlock More Smarter LMS Dashboards – Click for Demo or Buy Now!
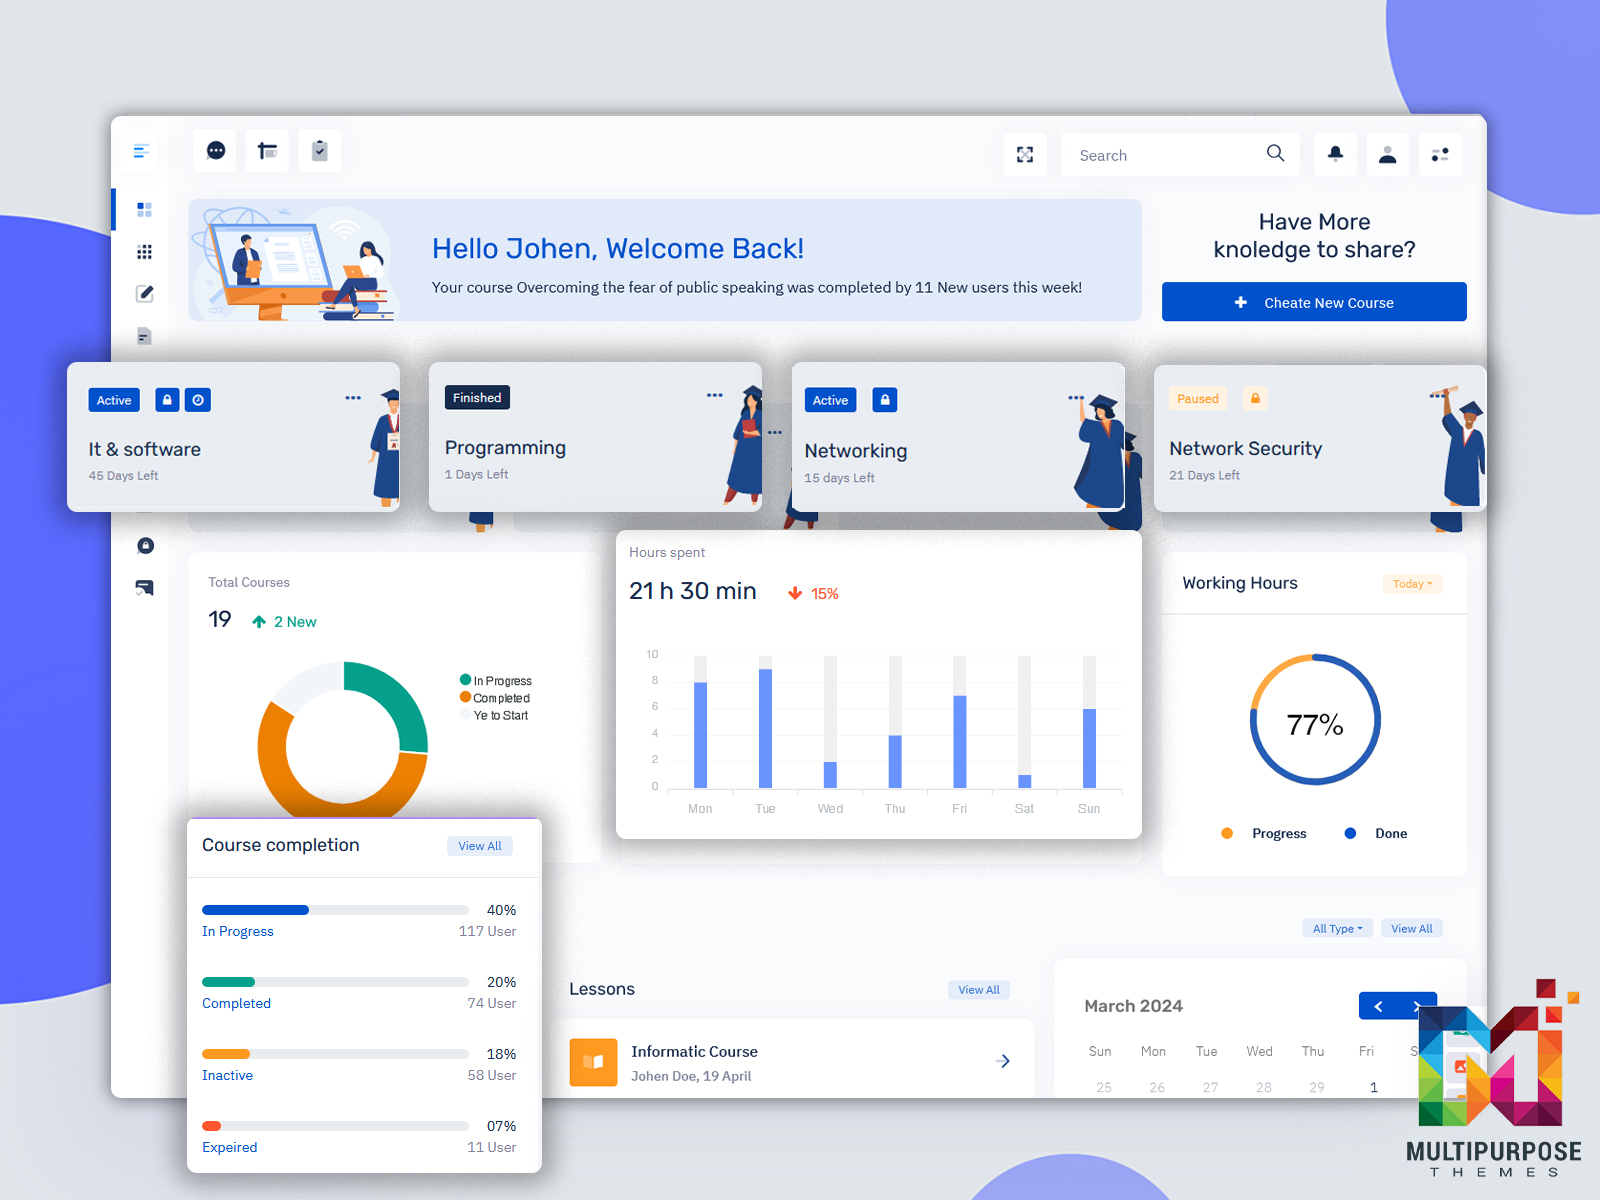
Gilded Admin – Education Dashboard
BUY NOW DEMO
Tresto Admin – School Dashboard
BUY NOW DEMO
BsinX Admin – LMS Dashboard
BUY NOW DEMO
CRMi Admin – University Dashboard
BUY NOW DEMO
Need More Templates? Explore Our Full Collection!
BUY NOW
Related Posts


This Post Has 0 Comments