
Most homeowners go solar to save money. But here is what many people miss —…
How Solar Dashboard Helps You Save Money and Energy
Reading Time: 6 minutes
With the rising importance of sustainable energy and eco-friendly living, solar power or Solar Dashboard has become a leading solution for both homeowners and businesses looking to reduce their carbon footprint and cut energy costs. As solar energy systems become more common, having the right tools to monitor and manage your solar setup is key to maximizing its efficiency and saving money. That’s where a Solar Dashboard comes in.
A Solar Dashboard is a digital platform that gives you a real-time overview of your solar power system’s performance. From monitoring energy production to keeping track of power consumption, it provides all the necessary information to ensure your solar energy system is running at peak efficiency. In this article, we will explore what a Solar Dashboard is, its importance, and how it can help you save both money and energy.
What is a Solar Dashboard?
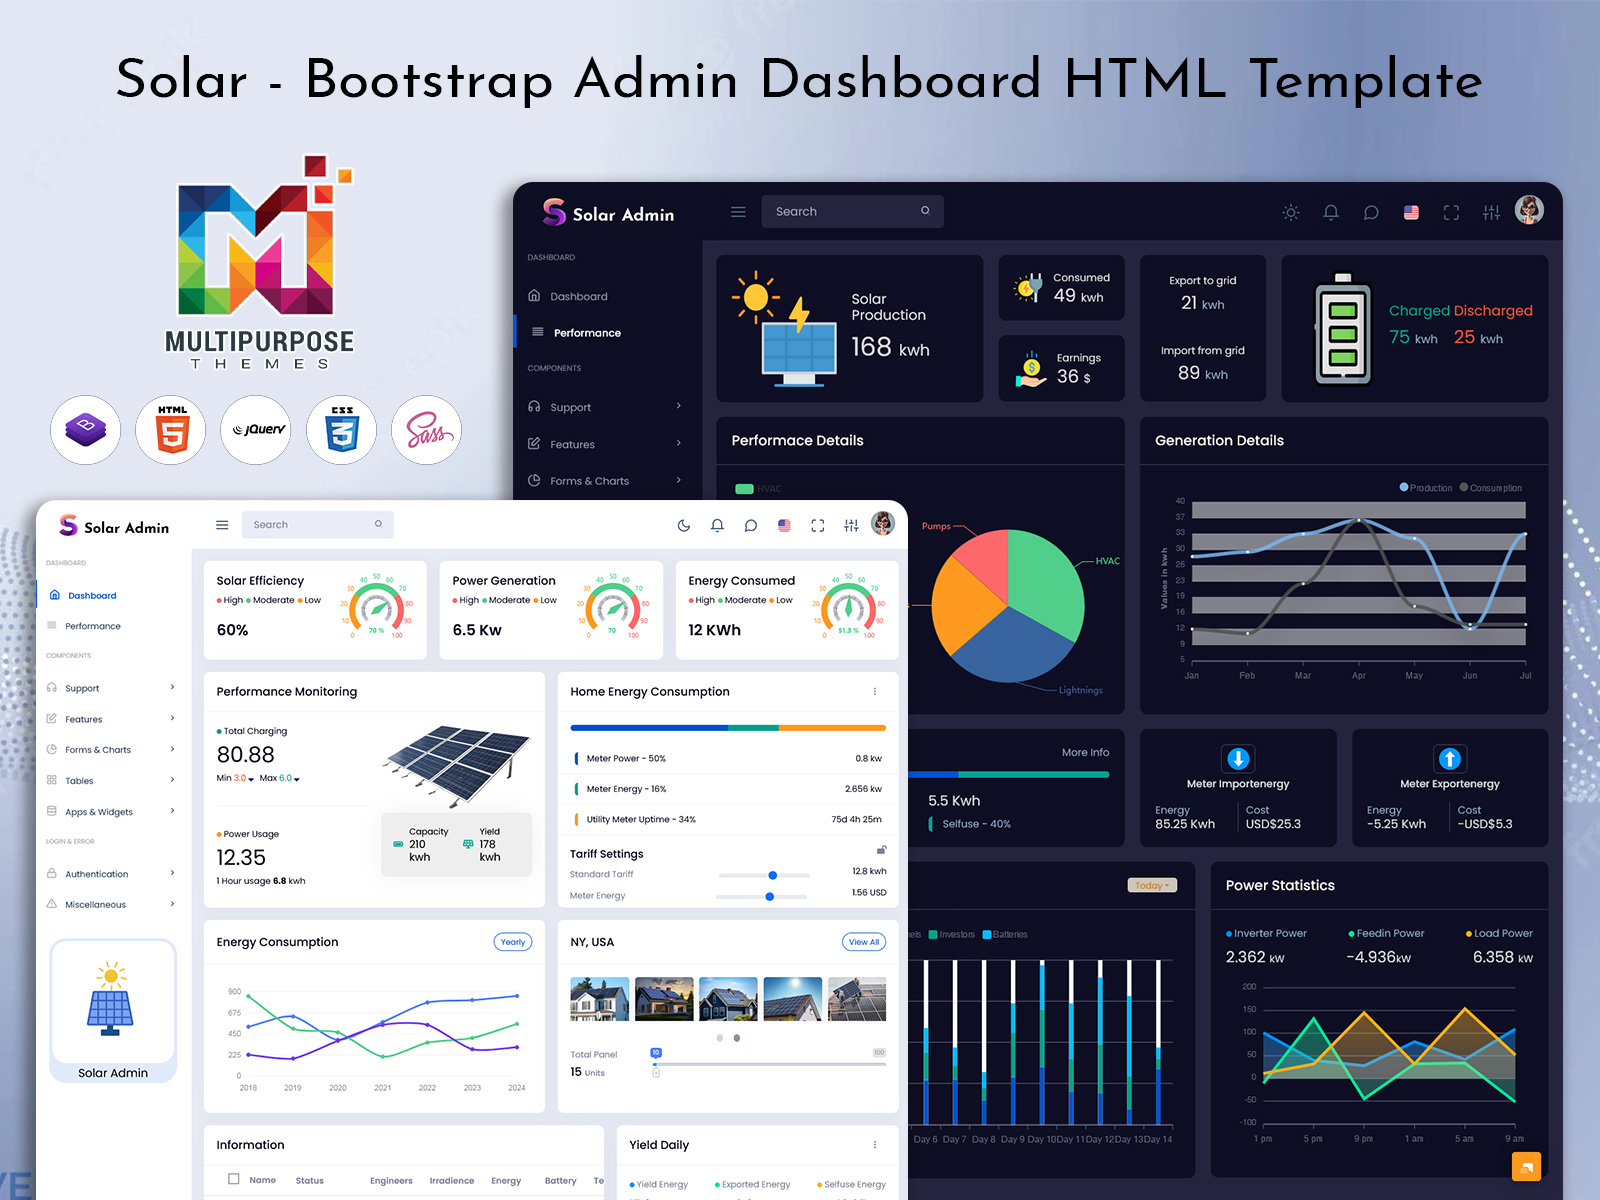
A Solar Dashboard is a user-friendly interface designed to display data about the performance of your solar energy system. It provides insights into various metrics like solar production, energy consumption, savings, and performance over time. Whether you’re a homeowner or a business owner, a Solar Dashboard gives you access to critical information that can help you optimize your solar energy system and maximize its benefits.
For those using advanced monitoring systems, the Solar Charging Dashboard allows users to keep track of solar-powered devices and how they interact with the grid. It also helps monitor how much energy is being consumed, stored, or even sold back to the grid, offering complete transparency into the system’s performance.
Additionally, the Solar Meter Dashboard tracks energy imports and exports, allowing users to understand exactly how much energy is being drawn from or sent to the grid. It’s a powerful tool that connects you with the performance of your system, helping you take control of your energy consumption and savings.
Dashboard of Solar Admin
Dashboard – 1

MORE INFO / BUY NOW DEMO
Dashboard – 2

MORE INFO / BUY NOW DEMO
Performance Page

MORE INFO / BUY NOW DEMO
Importance of the Solar Dashboard
The importance of a Solar Dashboard cannot be overstated. By providing real-time data about energy generation, usage, and savings, it helps you make informed decisions about how to operate and maintain your solar system. Here’s how it helps you save both money and energy:
1. Real-Time Monitoring of Solar Production: A Dashboard allows you to monitor the solar production of your system in real-time. By knowing how much energy your solar panels are generating, you can make better decisions about when to use energy and when to conserve it. This is especially useful for homeowners with solar-powered appliances or businesses that need to optimize their energy use.
2. Energy Consumption Tracking: Another crucial aspect of a Solar Dashboard is its ability to track energy consumption. The Solar Meter Dashboard will display how much energy you are consuming, so you can assess if you’re using energy efficiently. By comparing consumption against production, you can identify ways to reduce unnecessary energy use and, in turn, save money on electricity bills.
3. Earnings from Solar Power: If you’re part of a net metering program, where excess energy produced by your solar system is sent back to the grid, the Solar Charging Dashboard can show you how much you’ve earned from selling excess energy. This is a fantastic way to offset your initial investment in solar panels and further save money over time.
4. Optimizing Energy Storage: For solar energy systems that include batteries for storage, the Solar Dashboard can track how much energy is being stored in your batteries and how much is being discharged. By optimizing battery usage, you can ensure that your energy storage is used effectively, reducing your reliance on grid power and saving money on your electricity bill.
5. Performance and Generation Details: The Solar Dashboard allows you to track the performance of your solar system over time. It shows historical data on energy production, system efficiency, and generation details. By reviewing this information, you can determine if your solar system is working as efficiently as possible, and identify when maintenance or adjustments may be needed to keep it running smoothly.
6. Meter Import and Export Energy Monitoring: The Solar Meter Dashboard is particularly useful for systems that are connected to the grid. It tracks both the energy imported from the grid (when your solar system doesn’t generate enough power) and the energy exported to the grid (when your system generates more power than you use). This feature gives you full visibility into your energy balance and helps you optimize your energy use to save money.
7. Device Performance and Power Statistics: A Solar Dashboard provides insights into how individual devices or components of your solar energy system are performing. For example, it can tell you how well your solar panels or inverters are operating, ensuring that all parts of your system are functioning as expected. If something is malfunctioning or inefficient, you can take action sooner to avoid wasting energy or money.
Features of a Solar Dashboard
A well-designed Solar Dashboard offers a variety of features that make monitoring and managing your solar system easy and efficient. Here are some of the key features to look out for:
1. Solar Production
One of the most important metrics on a Solar Dashboard is solar production. This data shows how much energy your solar panels are generating at any given time. With real-time updates, you can see if your solar system is performing as expected or if adjustments are necessary.
2. Energy Consumed
The Solar WebApp Dashboard also shows how much energy you are consuming, which can be compared against solar production to determine if your energy usage is efficient. By keeping track of this data, you can optimize how and when you use energy in your home or business.
3. Earnings from Solar Energy
For those who are selling energy back to the grid, the Solar Charging Dashboard provides data on earnings. This information is valuable for tracking how much you’re making from your solar energy system and how it impacts your energy costs.
4. Charged and Discharged Data
For systems with battery storage, the Solar Dashboard offers insights into how much energy is being charged into the battery and how much is being discharged. This is essential for ensuring that your battery is being used optimally.
5. Performance Details
The Solar Dashboard tracks the overall performance of the system. This includes efficiency metrics, such as how much energy is being generated per square foot of solar panel or how much energy is being lost due to inefficiency.
6. Generation Details
Detailed generation data is critical for understanding how much energy is being produced by your solar panels over a specific time frame. This data helps you analyze seasonal performance and anticipate energy needs.
7. Meter Import and Export Energy
The Solar Meter Dashboard keeps track of energy imports (from the grid) and exports (back to the grid). This feature allows you to evaluate your net energy usage and adjust accordingly to reduce reliance on the grid and save money.
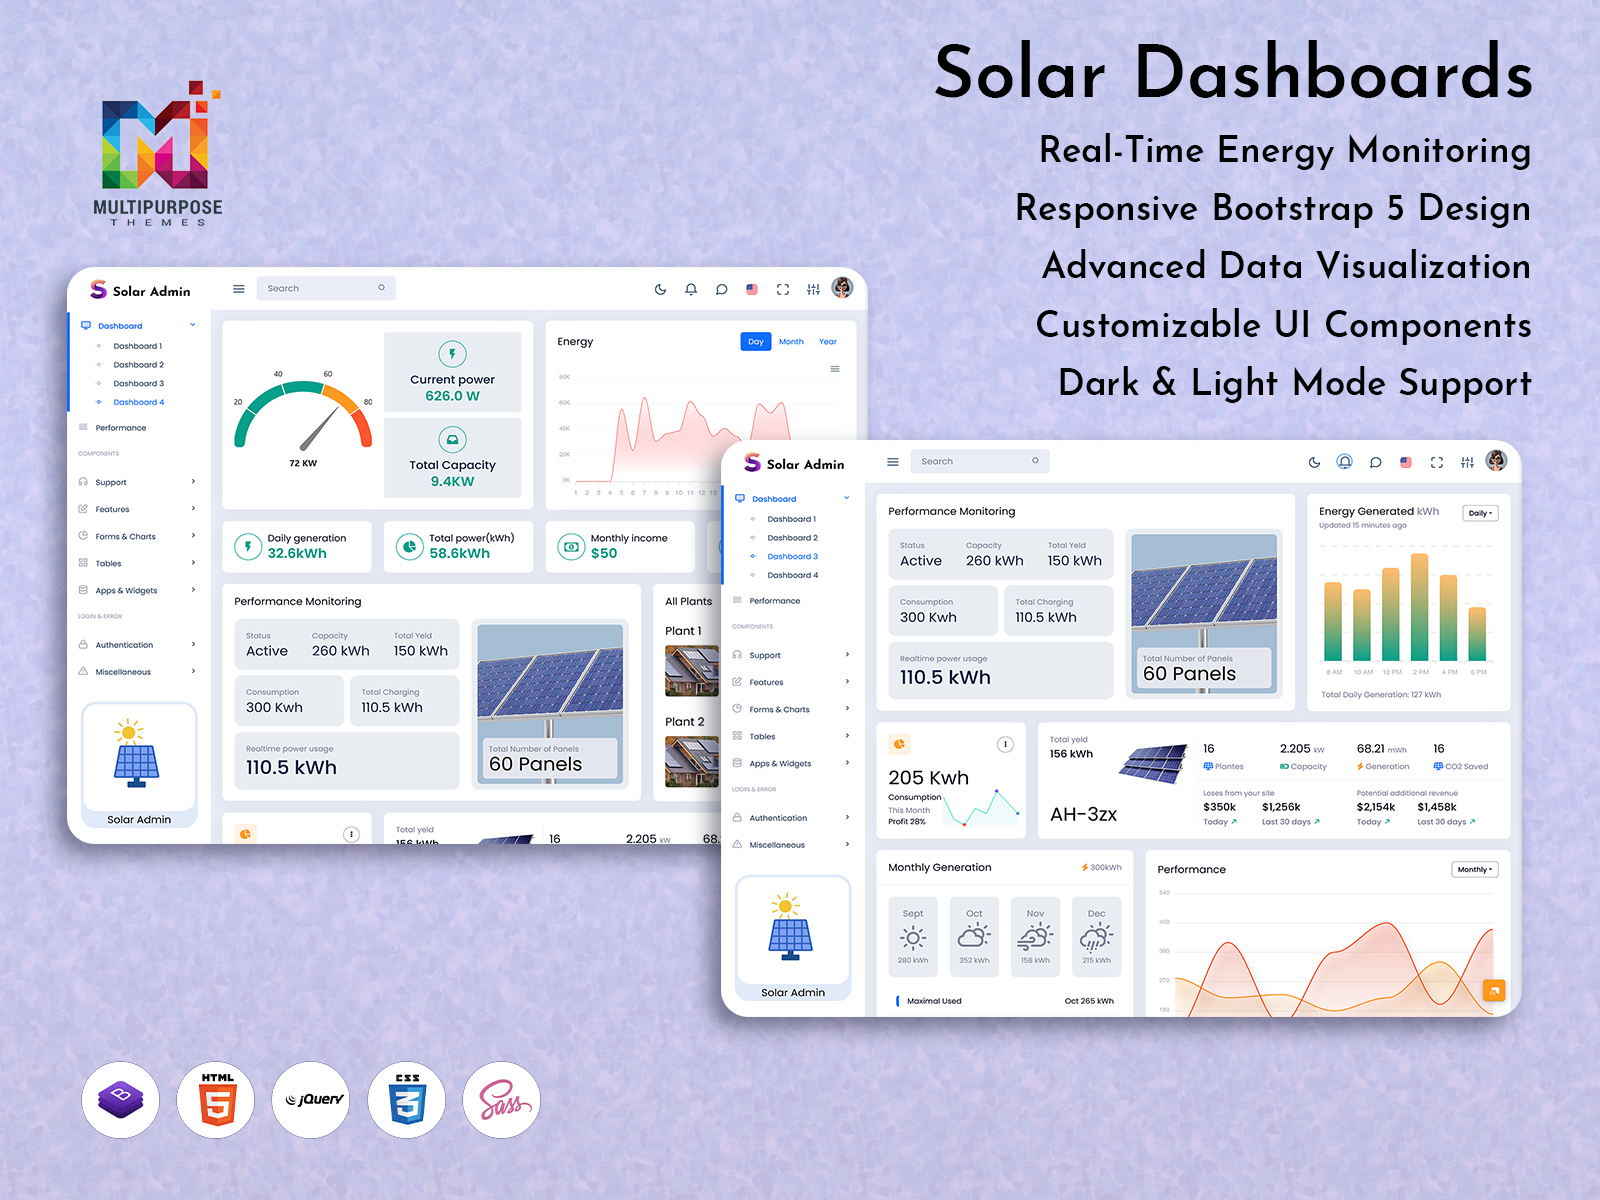
Admin Template for Solar Dashboards
If you’re an administrator managing multiple solar systems, an Admin Template can help streamline the management process. The Dashboard Template enables you to easily monitor and control multiple systems from a centralized location. With a Bootstrap 5 Admin Template, you get a clean and efficient layout that’s optimized for mobile devices, ensuring that you can manage your systems on the go.
A Bootstrap 5 Dashboard Template is especially helpful for users who need to analyze large amounts of data from different sources, as it offers an intuitive Dashboard UI for seamless navigation. Whether you’re a solar company managing multiple installations or an energy manager tracking the performance of a corporate solar system, this Admin Dashboard UI helps you make data-driven decisions and enhance energy efficiency across the board.
Benefits of a Solar Dashboard
1. Cost Savings: By helping you monitor your solar energy system’s performance, a Bootstrap 5 Admin Dashboard allows you to adjust your energy consumption habits, leading to long-term savings on your energy bills.
2. Energy Efficiency: A Admin Dashboard provides real-time insights into your energy consumption, helping you identify areas where you can reduce energy waste and optimize your usage.
3. Easy Monitoring: With easy-to-understand charts and graphs, a Solar Charging Dashboard makes it simple to monitor energy production, consumption, and savings—all in one place.
4. Maintenance Alerts: A well-maintained solar system is crucial for optimal performance. The Admin Dashboard UI can send alerts when something needs attention, preventing costly repairs and ensuring the longevity of your system.
5. Data Transparency: A Solar Meter Dashboard offers full transparency by showing how much energy is being imported or exported, giving you greater control over your energy use.
Conclusion
A Solar Dashboard is an essential tool for anyone looking to get the most out of their solar energy system. From tracking energy production to monitoring consumption and earnings, it offers real-time insights that help you optimize your energy usage, save money, and contribute to a greener future. Whether you’re managing a single system or multiple installations, the Admin Template, Dashboard Template, and Bootstrap 5 Admin Template offer powerful features for both homeowners and businesses alike. By leveraging a Solar Meter Dashboard, you can ensure that your solar system operates at peak efficiency, ultimately reducing your carbon footprint and lowering energy costs.
Buy Now and Get Started Today!
Click below to purchase and start unlocking the full potential of your business!
BUY NOW
Related Posts


This Post Has 0 Comments