
In today’s fast-moving digital world, education is no longer limited to classrooms and physical books.…

How an LMS Dashboard Makes Online Learning Better
Reading Time: 5 minutes
Online education has changed how we learn. More people take courses from home now. They use platforms that track their progress. The heart of these platforms is the LMS dashboard. This tool shows students and teachers what matters most.
buy now
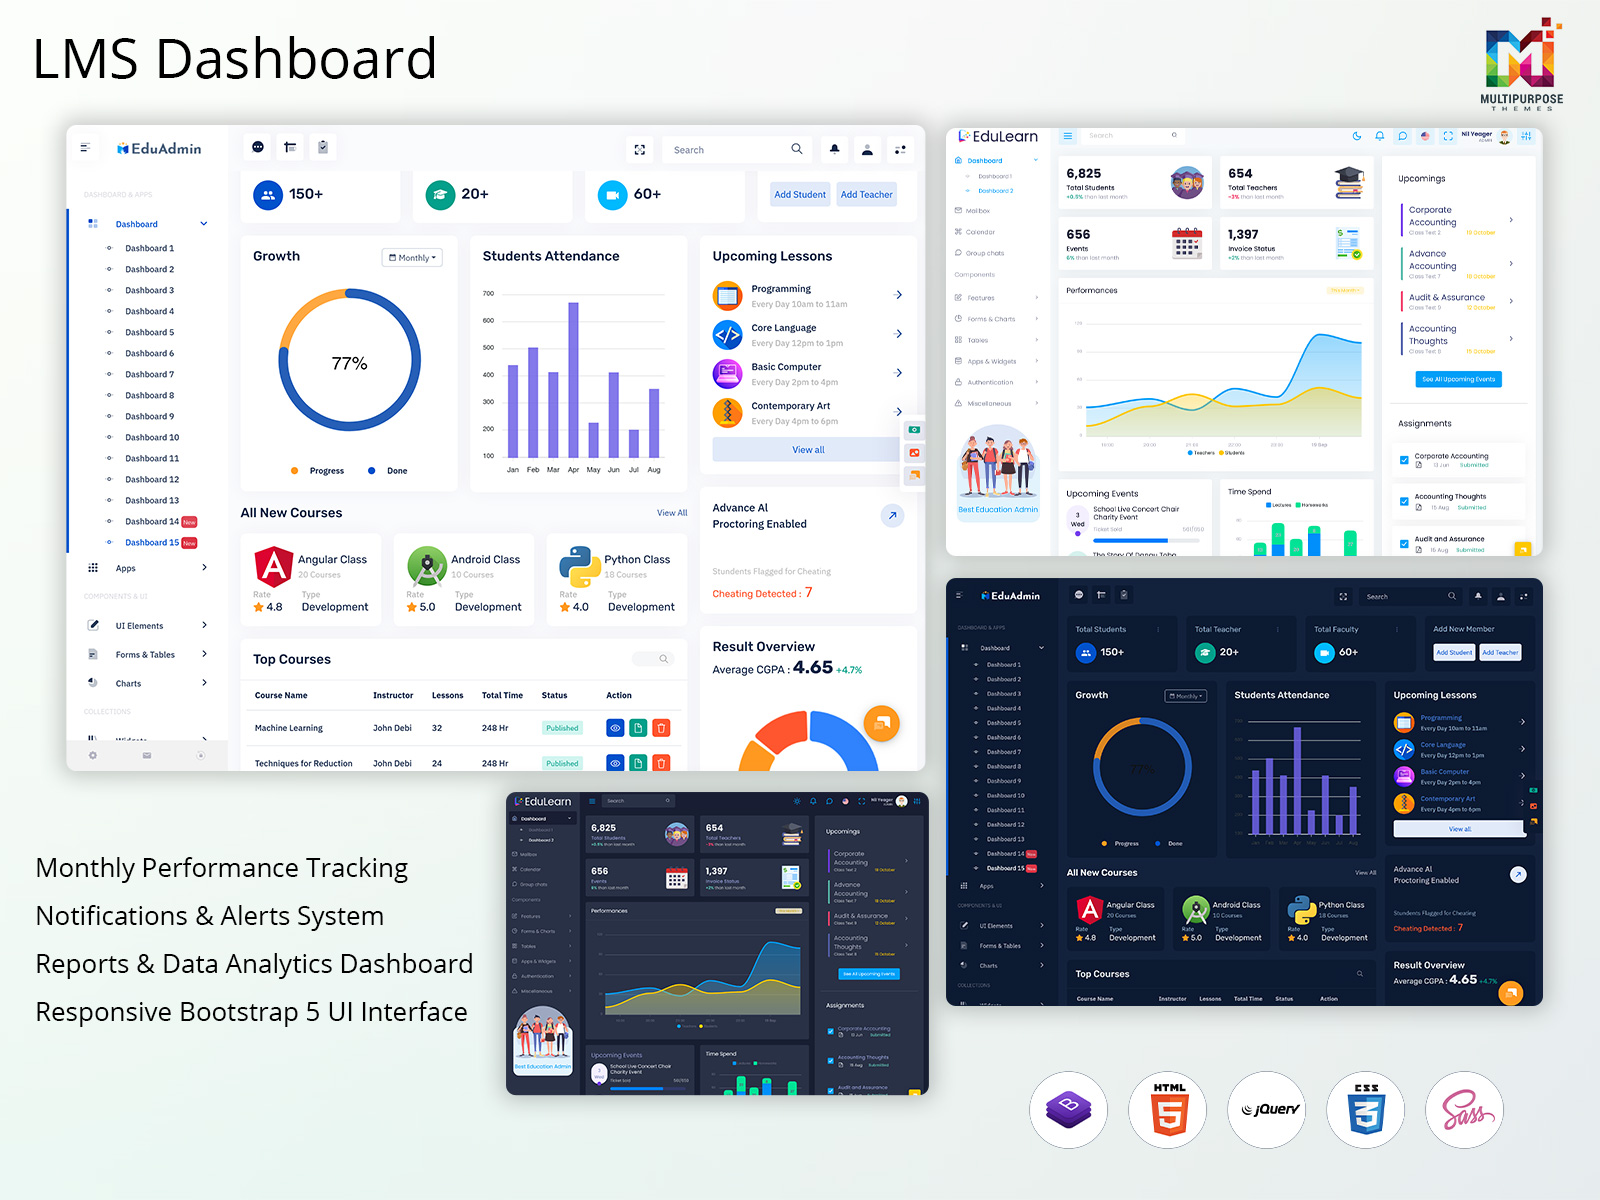
What Is an LMS Dashboard?
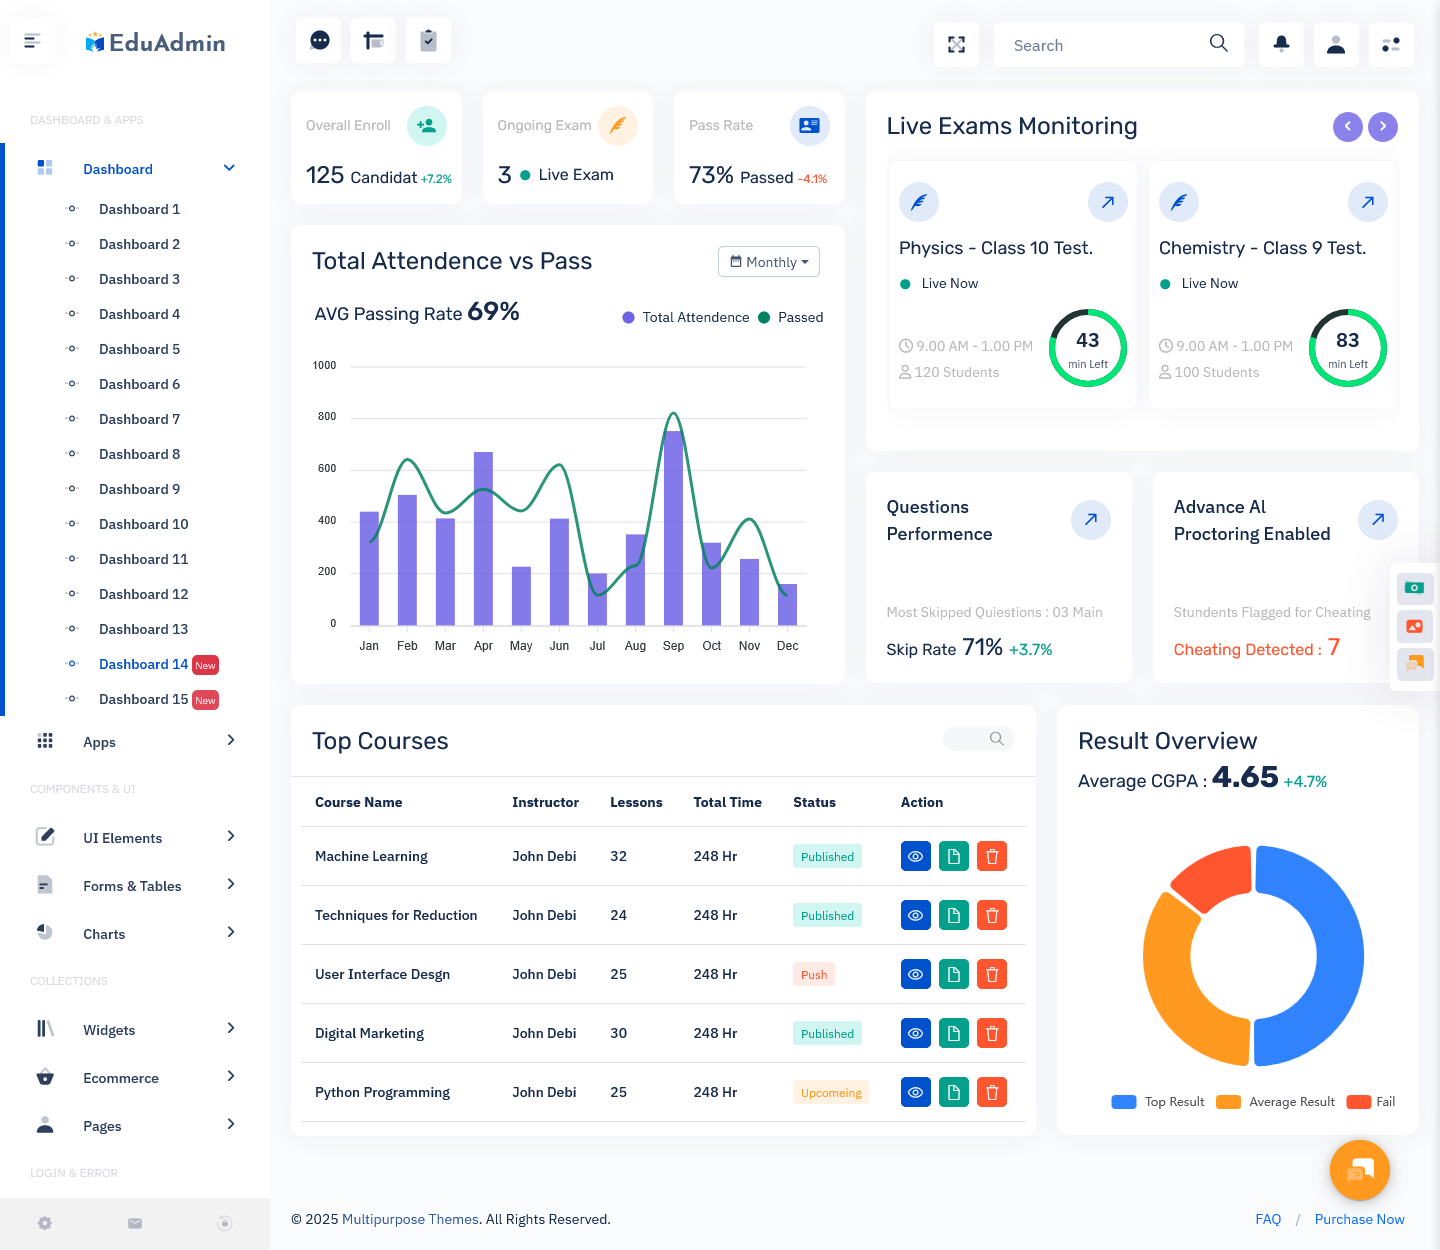
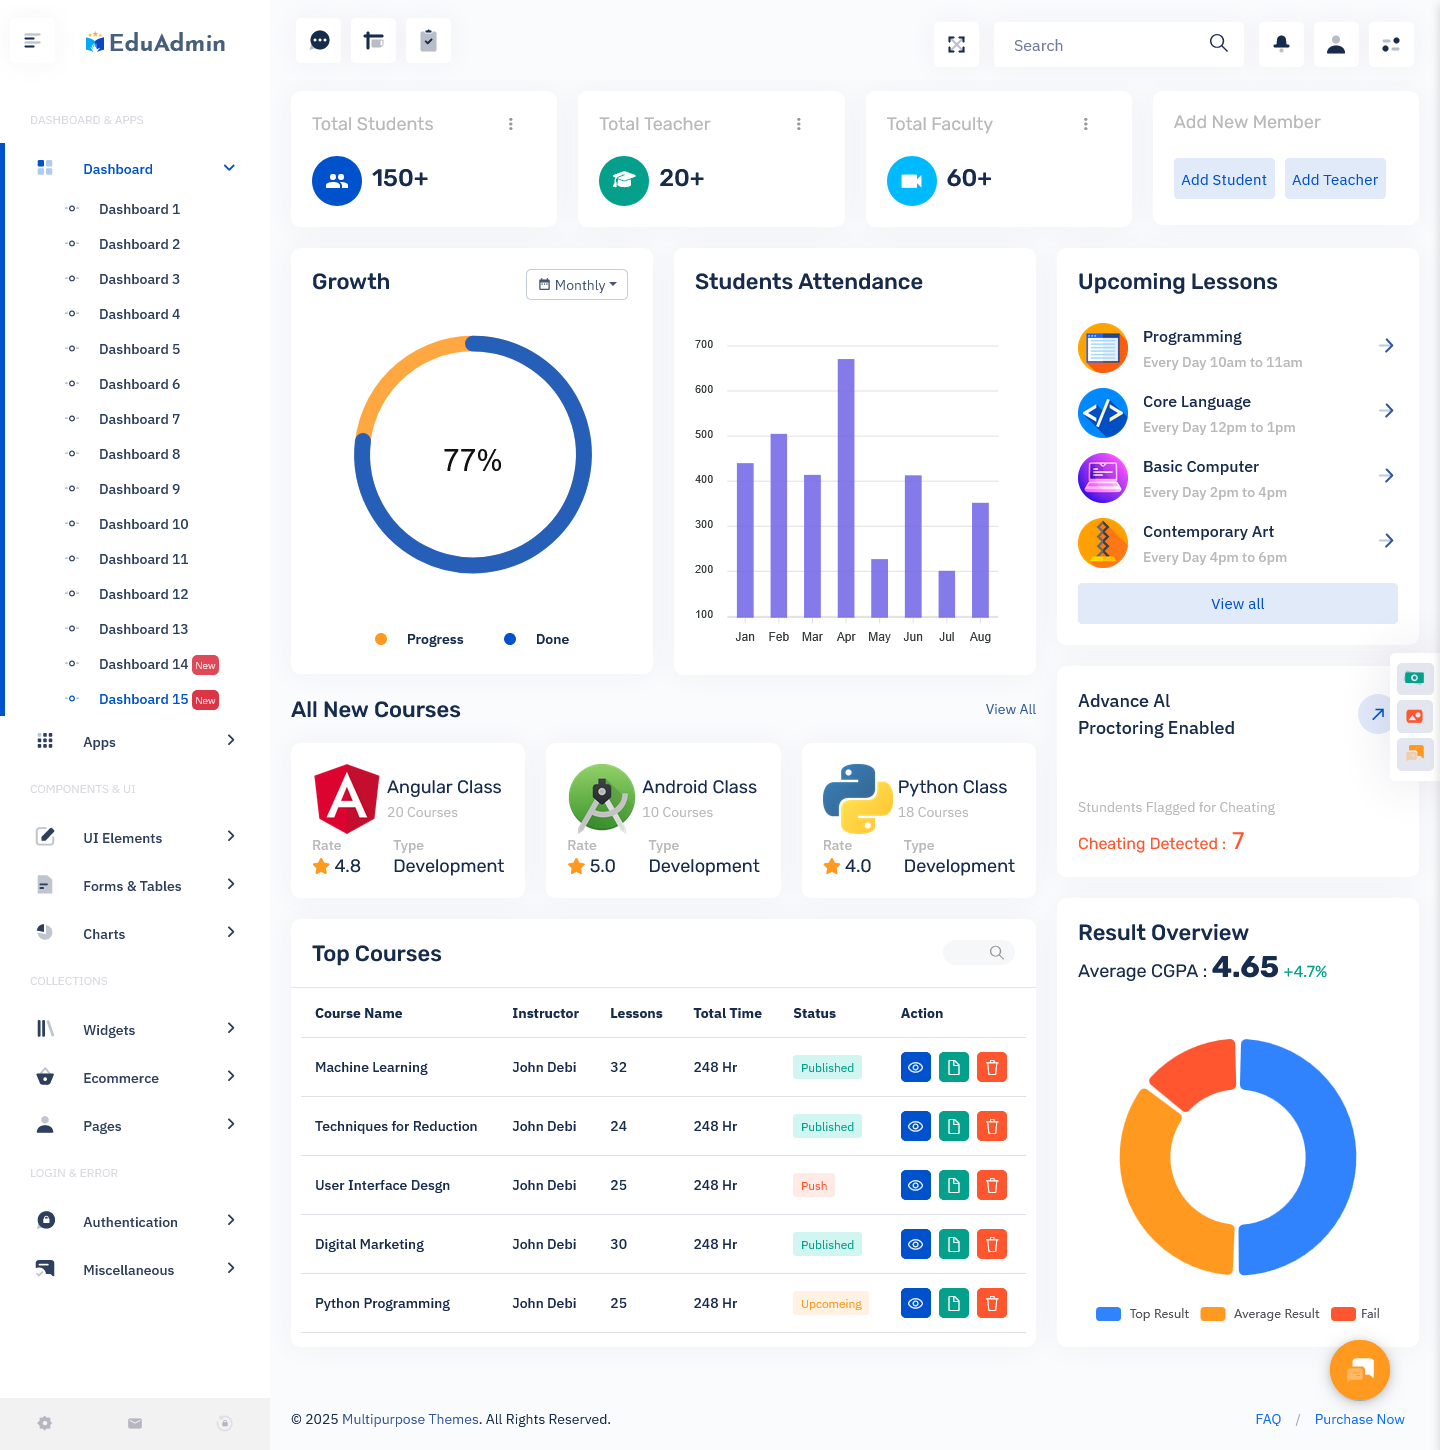
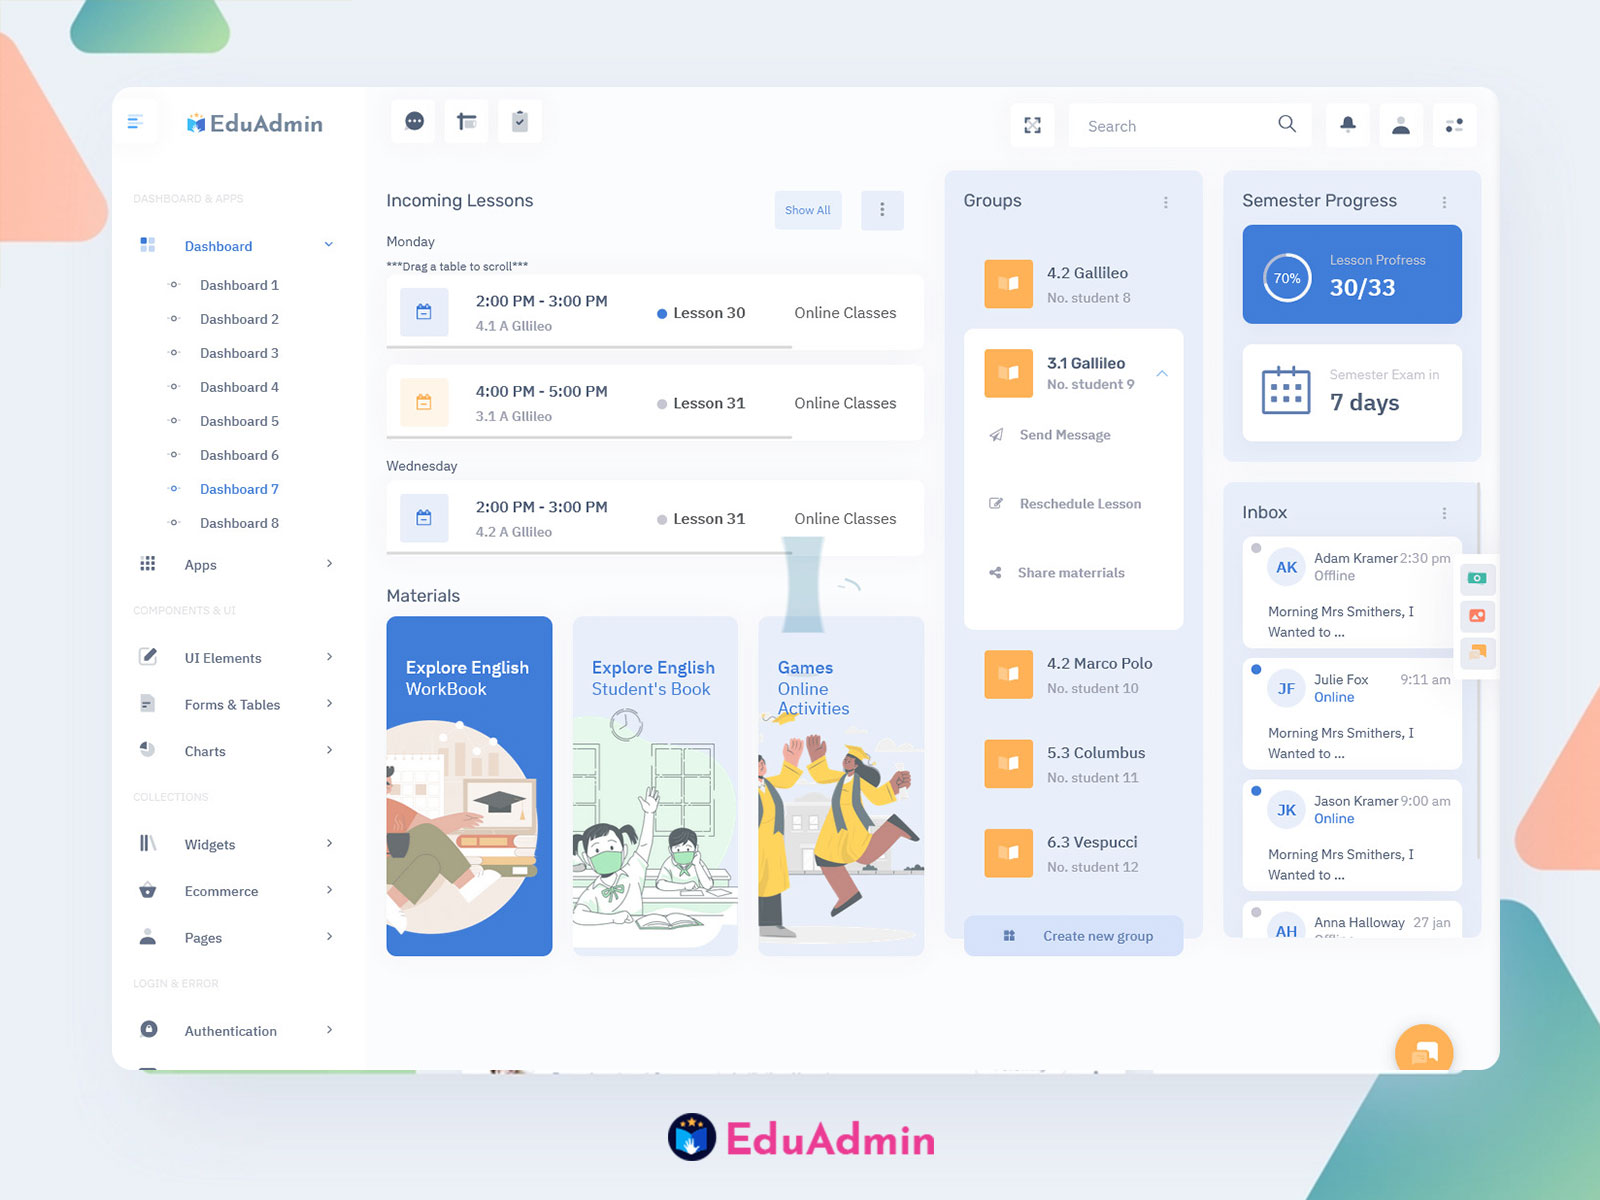
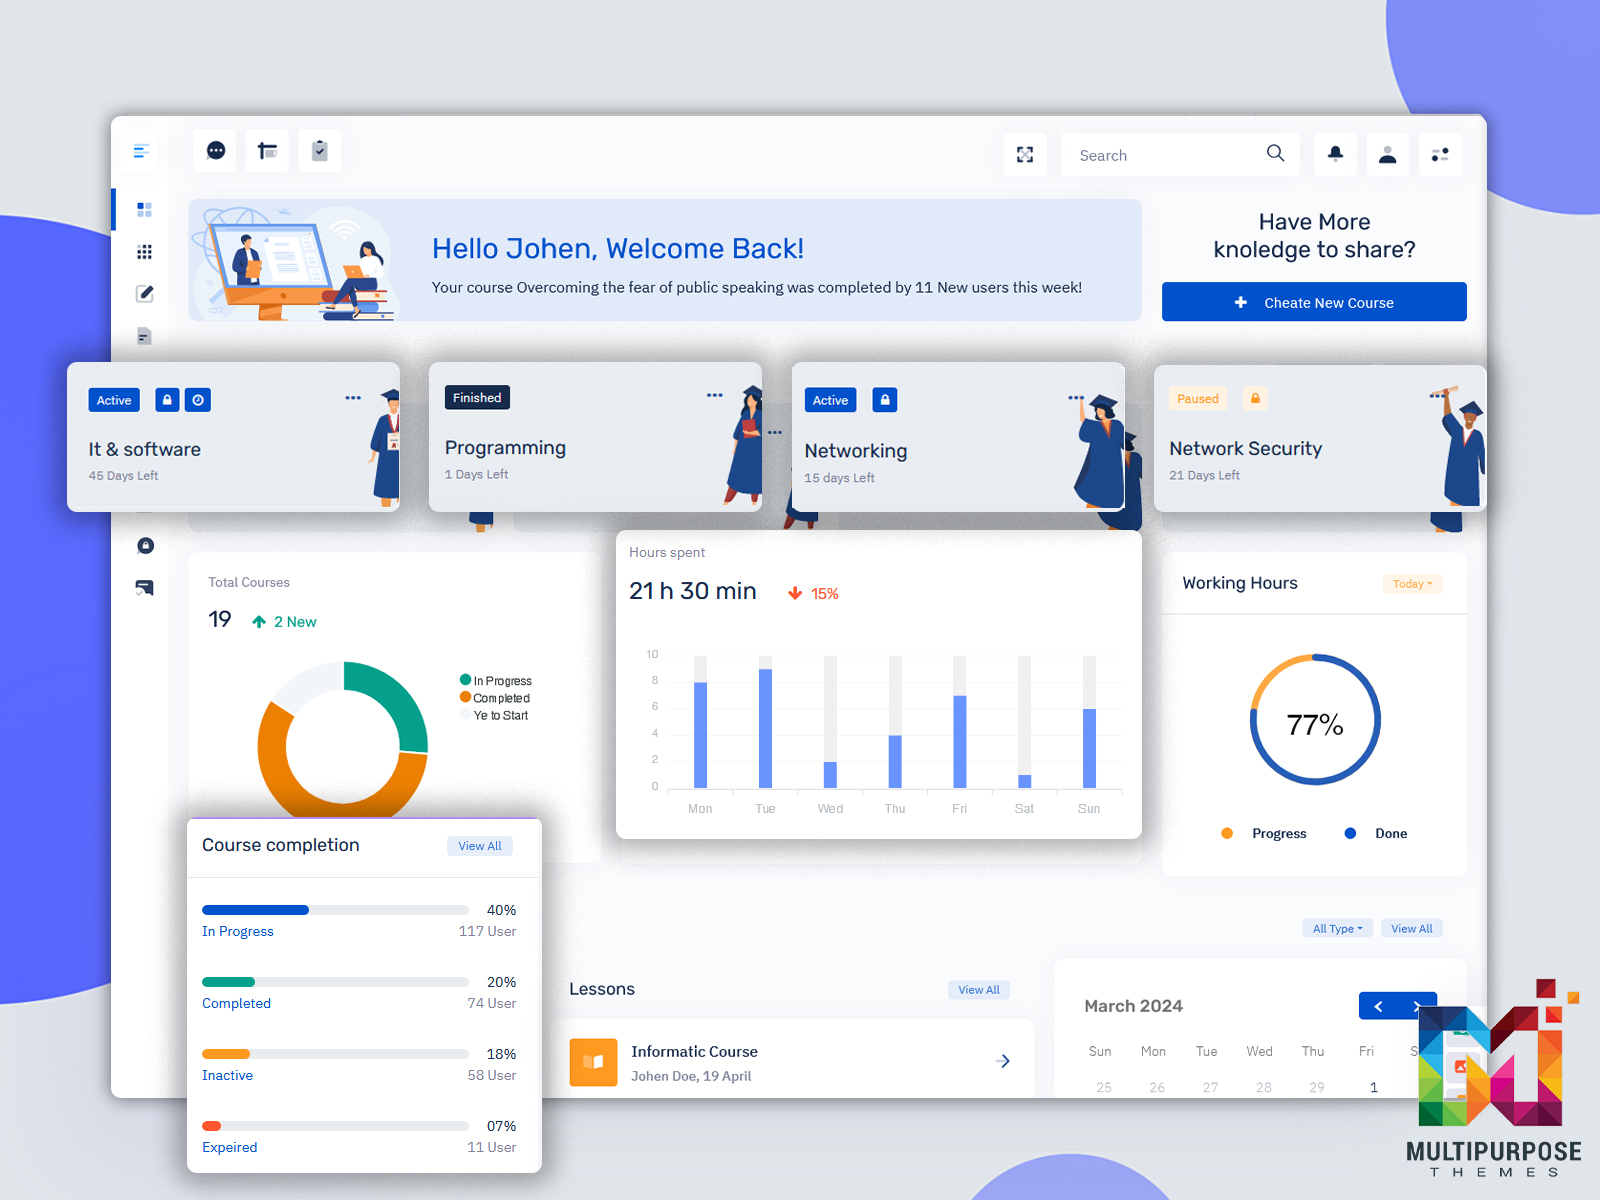
An LMS dashboard is a control center. It displays key information at a glance. Students see their grades and assignments. Teachers view class performance. Meanwhile, administrators track overall system health.
Think of it like a car’s dashboard. You see your speed, fuel level, and warnings. Similarly, a learning management system dashboard shows learning metrics. It presents data in charts and graphs. Users can make quick decisions based on what they see.
Core Features That Matter
Every good Onlinecourse Dashboard includes certain elements. First, it shows current course progress. Students know exactly where they stand. Second, it displays upcoming deadlines. Nobody misses important due dates this way.
Additionally, the dashboard tracks completion rates. Teachers see which students struggle. They can offer help before it’s too late. The system also highlights achievements. Badges and certificates appear when earned.
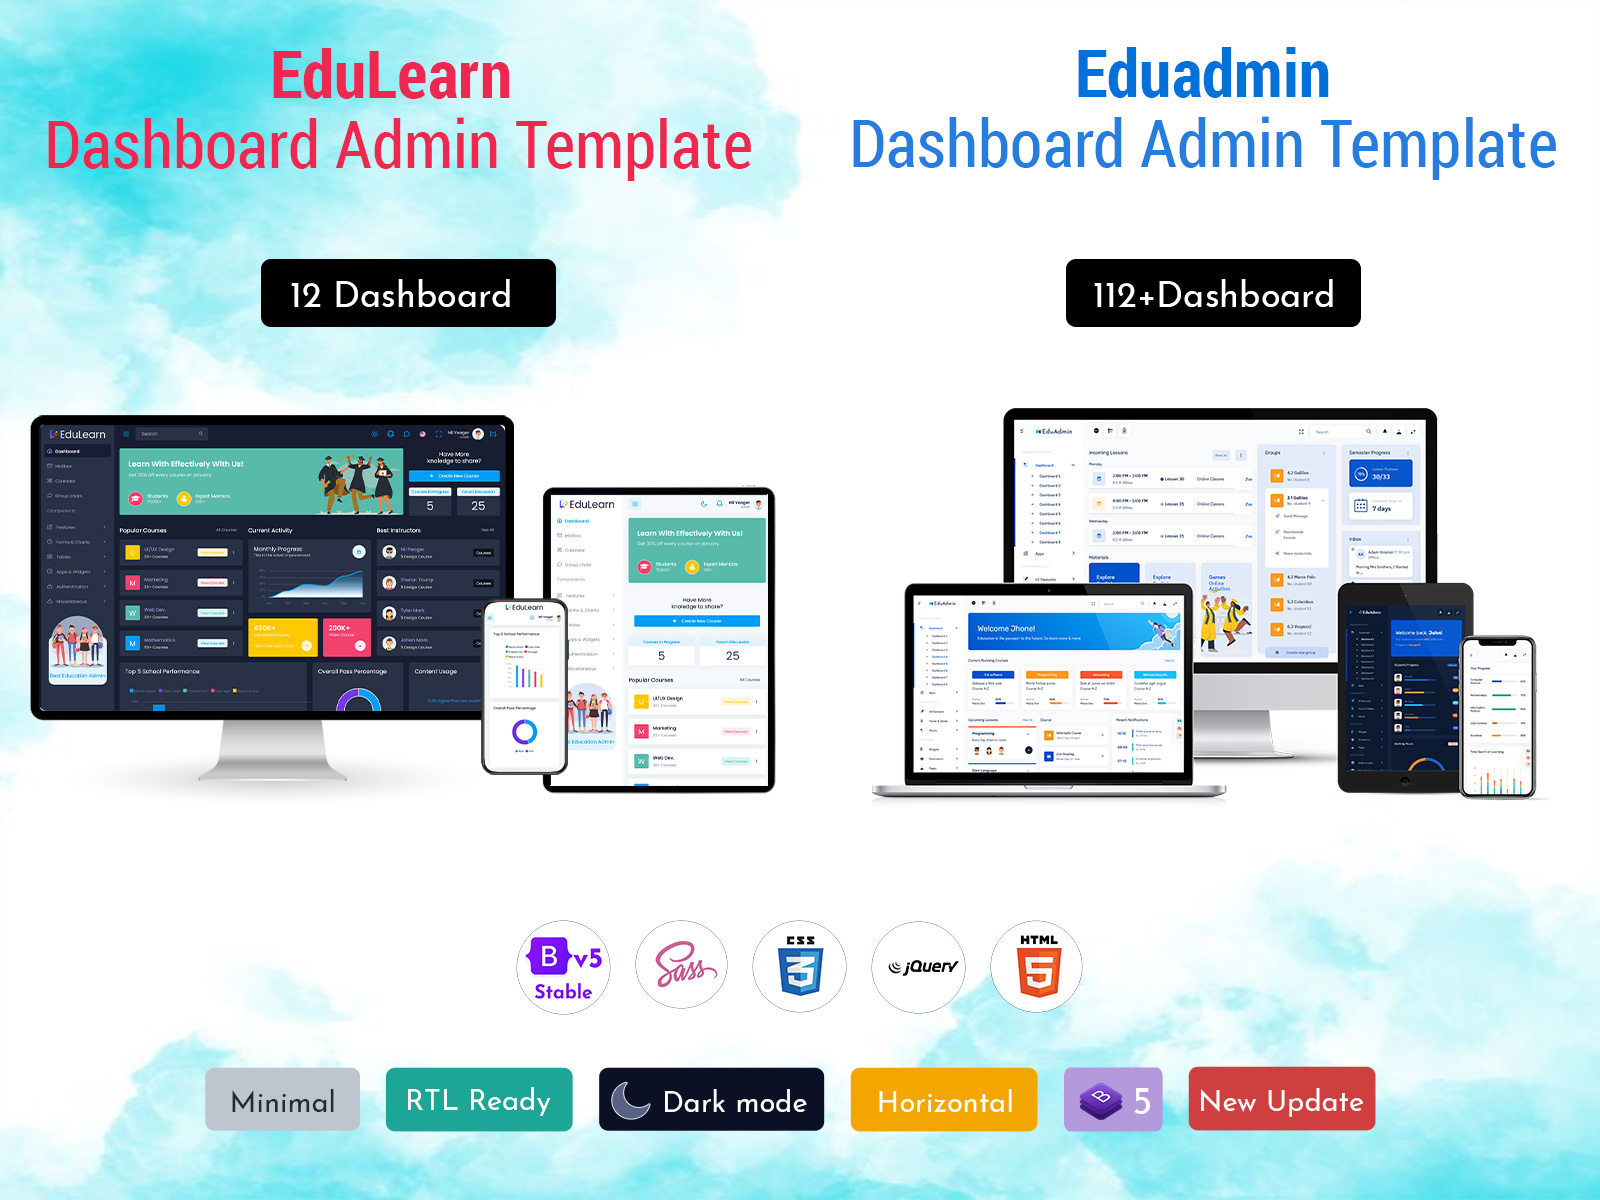
Explore New Dashboard Design of EduAdmin
Dashboard – 10
BUY NOW DEMO
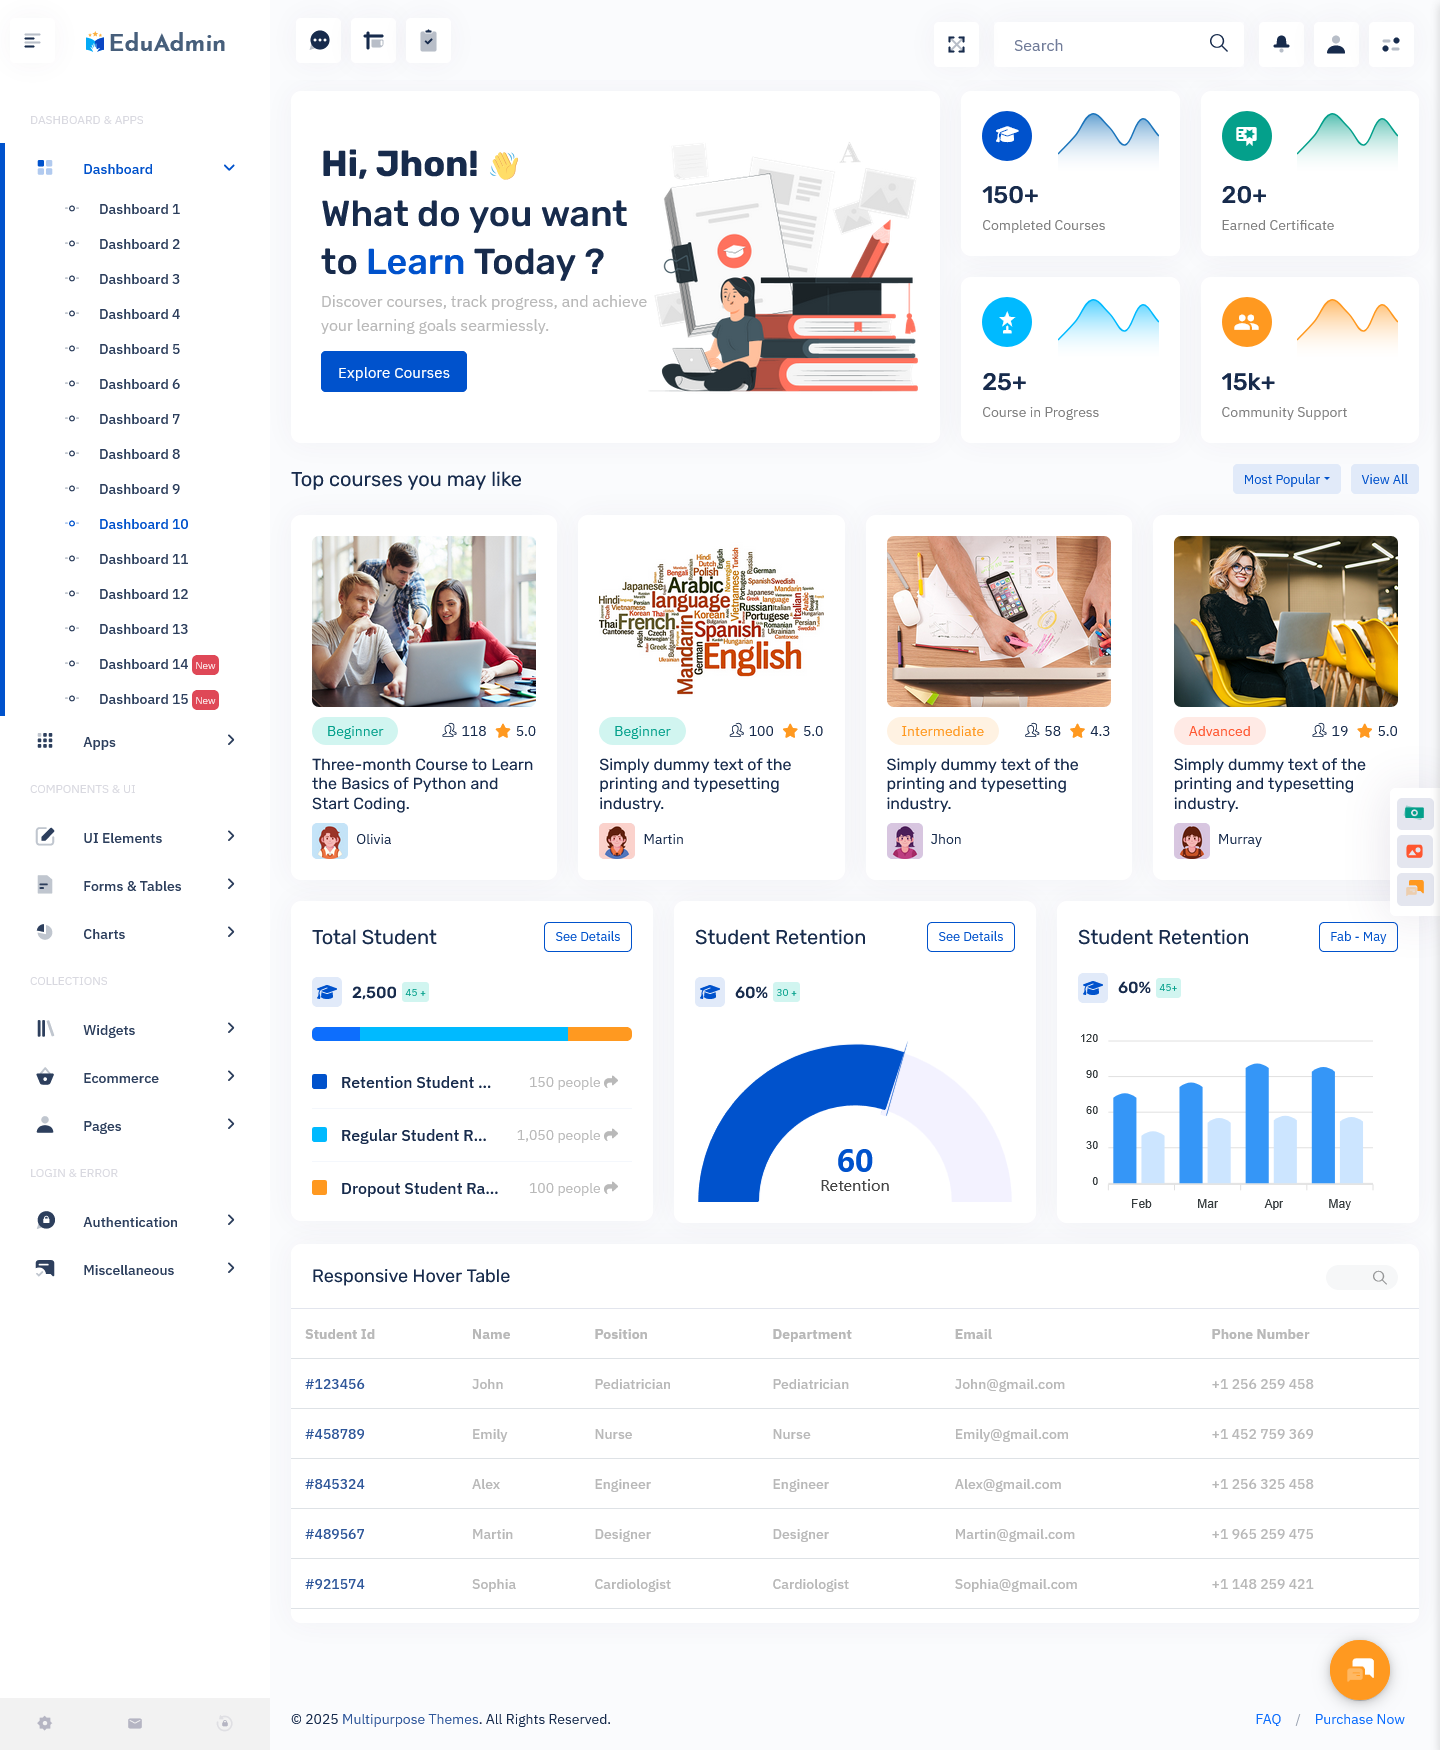
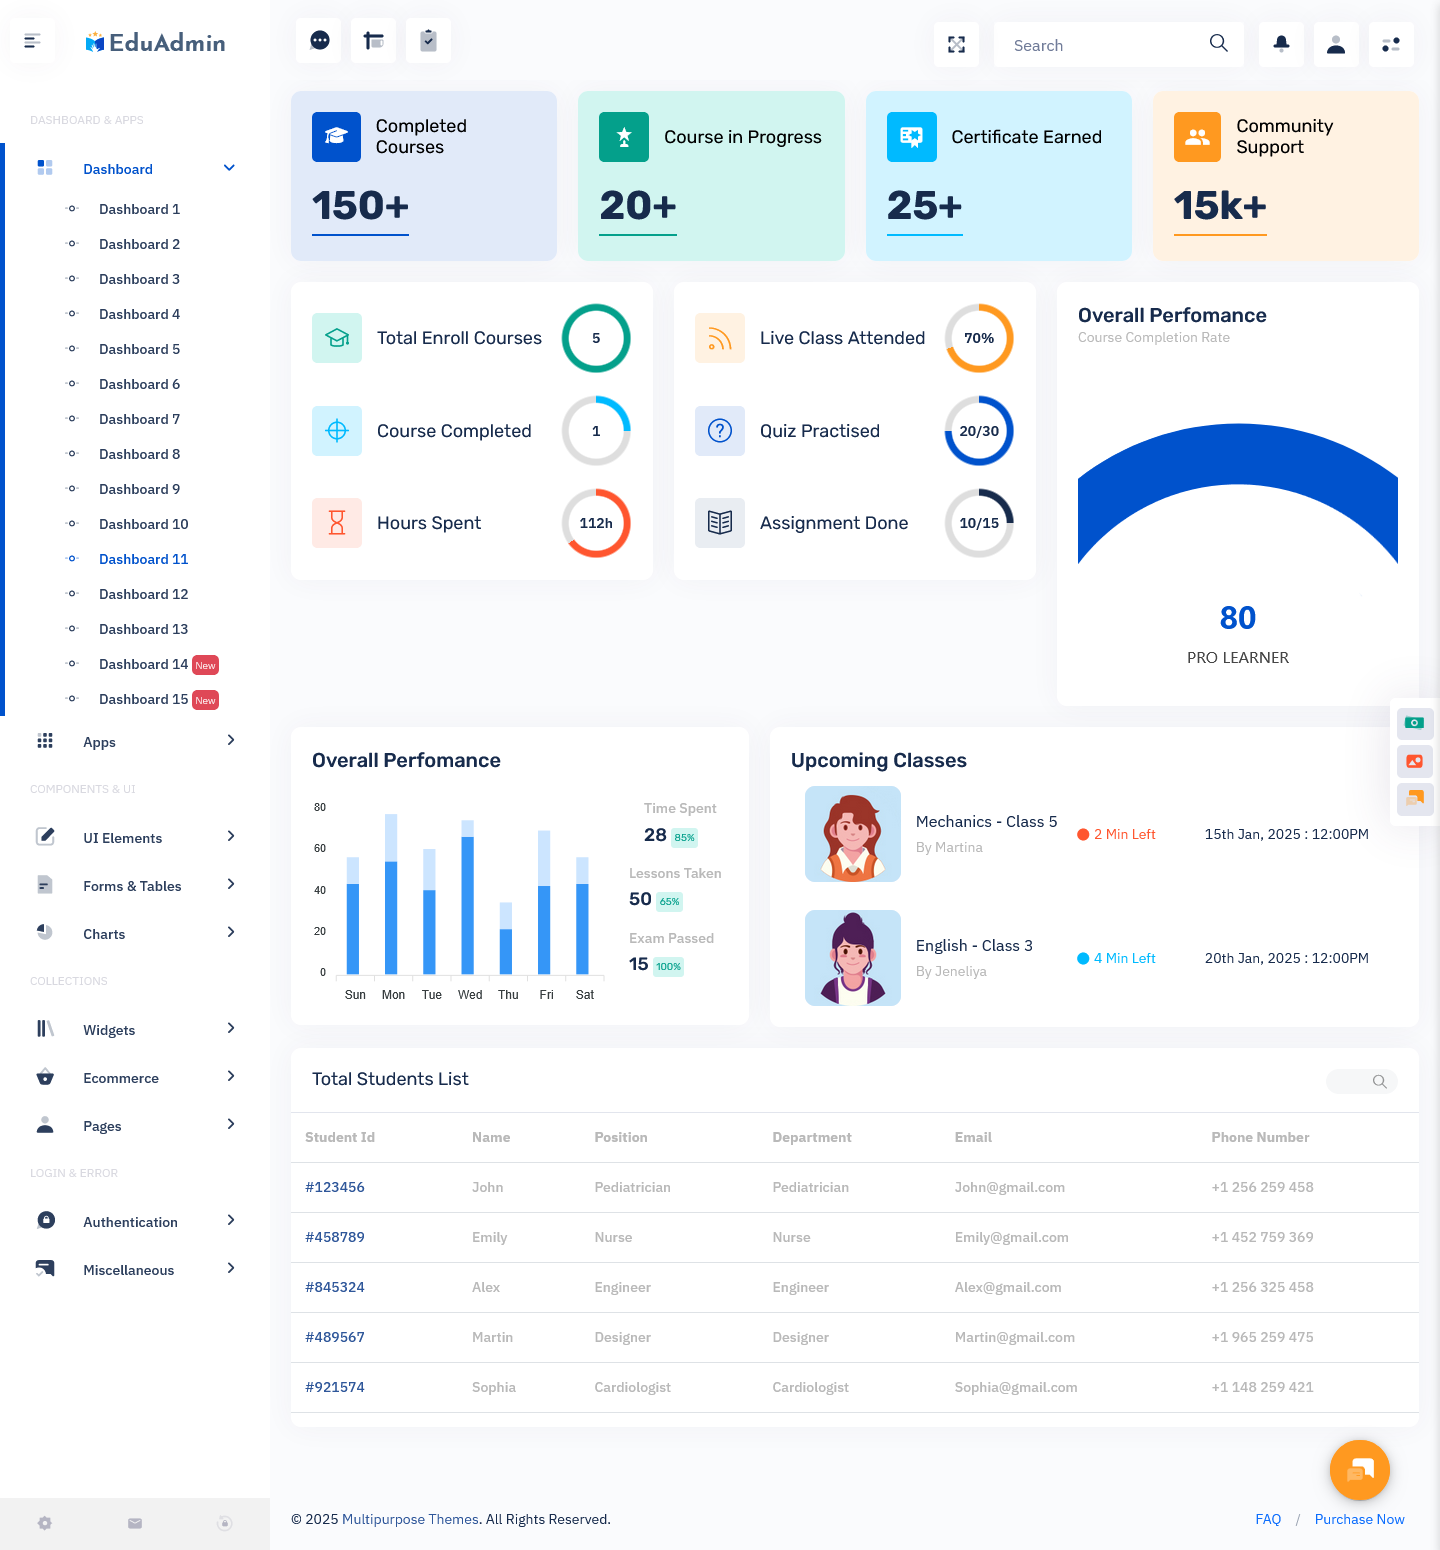
Dashboard – 11
BUY NOW DEMO
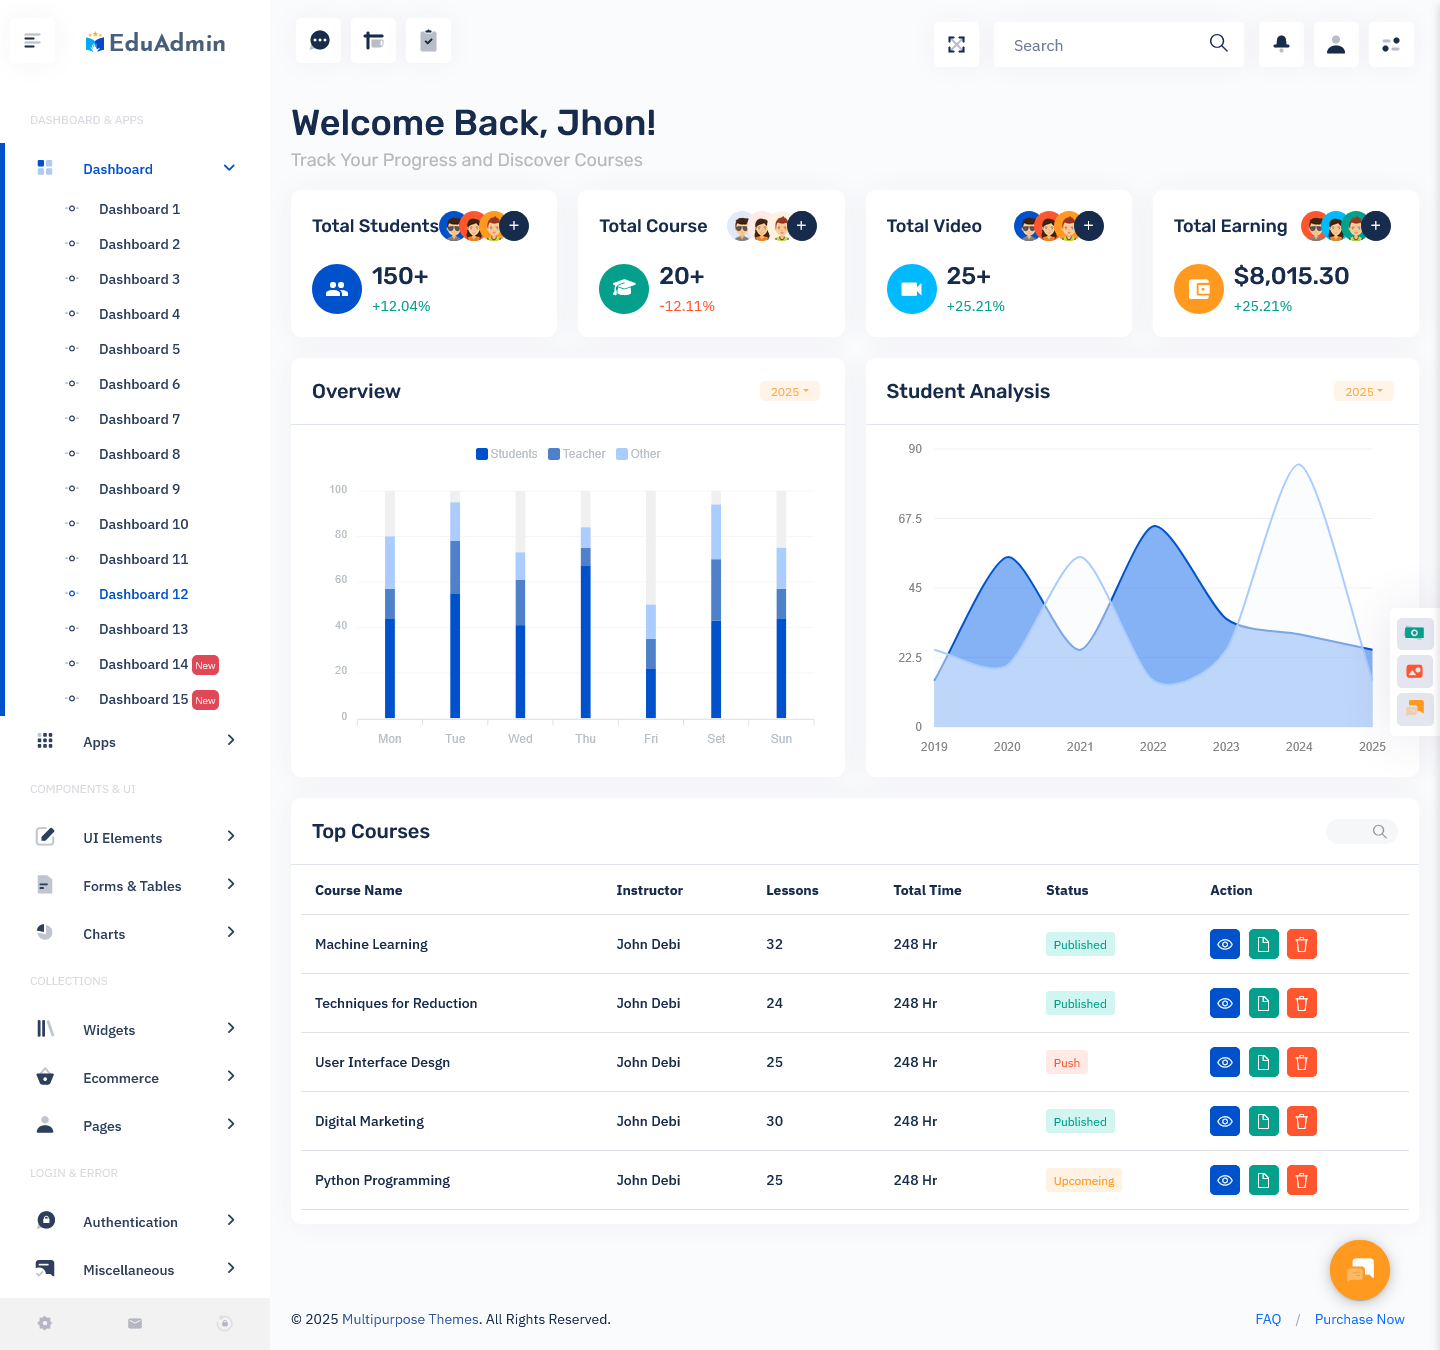
Dashboard – 12
BUY NOW DEMO
Dashboard – 13

BUY NOW DEMO
Dashboard – 14
BUY NOW DEMO
Dashboard – 15
BUY NOW DEMO
Why Templates Save Time
Creating a Education Software Dashboard from scratch takes months. Developers need to code each feature. They must test everything repeatedly. Instead, many organizations use an LMS dashboard template.
Templates provide pre-built layouts. They include common widgets and tools. Organizations customize them to fit their needs. This approach cuts development time significantly. Moreover, templates cost less than custom solutions.
Watch Video of Dashboard
Choosing the Right Template
Not all templates work the same way. Some focus on K-12 education. Others target corporate training. Therefore, you must match the template to your audience.
Look for clean designs first. Users should find information easily. Next, check mobile responsiveness. Many learners use phones and tablets. The template must work on all devices.
Consider customization options too. You’ll want to add your branding. Colors and logos should match your organization. Finally, verify that the template includes analytics. Data tracking is essential for improvement.
Explore Other Education Admins – Click the Button for Live Dashboard
EduLearn Admin
BUY NOW DEMO
Gilded Admin
BUY NOW DEMO
Tresto Admin
BUY NOW DEMO
BsinX Admin
BUY NOW DEMO
CRMi Admin
BUY NOW DEMO
Student Benefits
Students gain several advantages from good dashboards. They see all their courses in one place. No more jumping between different sites. Everything lives under one roof. The online course dashboard shows real-time grades. Students track their performance constantly. They spot weak areas quickly. Then they can focus study time where needed.
Calendars display all deadlines together. This feature prevents scheduling conflicts. Students plan their week more effectively. They balance coursework with other responsibilities. As a result, stress levels drop.
Personalized Learning Paths
Modern dashboards adapt to each learner. They recommend relevant courses based on history. The system suggests next steps automatically. This guidance helps students progress faster.
Some Admin dashboards include skill trackers. They map competencies gained over time. Students see how far they’ve come. This visualization boosts motivation. Furthermore, it helps with career planning.
Teacher Advantages
Instructors benefit just as much as students. They monitor multiple classes simultaneously. The dashboard aggregates data from all courses. Teachers spot trends across different groups.
Grading becomes more efficient with dashboards. The system can auto-grade certain assignments. Teachers focus on subjective evaluations instead. They spend less time on administrative tasks.
Communication tools integrate into the dashboard. Teachers message individual students or groups. They post announcements that everyone sees. Response tracking shows who read each message.
Early Warning Systems
Good dashboards flag at-risk students. They notice patterns like missing assignments. Low quiz scores trigger alerts. Teachers can intervene before students fall behind. Some systems predict final grades based on current performance. This forecasting helps with resource allocation. Teachers offer extra support to those who need it. Consequently, more students succeed.
Administrator Insights
School administrators need big-picture views. The learning management system dashboard provides this perspective. They see enrollment numbers across programs. Completion rates reveal program effectiveness.
Financial metrics appear alongside academic data. Administrators track cost per student. They identify which courses generate revenue. This information guides budget decisions.
Compliance tracking is built into many dashboards. Required training completion shows up clearly. Administrators ensure everyone meets regulations. They avoid penalties and legal issues.
Resource Optimization
Dashboards reveal resource utilization patterns. Administrators see which courses are popular. They notice underused content too. This knowledge improves future planning. Server load information prevents technical problems. The dashboard shows peak usage times. IT teams can scale resources accordingly. Students experience fewer disruptions.
Design Principles That Work
Effective dashboards follow certain rules. First, they prioritize important information. Critical data appears at the top. Users shouldn’t need to scroll for essentials.
Color coding helps with quick comprehension. Green indicates good performance. Red signals problems that need attention. This visual system works across cultures.
White space improves readability significantly. Crowded screens overwhelm users. Clean layouts with breathing room work better. People absorb information more easily.
Mobile-First Thinking
Most users access dashboards on phones. Therefore, mobile design must come first. Buttons need to be finger-friendly. Text must stay readable on small screens.
Vertical scrolling works better than horizontal. People naturally swipe up and down. Menus should collapse to save space. Yet, they must remain easily accessible.
Integration Capabilities
Dashboards shouldn’t exist in isolation. They need to connect with other tools. Video conferencing links let users join classes directly. Calendar apps sync with assignment deadlines.
Payment systems integrate for course purchases. Students buy and enroll without leaving the platform. Email services send automated notifications. These connections create seamless experiences.
Third-party content libraries expand course offerings. The dashboard pulls in external resources. Students access everything through one interface. This consolidation saves time and reduces frustration.
Security Considerations
Protecting user data is critical. Dashboards handle sensitive information like grades and personal details. Strong encryption keeps data safe during transmission.
Role-based access controls limit who sees what. Students can’t view other students’ grades. Teachers access only their own classes. Administrators see everything but leave audit trails. Regular backups prevent data loss. The system should save copies automatically. Users can restore previous versions if needed. This redundancy provides peace of mind.
Getting Started
Implementing a new LMS Dashboard requires planning. First, identify your specific needs. List must-have features versus nice-to-haves. This clarity guides template selection. Involve end users in the process. Students and teachers know what works. Their feedback prevents costly mistakes. Run pilot programs before full deployment.
Training ensures successful adoption. Users need to understand available features. Provide videos and documentation. Offer live support during the transition period. Monitor usage after launch. Analytics show which features people actually use. This data informs future improvements. Regular updates keep the dashboard relevant.
Related Posts


This Post Has 0 Comments