
Managing investments in today’s fast-changing financial world requires more than just basic tools. A modern…

Stock Market Dashboard – Turning Panic Into Charts
Reading Time: 2 minutes
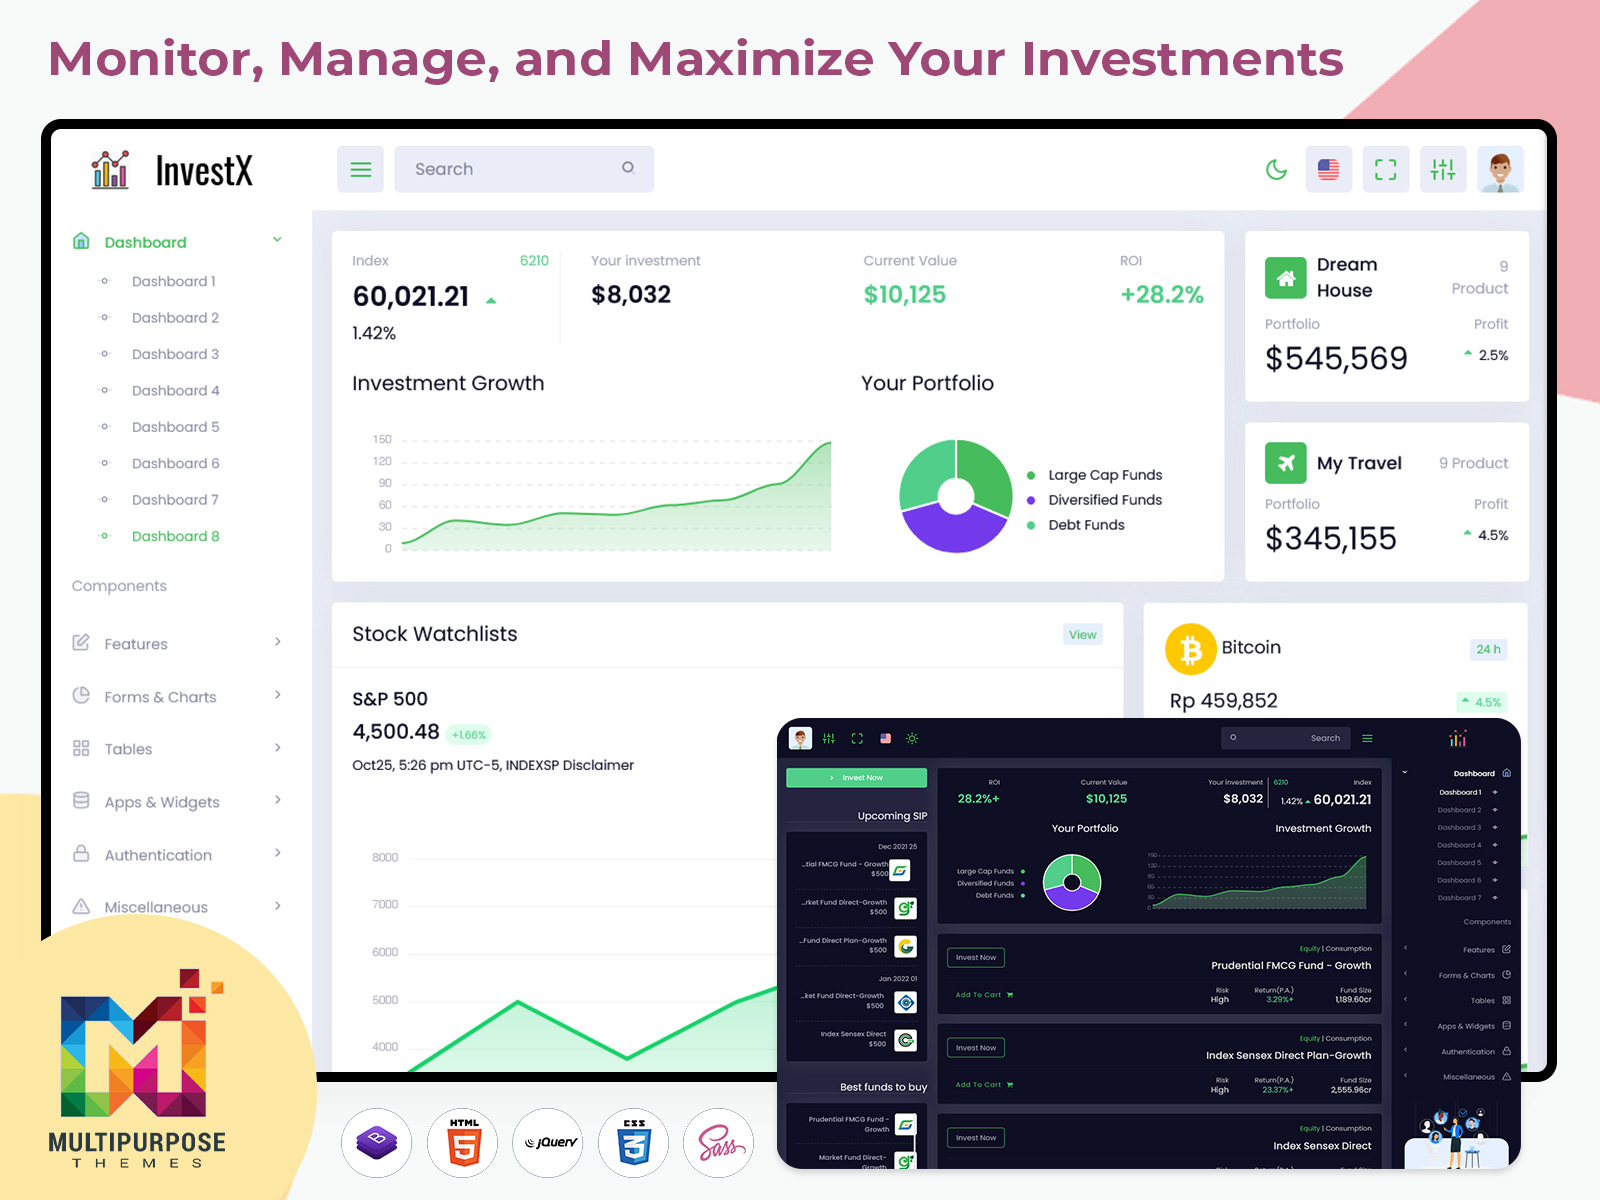
Investing in the stock market can be exciting, but it can also feel overwhelming when you are managing multiple stocks, tracking price changes, and analyzing performance data every day. This is where a Stock market dashboard becomes an essential tool for investors. Instead of switching between trading apps, spreadsheets, and financial news platforms, you can view everything in one organized space.
A well-designed Investment dashboard helps you monitor market trends, track gains and losses, and make informed decisions quickly. Whether you are a beginner investor or an experienced trader, having a clear overview of your portfolio reduces confusion and improves confidence. By combining a Portfolio dashboard with a Watchlist dashboard, you can easily keep an eye on both your active investments and potential opportunities. A Stock market dashboard turns complex market data into simple charts and insights that are easy to understand and act upon.
Watch Full Video
Key Features of a Stock Market Dashboard
Real-Time Market Tracking
One of the most important features of a Stock market dashboard is real-time data updates. Investors need instant access to stock prices, percentage changes, and market movements. A responsive Investment dashboard ensures you are always looking at the latest numbers, helping you react quickly to market fluctuations.
Portfolio Performance Overview
A Portfolio dashboard gives you a complete summary of your holdings. It shows total investment value, overall profit or loss, asset allocation, and historical performance. With clear charts and visual indicators, you can easily understand how your investments are performing over time.
Smart Watchlist Management
A Watchlist dashboard allows you to track stocks you are interested in without investing immediately. You can monitor price changes, trading volume, and trends before making a decision. This feature helps investors plan better and identify the right entry points.
Data Visualization and Insights
A powerful Stock market dashboard uses graphs, heatmaps, and performance charts to simplify financial data. Instead of reading long reports, you can quickly interpret trends through visual summaries. This makes your Investment dashboard more practical and user-friendly.
Risk and Diversification Analysis
Managing risk is a key part of investing. A good Portfolio dashboard shows how diversified your investments are across sectors or asset types. This helps you balance your portfolio and reduce potential losses during market volatility.
Last Words
A well-structured Stock market dashboard is more than just a tracking tool; it is a decision-making companion for every investor. By combining features like a Portfolio dashboard, Watchlist dashboard, and a comprehensive Investment dashboard, you gain better control over your financial journey.
When all your market data, performance metrics, and stock insights are available in one place, investing becomes more organized and less stressful. Whether your goal is long-term wealth creation or short-term trading profits, using a reliable Stock market dashboard can help you stay focused, informed, and confident in every investment decision.
Related Posts


This Post Has 0 Comments