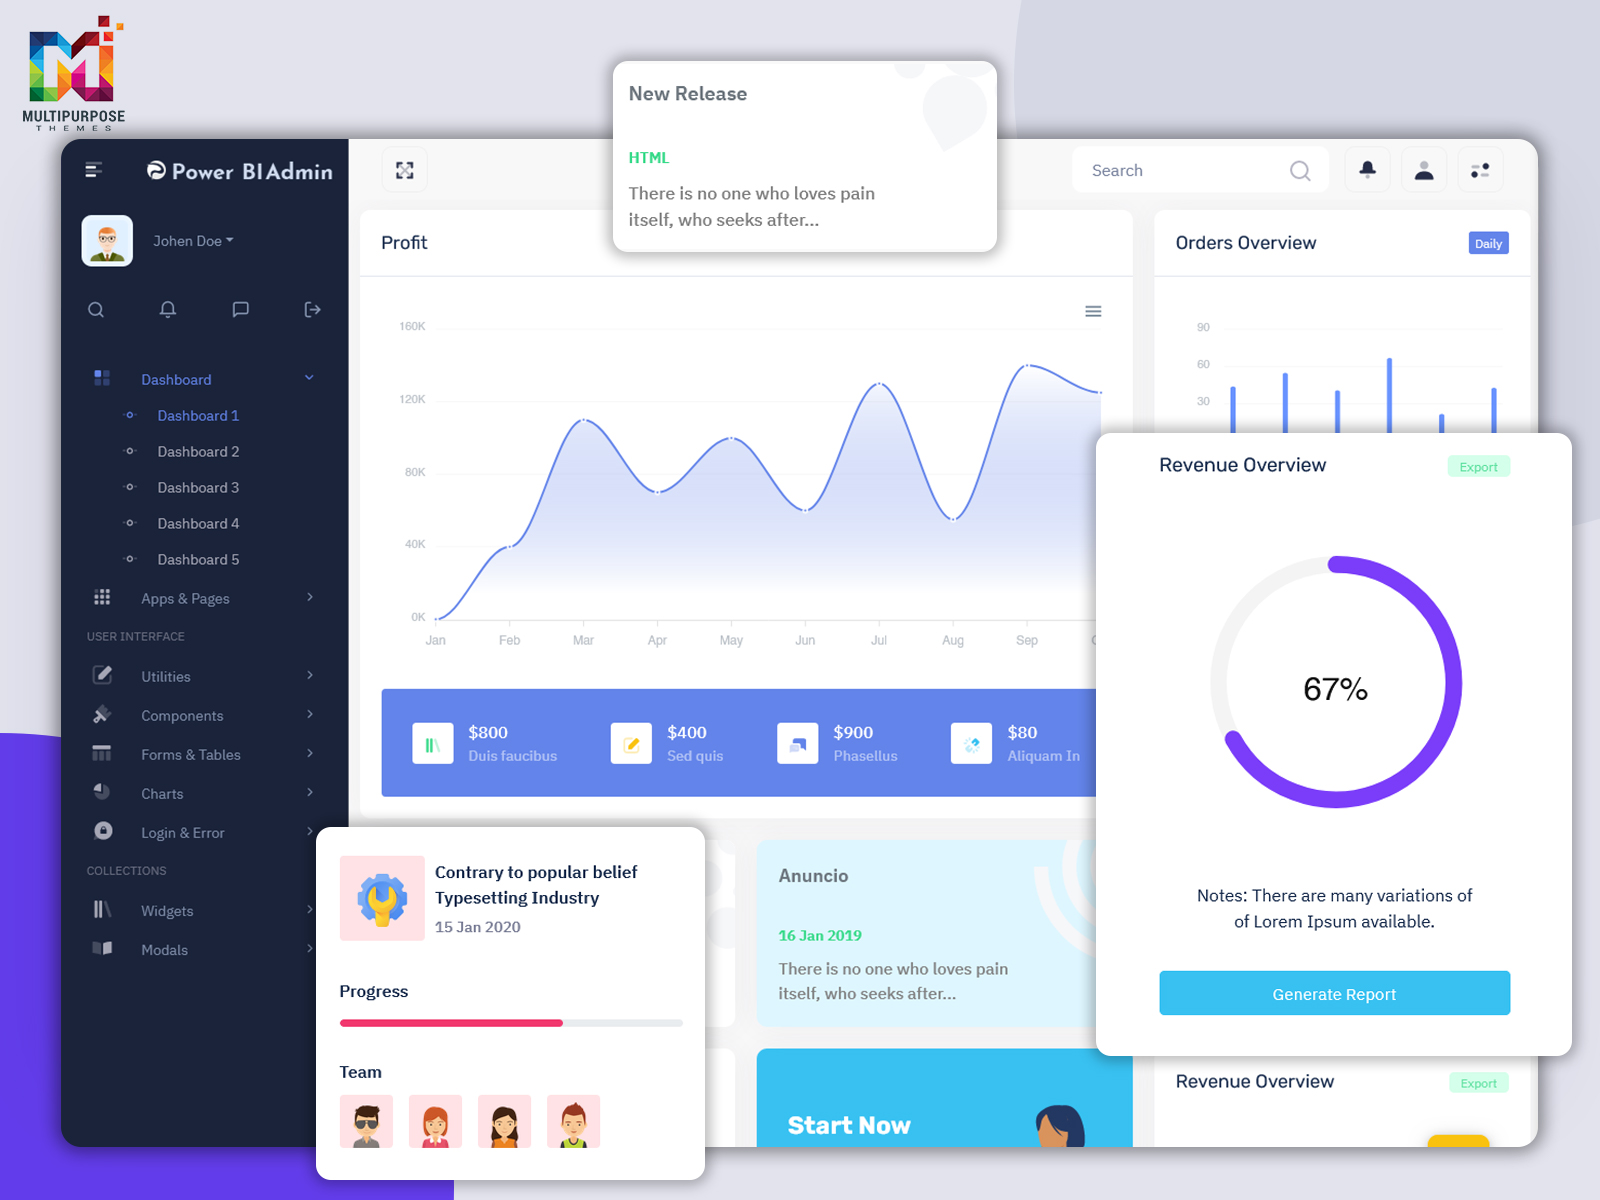
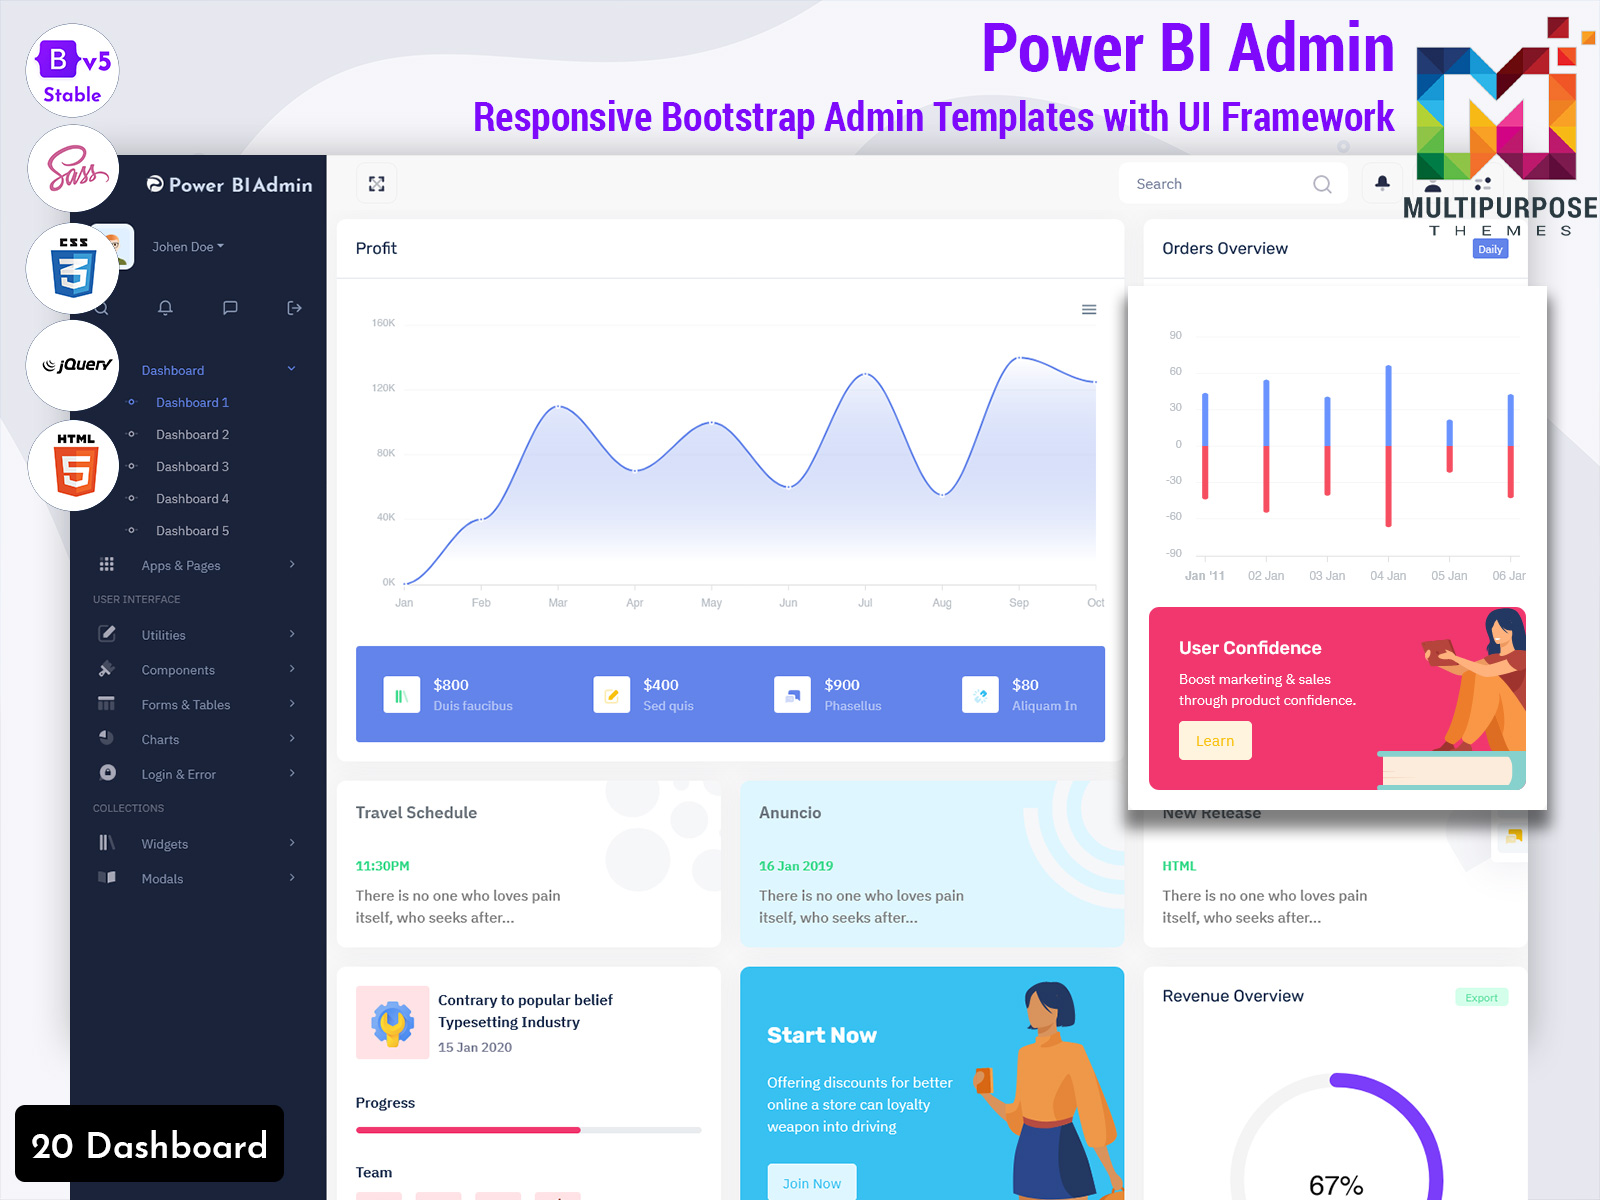
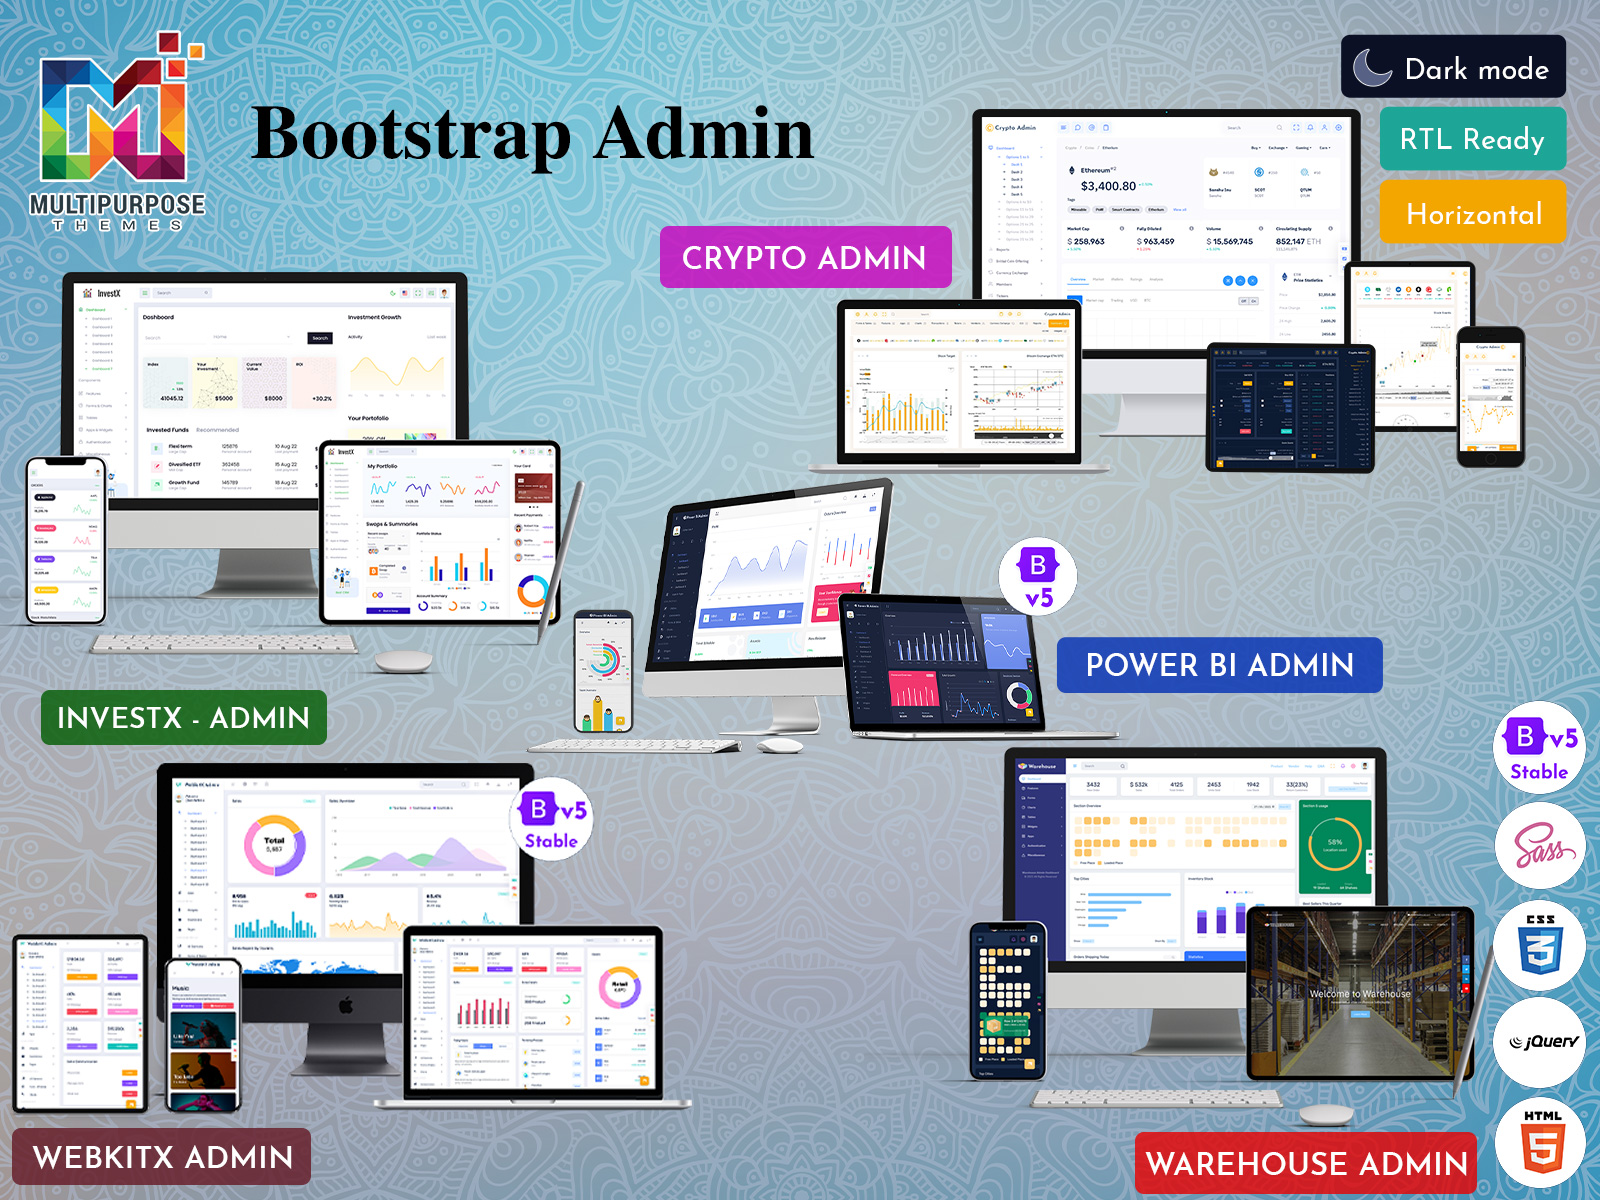
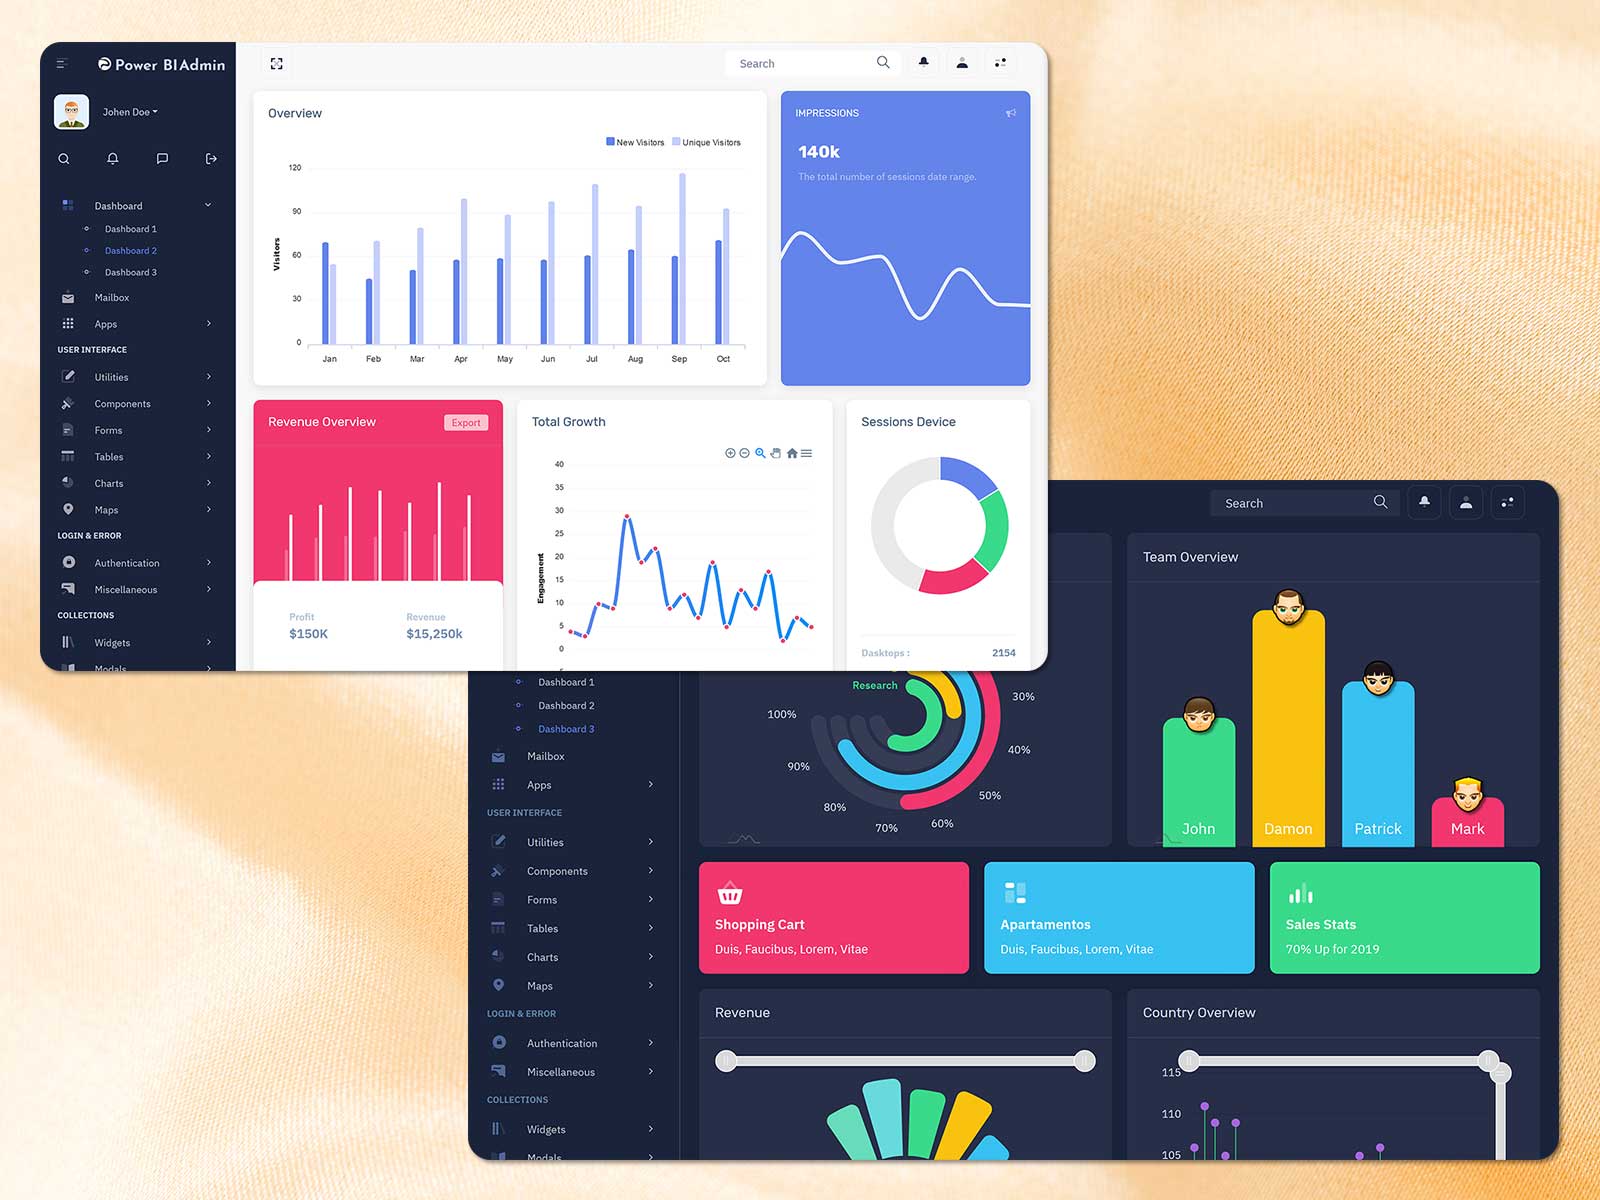
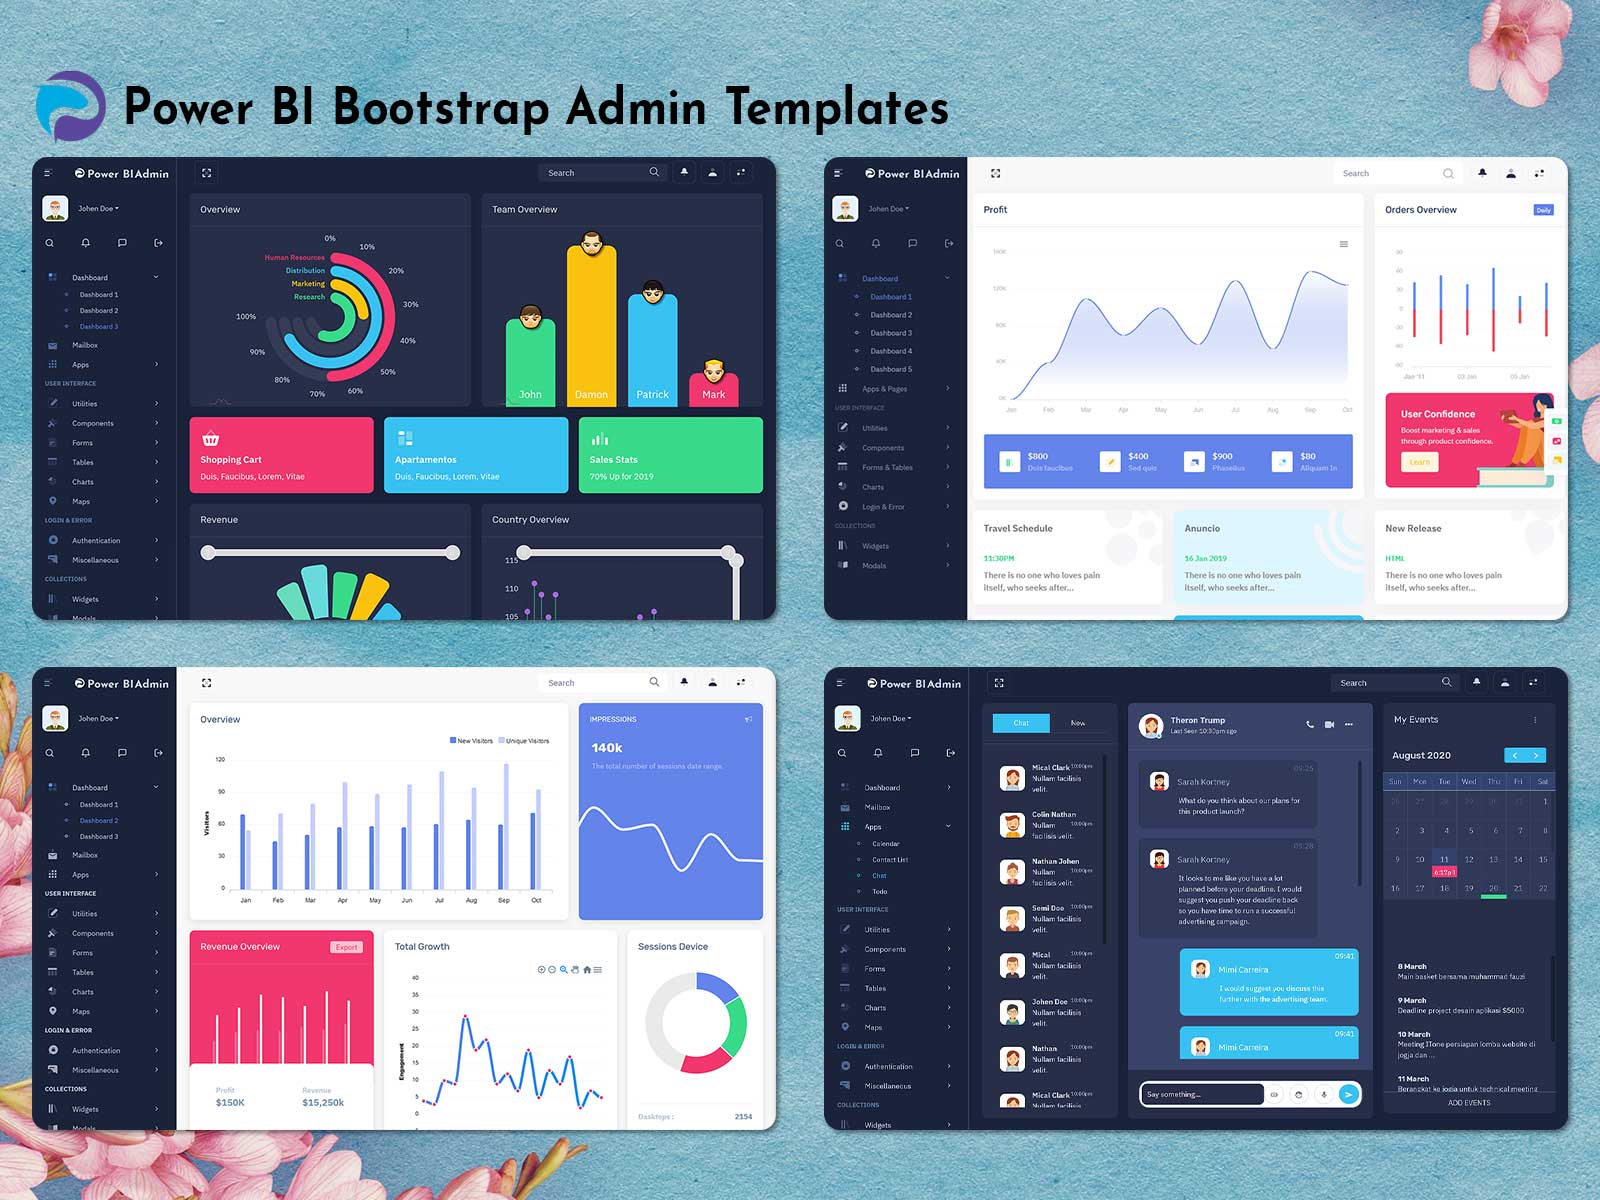
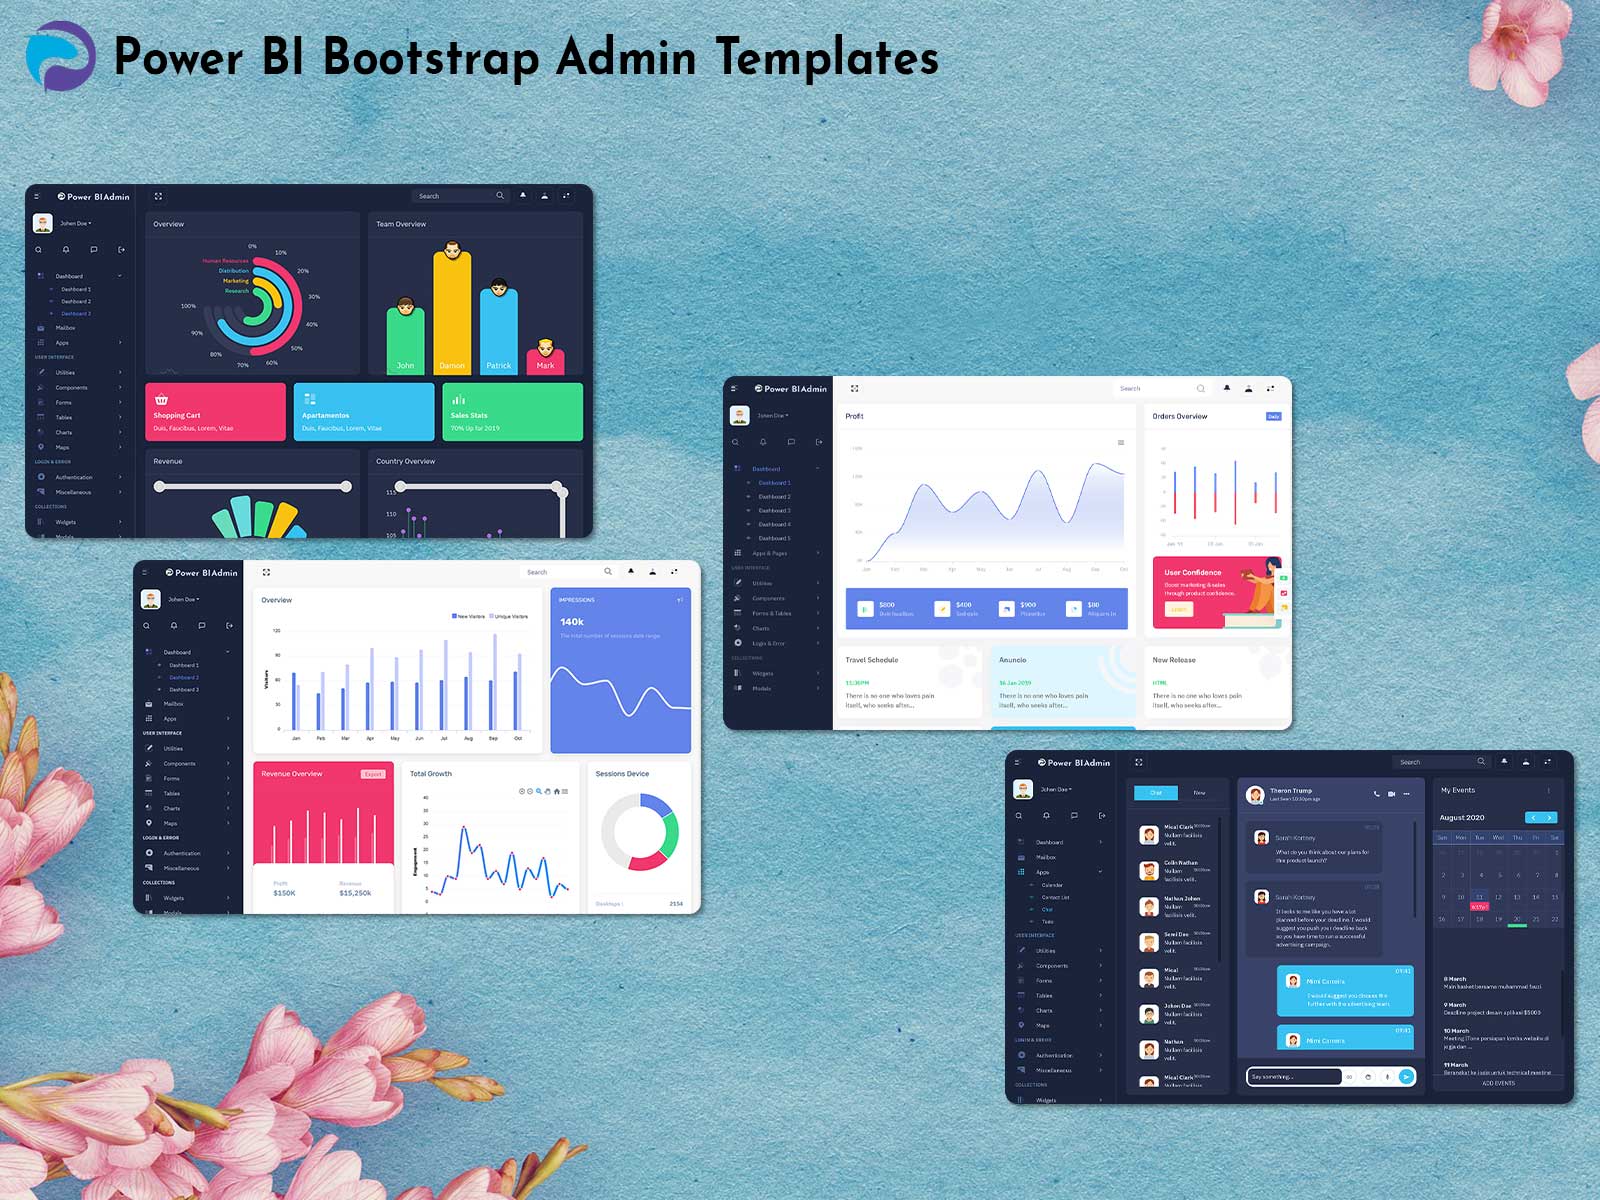
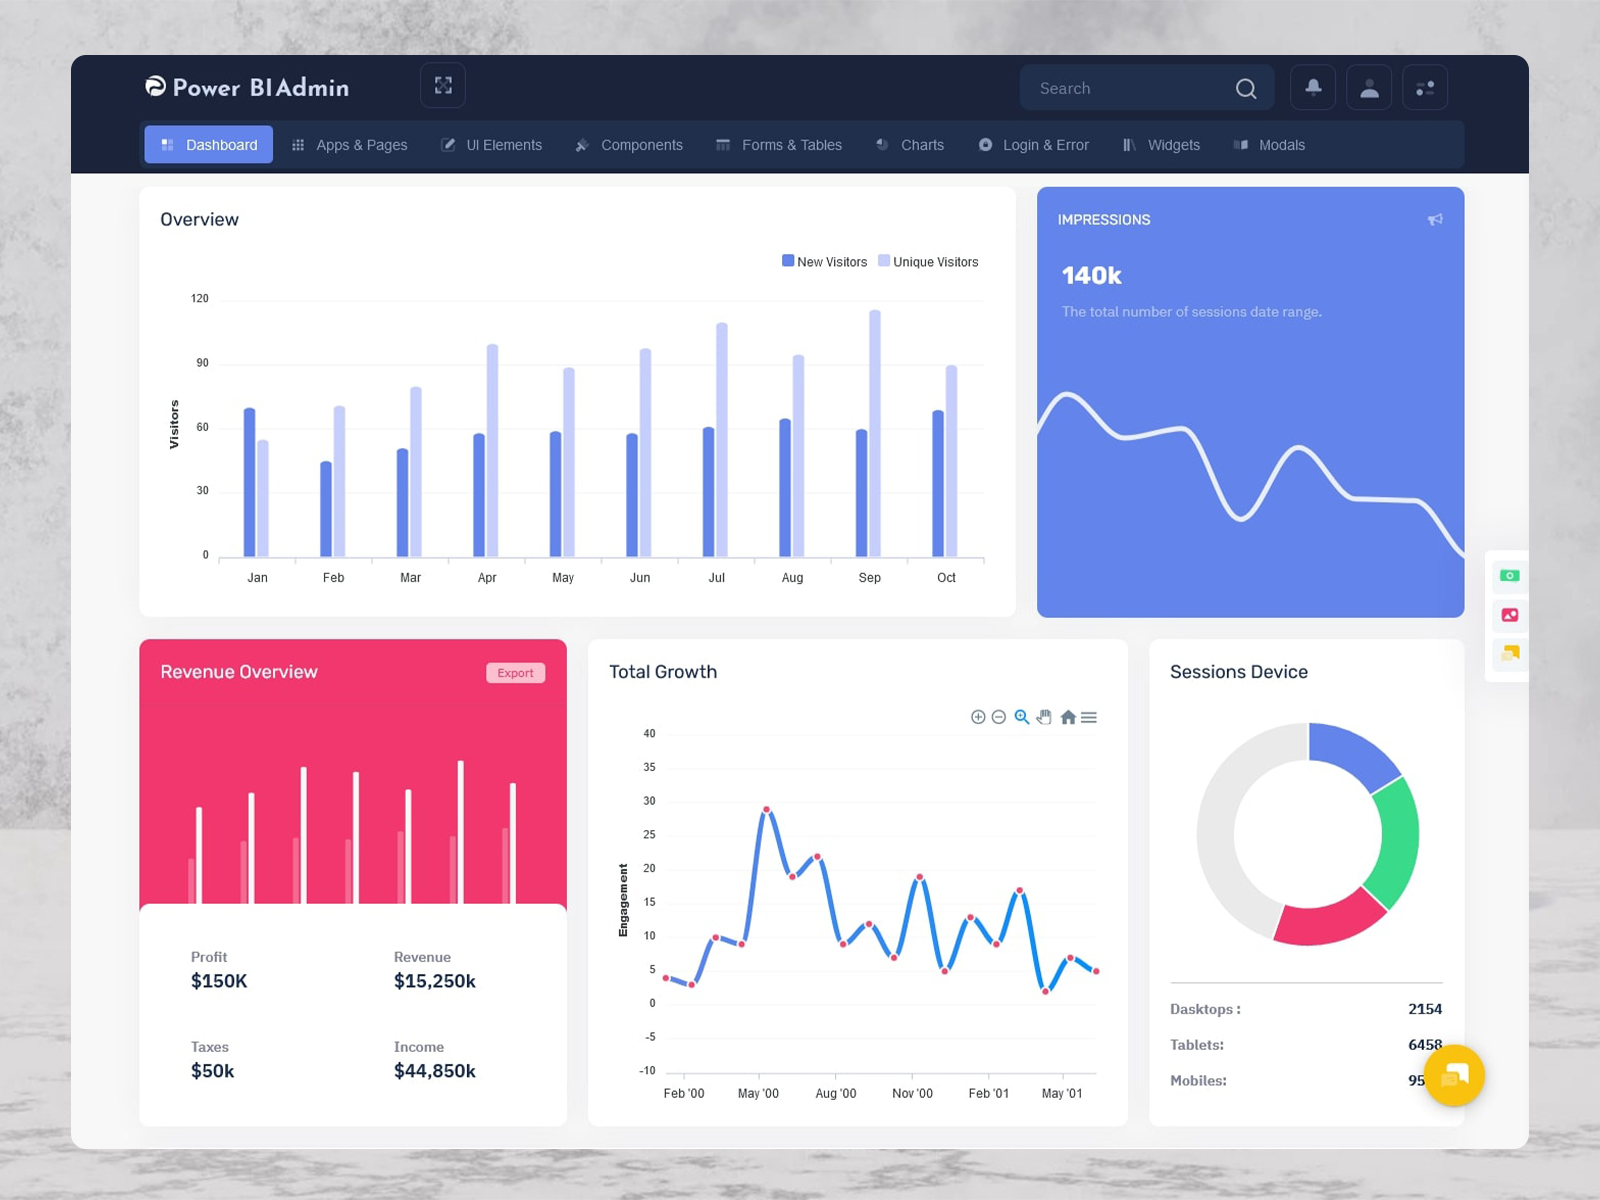
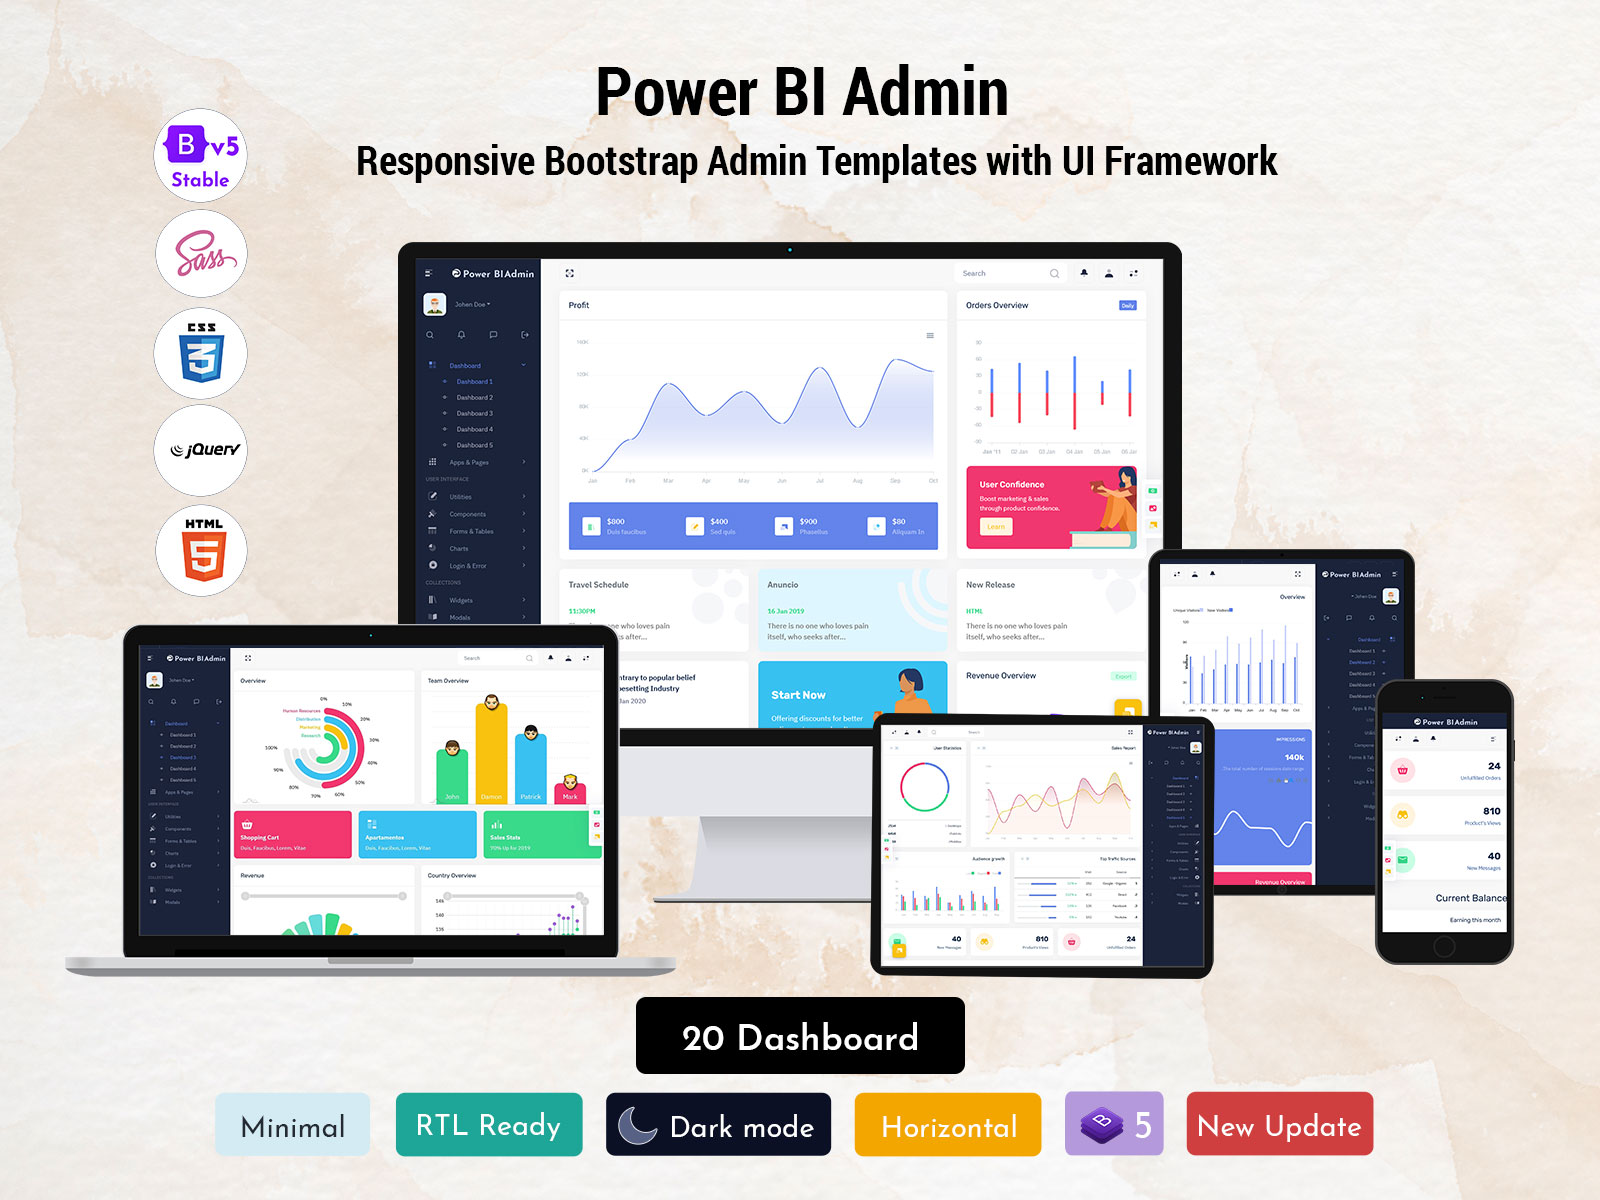
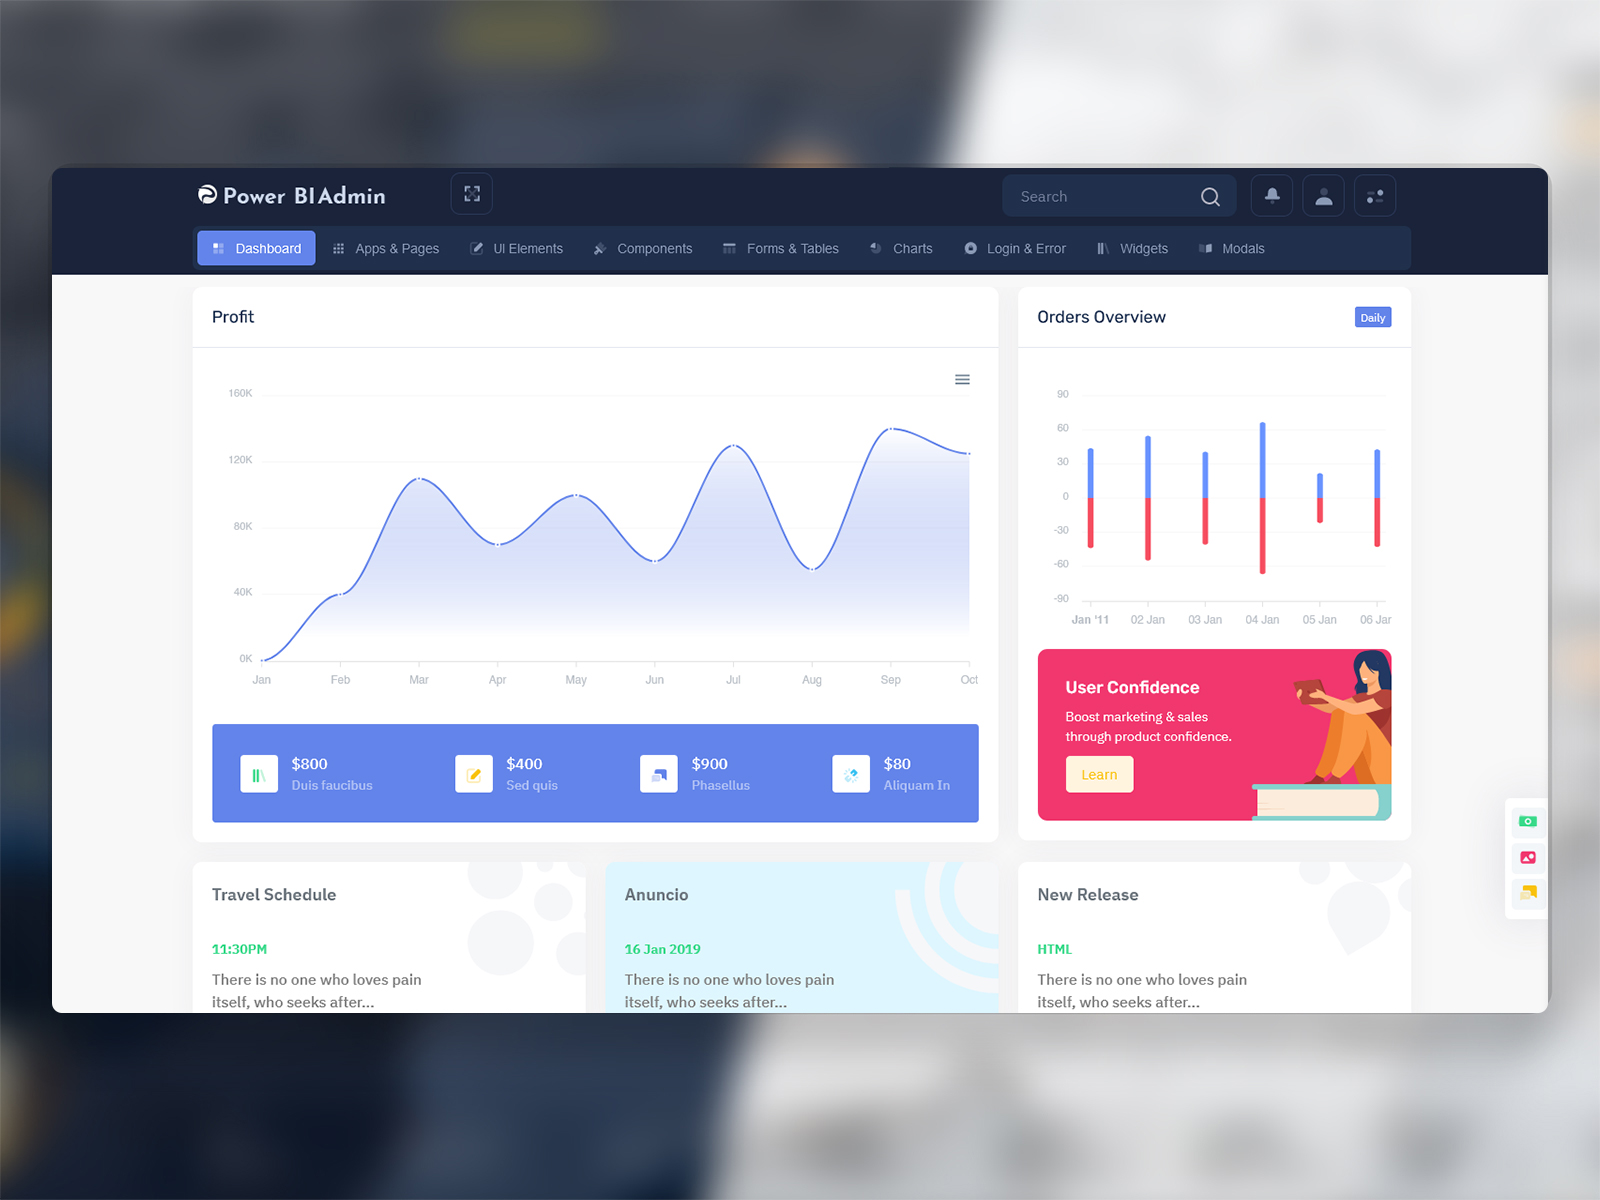
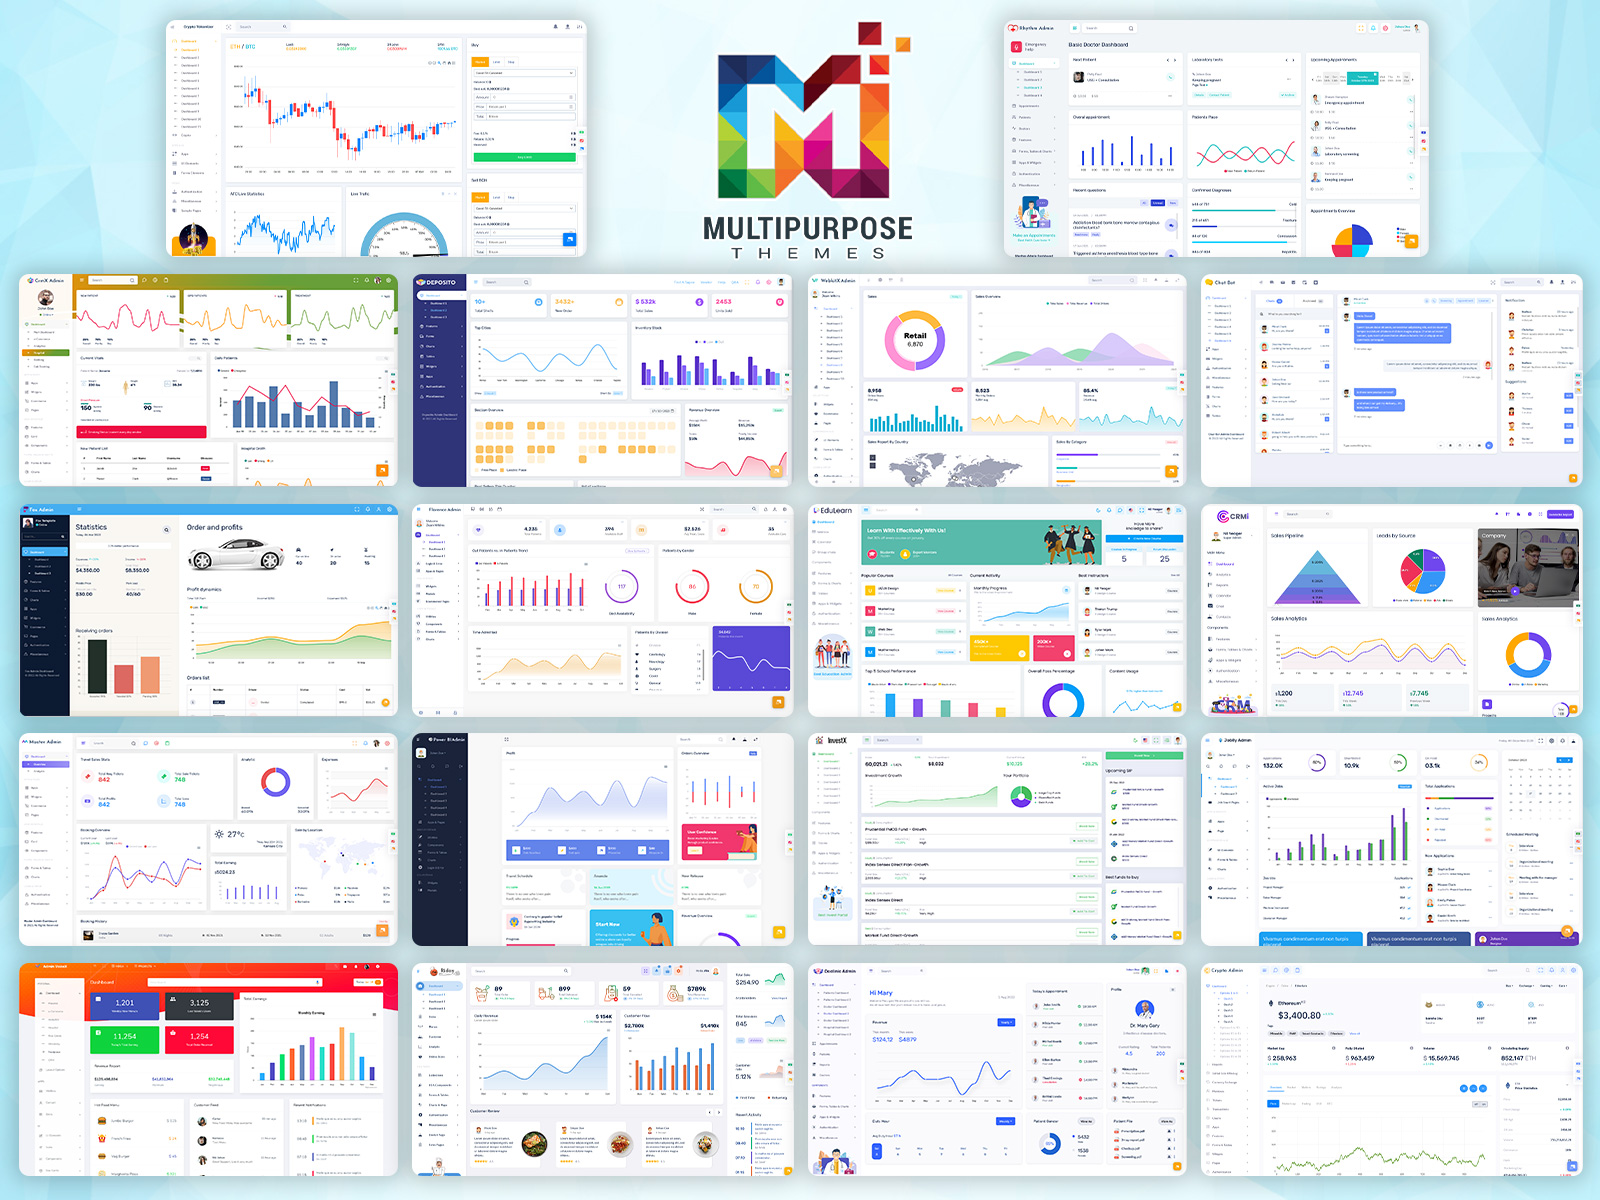
skip to Main Content

Power BI UI Framework on Bootstrap 5 – A Dashboard with visualisation.

An Introduction to Power BI UI FrameworkMicrosoft’s Power BI dashboards data analytics service that enables professionals to process, analyse, and visualise vast volumes of data. It helps extract insights, draw conclusions, and share results in the form of reports and dashboards across various departments. It provides an easy drag and drops feature with a range of interactive data visualisations to generate reports and Dashboard UI Design.
Read More

7 Essential Tips for Our Most Effective Power Bi Dashboard

Power Bi Dashboard serve as powerful tools for data visualization and decision-making in various industries. An effective dashboard not only presents information in a clear and concise manner but also offers an intuitive and visually appealing user interface (UI) design. In this article, we will explore seven essential tips for creating compelling Dashboard UI Design that enhance user experience and enable users to derive valuable insights effortlessly.
Read More

Discover our New Dashboard Software And Power Bi Dashboard

Importance of Power Bi DashboardIn today's data-driven world, businesses and organizations rely on streamlined data insights to make informed decisions and drive growth. An integral part of this process is the effective visualization and presentation of data through Software Dashboard templates, user interface (UI) design, and Power Bi UI framework. This article delves into the importance of streamlining data insights and explores the benefits of utilizing dashboard templates, UI design principles, and software solutions for data management.
Read More
Back To Top

Newsletter Sign up

Sign up to get Discount & Offers

[gravityform id="4" title="false" description="false" ajax="true" tabindex="1"]

preloader

However, write my essay for me services can alleviate this burden.