


Most homeowners go solar to save money. But here is what many people miss —…
Solar Dashboard: Solar Production Analytics and Energy Management
Reading Time: 6 minutes
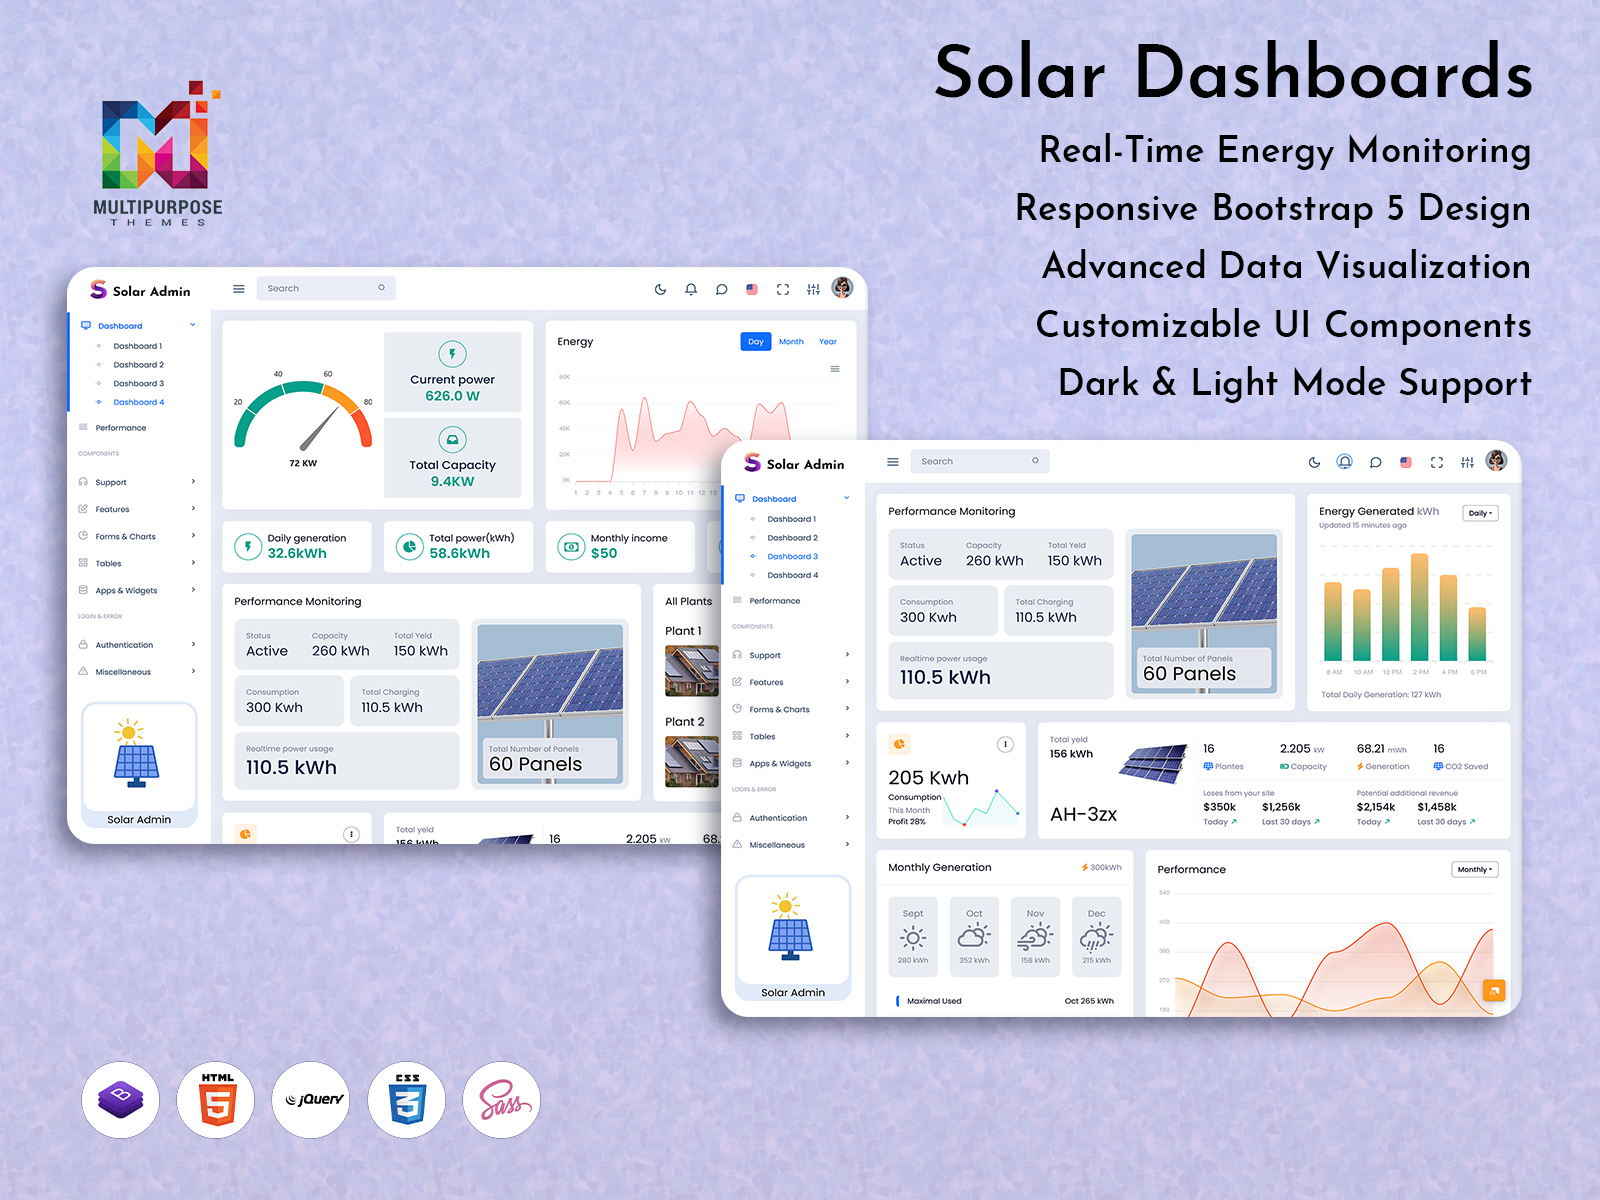
We’re excited to introduce our newly launched Solar Dashboard a powerful tool designed specifically for web applications related to solar energy management. This comprehensive Bootstrap 5 Admin Dashboard provides users with essential tools and insights necessary to maximize the benefits of solar power systems for both homeowners and energy managers.
Dashboards of Solar Admin
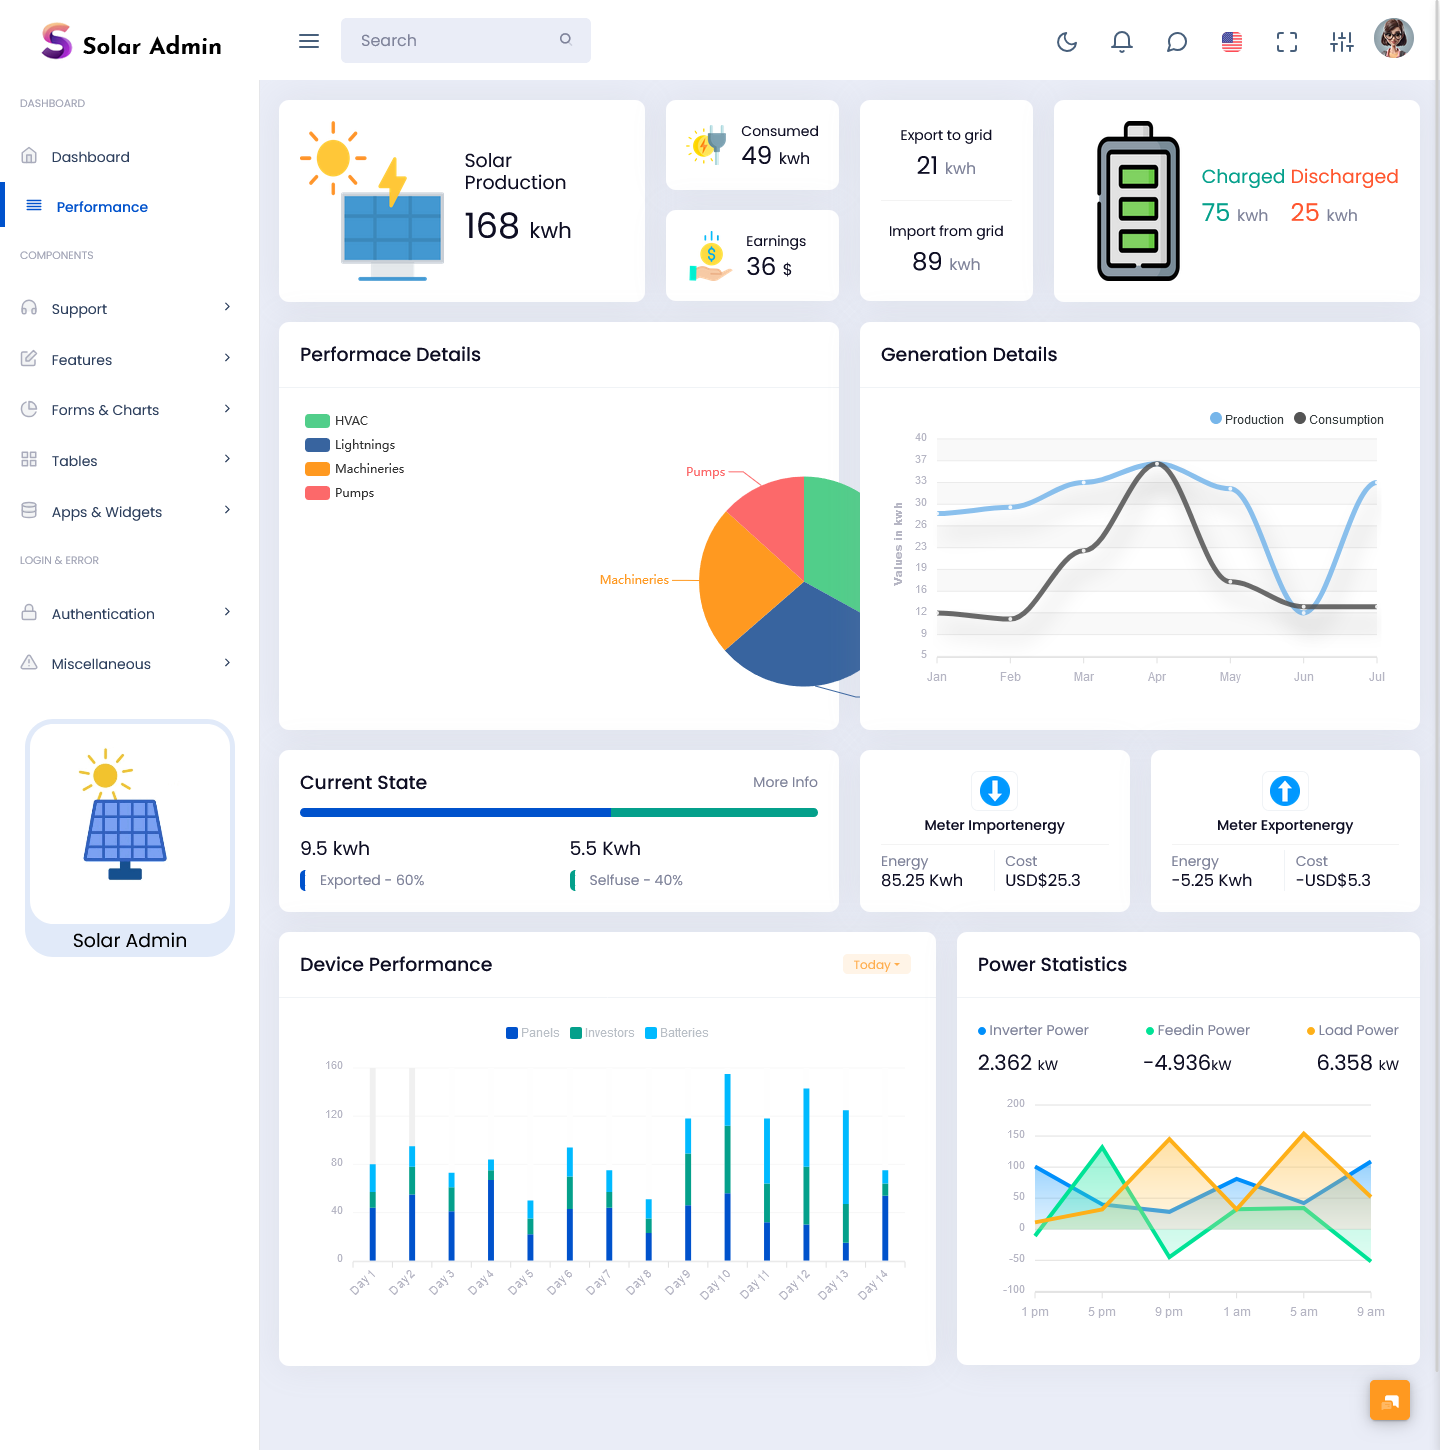
Vertical Dashboard – LTR Style – Light Version
MORE INFO / BUY NOW DEMO
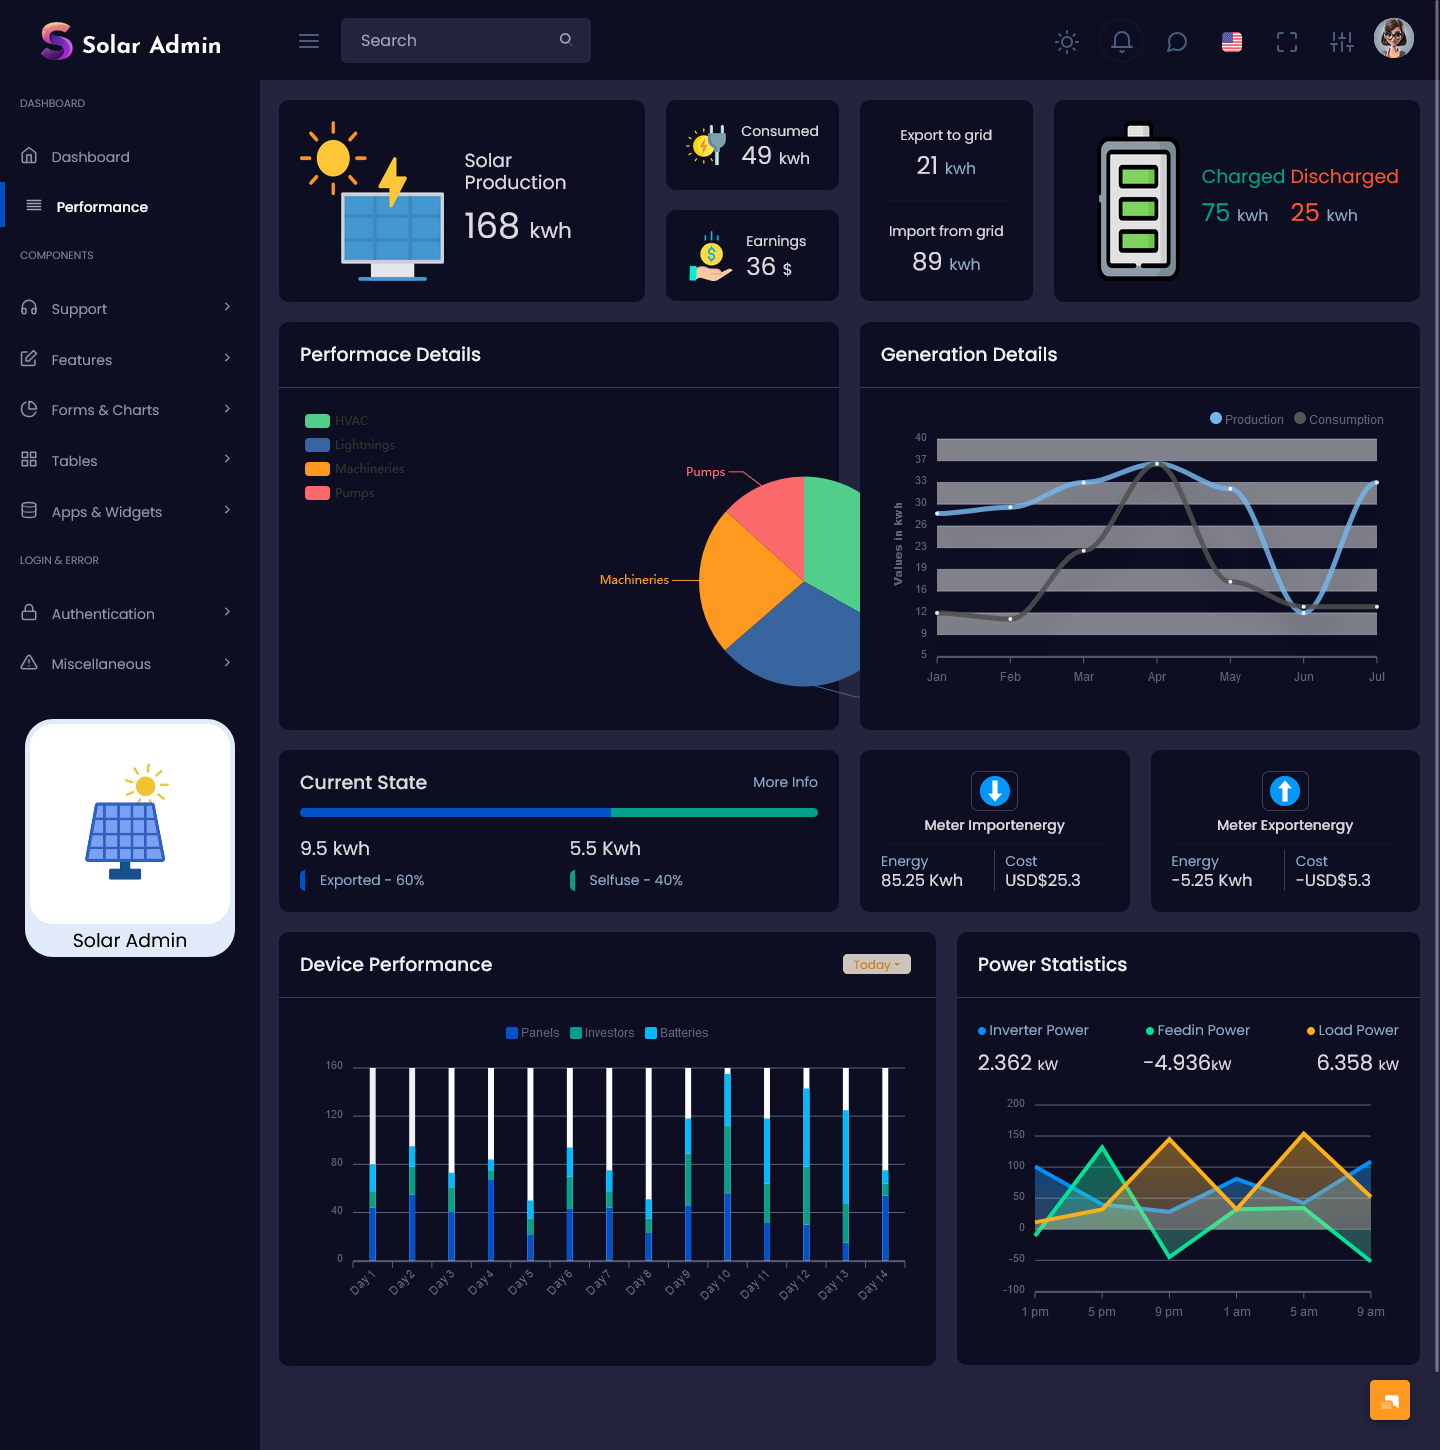
Vertical Dashboard – LTR Style – Dark Version
MORE INFO / BUY NOW DEMO
Performance Page of Solar Admin
LTR Style – Light Version
MORE INFO / BUY NOW DEMO
LTR Style – Dark Version
MORE INFO / BUY NOW DEMO
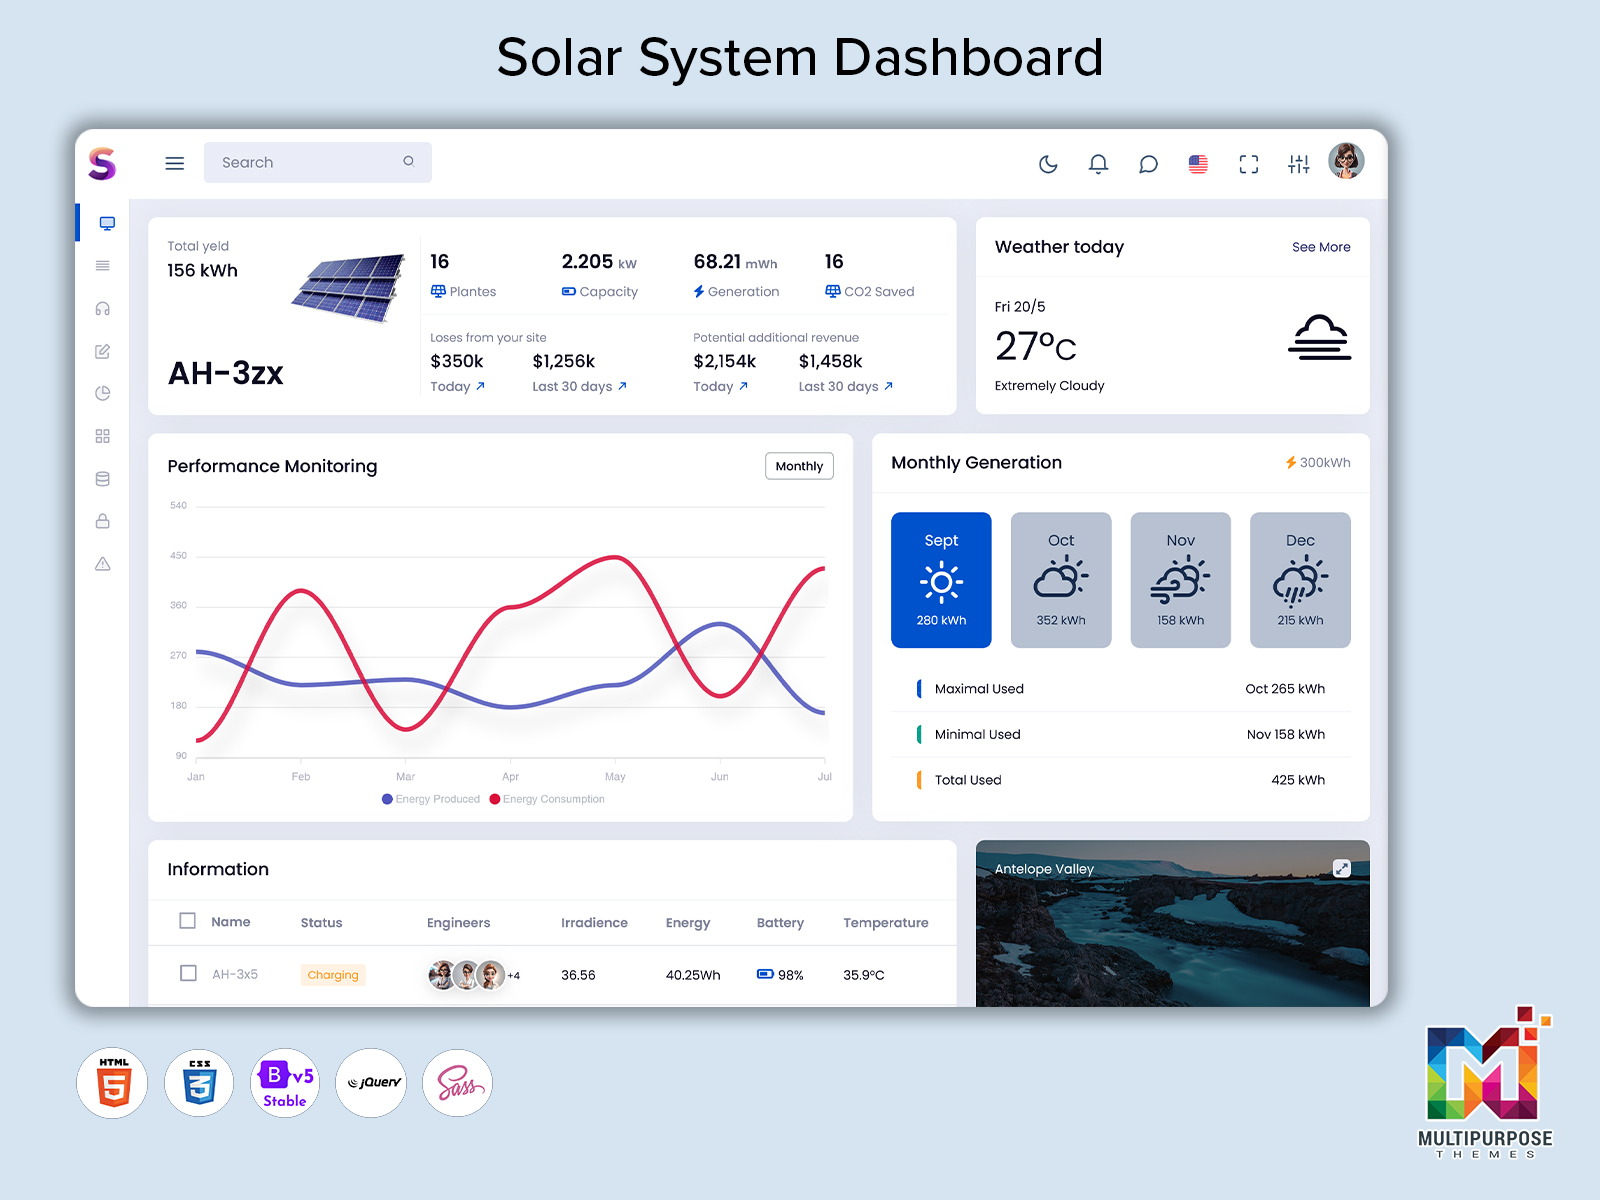
What is a Solar Dashboard?
A Solar Dashboard is a smart interface used to monitor, analyze, and manage the performance of a Solar Power System in real-time. It visually displays data such as solar energy production, system health, panel efficiency, and power usage. Whether accessed through a Solar Monitoring Mobile App, a Solar Web Dashboard, or a full-fledged Solar System App, it empowers users with actionable insights into their renewable energy usage.
Modern Solar Generation Dashboards are designed with intuitive UI to track energy outputs, savings, and environmental impact. These dashboards are compatible with residential, industrial, and Solar Commercial PV System installations, offering data transparency and performance metrics anytime, anywhere.
Key Features of the Solar Admin Dashboard
The Solar Dashboard is built with the latest Bootstrap 5 technology, ensuring a responsive and user-friendly experience. It encompasses a wide array of features, each meticulously designed to provide actionable insights into solar energy generation and consumption.
1. Solar Efficiency Section
Understanding solar efficiency is vital for optimizing energy production. Our Solar Efficiency Section provides clear visualizations and metrics that detail how efficiently solar panels are converting sunlight into usable energy. Users can track performance against expected benchmarks, allowing for quick identification of underperforming systems.
2. Power Generation Section
This section offers real-time data on the amount of energy generated by solar panels. Users can view daily, weekly, and monthly generation statistics, helping them understand trends and make informed decisions regarding their energy usage and system adjustments.
3. Energy Consumed Section
Monitoring energy consumption is just as important as tracking generation. The Energy Consumed Section allows users to keep tabs on how much energy is being used within the home or facility. This visibility is crucial for making informed choices about energy-saving practices and optimizing solar usage.
4. Performance Monitoring Section
To ensure solar systems are performing at their best, the Performance Monitoring Section provides an overview of key performance indicators. Users can monitor metrics such as energy output, efficiency ratios, and overall system health, allowing for timely interventions if issues arise.
5. Home Energy Consumption Section
This feature provides detailed insights into energy consumption patterns within the home. By visualizing data, users can identify high-consumption appliances and consider adjustments to reduce overall usage, maximizing the benefits of their solar setup.
6. Energy Consumption Chart
The Energy Consumption Chart presents data in a visually appealing format, making it easy to identify trends over time. Users can compare energy consumption against solar generation, providing a holistic view of energy dynamics.
7. Basic Information
For quick access to essential details, the Basic Information section presents vital statistics about the solar system, including installation dates, panel types, and warranties. This central repository of information helps users stay informed about their solar investment.
8. Yield Daily Section
Daily yield tracking allows users to monitor the amount of energy produced each day. This feature is invaluable for identifying performance fluctuations and understanding how daily conditions affect energy generation.
9. Battery Status
With the increasing importance of battery storage in solar systems, our Battery Status feature provides real-time updates on battery health and charge levels. This information is crucial for managing energy reserves effectively.
Enhanced Performance Page
In addition to the core features, the Solar Bootstrap 5 Admin Dashboard comes equipped with a dedicated Performance Page. This page is designed to offer deeper insights and analysis through a suite of powerful tools:
1. Solar Production Section
This section focuses on the actual solar production data, comparing it against predicted outputs. Users can assess how their system is performing relative to expectations and historical data.
2. Performance Details Section
Dive deeper into the metrics that matter most with the Performance Details Section. This feature allows users to break down performance data by time period, panel type, and even specific locations, providing a granular view of system efficiency.
3. Generation Details Chart
Visualize generation data through the Generation Details Chart, which presents historical performance in an easy-to-understand format. This chart helps users track changes over time and understand the impacts of weather and seasonal variations on solar output.
4. Current State Section
This real-time section shows the current operational status of the solar system, highlighting any alerts or issues that may require immediate attention. Users can address problems proactively, ensuring continuous system efficiency.
5. Meter Import Energy & Meter Export Energy Sections
Understanding energy flow is crucial for optimizing usage. These sections provide insights into energy imported from the grid and energy exported back, allowing users to evaluate their net energy consumption and savings effectively.
6. Device Performance Section
This feature provides insights into the performance of individual solar devices, helping users identify which components are performing well and which may need maintenance or replacement.
7. Power Statistics Section
The Power Statistics Section aggregates key metrics to provide a comprehensive view of energy production and consumption. Users can track overall system performance and savings in one place.
Uses of Solar Dashboard
A Solar System Dashboard plays a vital role in maintaining and maximizing the output of your solar setup. Here’s how it’s used:
– Real-time Performance Tracking: Monitor your system’s live data, including output, usage, and system uptime.
– Efficiency Analysis: Evaluate your Solar Panel Performance to detect underperformance or potential faults.
– Maintenance Alerts: Receive system alerts for low generation or faults via your Solar Monitoring Mobile App.
– Forecast & Analytics: Understand energy production trends using insights powered by Solar Designing Software.
– Reporting & Exporting Data: Access comprehensive performance reports via the Monitoring Dashboard for analysis or compliance.
Whether it’s through a Solar Meter Dashboard or a cloud-based Solar Web Dashboard, these tools simplify the complexities of solar power management.
Who Can Benefit from a Solar Charging Dashboard?
A Solar Charging Dashboard is beneficial for a wide range of users:
– Homeowners: Monitor home-based solar installations with a Solar System Monitoring App and track energy savings.
– Commercial Buildings: Companies using a Solar Commercial PV System can assess performance, ROI, and power load distribution.
– Solar Installers & Engineers: Use the Solar Dashboard to remotely diagnose and maintain multiple installations.
– Energy Consultants: Leverage detailed data to optimize systems and design better setups using Solar Designing Software.
– EV Charging Station Operators: Integrate with Solar Charging Dashboards to monitor solar-powered electric vehicle charging infrastructure.
Everyone from individuals to large-scale energy operators can benefit from smart, accessible solar insights delivered through advanced Solar System Dashboards.
Conclusion
The Solar Admin Solar Dashboard is a game-changer for anyone involved in solar energy management. Whether you’re a homeowner looking to optimize your energy consumption or an energy manager responsible for overseeing multiple systems, this dashboard offers all the necessary tools to enhance your solar energy experience.
With its intuitive design, powerful features, and detailed insights, our Solar Dashboard Template is set to empower users to make informed decisions about their energy usage and maximize the benefits of solar technology. Embrace the future of renewable energy management with our innovative Solar Admin Dashboard Template and take control of your solar energy journey today!
FAQs
1. What is the main purpose of a Solar Dashboard?
A Solar Dashboard is used to monitor, analyze, and optimize solar energy production and usage, offering real-time data on Solar Panel Performance and system health.
2. How does a Solar Charging Dashboard help in EV charging setups?
It allows users to monitor solar-powered EV charging efficiency, track charging data, and assess how much solar energy is powering vehicles through a Monitoring Dashboard.
3. Can I access the Solar Dashboard on my phone?
Yes. With a Solar Monitoring Mobile App or a Solar System Monitoring App, you can access your system’s performance data anytime from your smartphone or tablet.
4. Are Solar Meter Dashboards useful for commercial users?
Absolutely. Solar Meter Dashboards are vital for commercial users of Solar Commercial PV Systems, helping them monitor large-scale performance metrics and system diagnostics.
5. How accurate is the data shown in Solar Generation Dashboards?
Modern Solar Generation Dashboards use real-time sensors and cloud syncing to deliver accurate and up-to-date data on power production and consumption.
Related Posts


This Post Has 0 Comments