
A Bootstrap 5 Admin Dashboard is one of the most essential tools for modern web…

New Bootstrap 5 Admin Dashboard Added with Smart Features in Admin Template
Reading Time: 6 minutes
In today’s digital-first world, monitoring online performance is crucial for businesses to stay competitive. Data is no longer just numbers; it’s actionable insights that drive growth, improve strategies, and optimize customer engagement. Understanding this need, we have upgraded our Bootstrap 5 Admin Dashboard to provide a modern, visually appealing, and highly interactive platform for performance analytics.
This Novo Admin Template is designed as a complete solution for businesses, digital marketers, eCommerce platforms, and analytics teams to track traffic, user engagement, revenue, and performance trends efficiently. Built on Bootstrap Admin Template architecture, it ensures a responsive and smooth interface across all devices, empowering teams to act faster on data-driven insights.
Our upgraded Bootstrap Admin Panel focuses on clarity, visual simplicity, and functionality. The dashboard helps organizations easily monitor key performance indicators such as total visitors, clicks, commissions, bounce rate, user feedback, and recent activities. Whether you are managing a single web app or multiple digital properties, this WebApp Template provides all the tools needed to make informed decisions and improve overall business performance.
Let’s explore the features, industries, and benefits of this new Bootstrap 5 Dashboard in detail.
Introduce Next-Gen Digital Performance & Analytics Dashboard

BUY NOW DEMO
.
Features of the New Digital Performance & Analytics Bootstrap 5 Admin Dashboard
1. Clean, Modern, and Visually Appealing Performance Analytics Interface
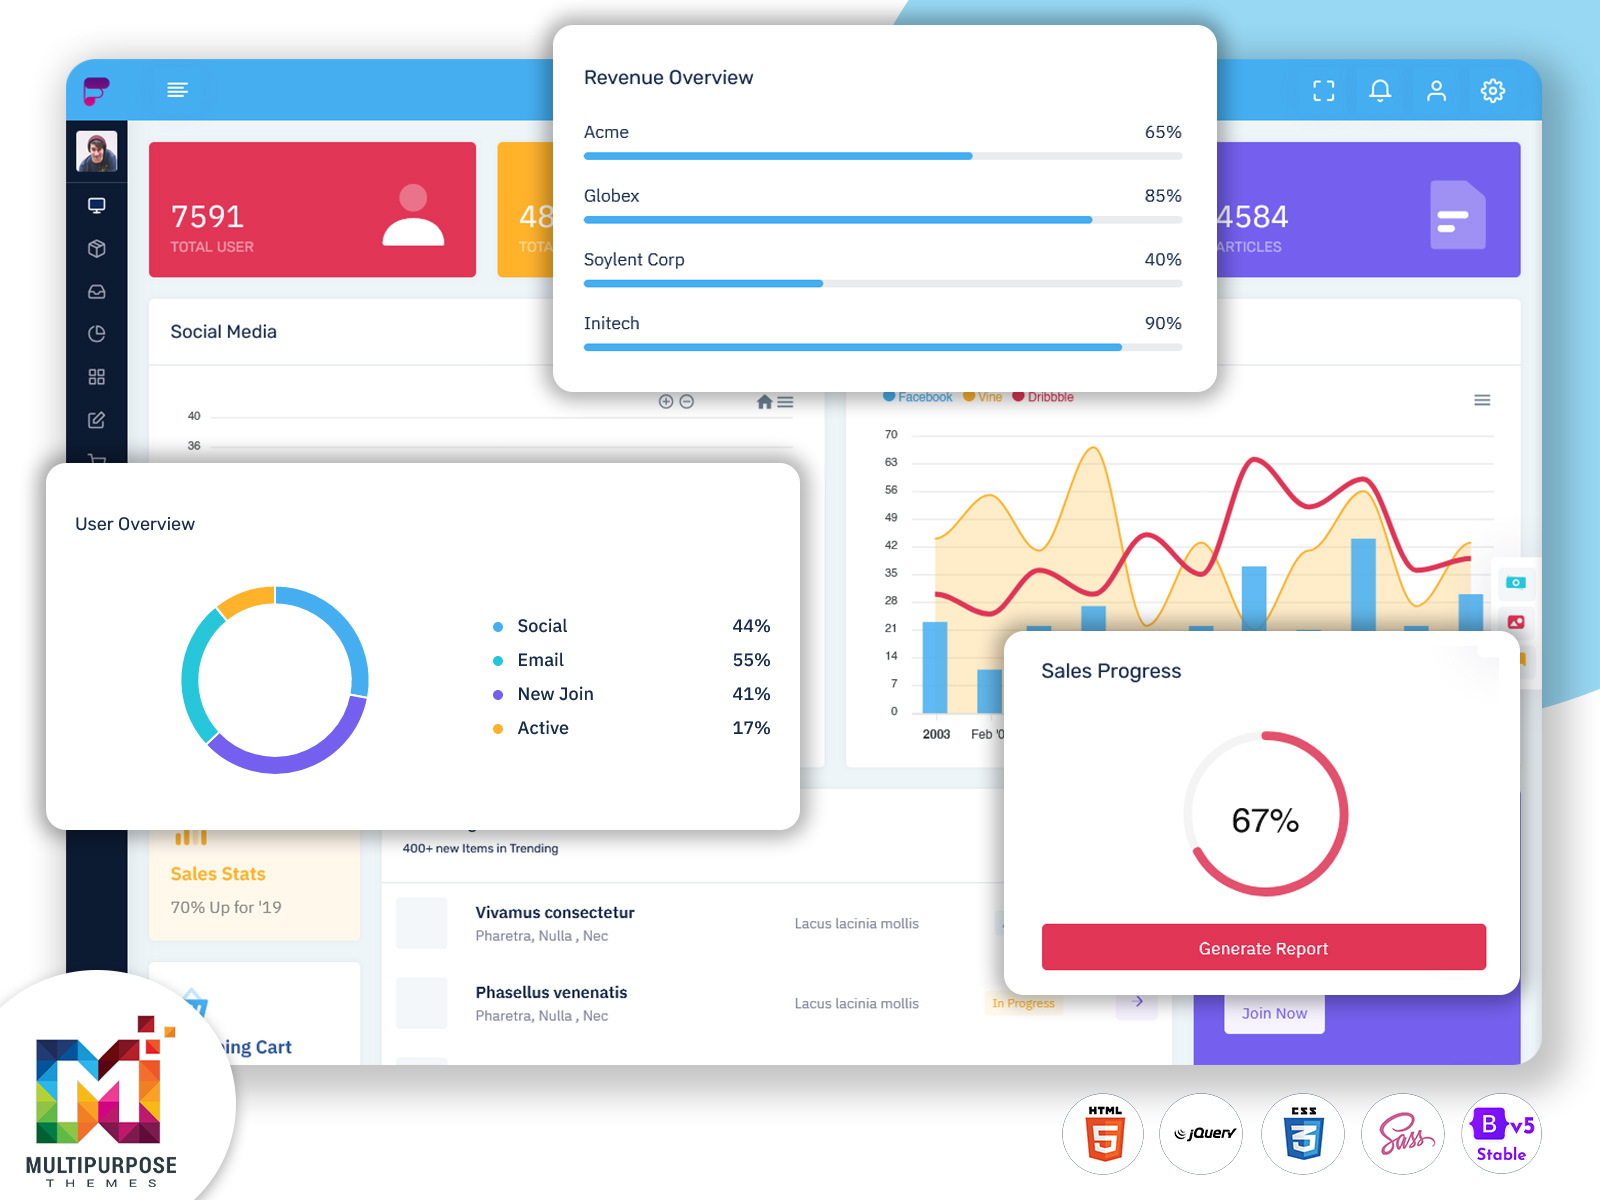
The Bootstrap 5 dashboard introduces a clean and modern interface that prioritizes usability and aesthetics. It uses a structured layout with bright colors, smooth typography, and organized sections for intuitive navigation. The Bootstrap Admin Template ensures responsiveness, enabling seamless access across devices. Users can focus on critical metrics without distraction, improving workflow efficiency and decision-making speed. Its visually appealing interface makes data analysis enjoyable and simple, even for beginners.
2. Display of Top Metrics: Total Visitors, Clicks, Commissions & Bounce Rate
The home dashboard presents key metrics in summary widgets, allowing quick evaluation of overall performance. Users can monitor total website visitors, clicks, commissions, and bounce rates at a glance. These real-time statistics help identify trends, detect drop-offs, and optimize campaigns. With concise metrics displayed clearly, teams can quickly act on insights to increase engagement, maximize revenue, and improve conversion rates.
3. Interactive Sales and Performance Charts for Trend Comparison
The Admin Dashboard includes interactive charts for analyzing sales and performance trends over time. Users can compare data across different periods, evaluate marketing campaign effectiveness, and track revenue growth visually. These dynamic charts provide deeper insights into user behavior, engagement patterns, and financial performance. The interactivity allows teams to drill down into specific segments, making it easier to identify opportunities and take corrective actions promptly.
4. User Rating List to Track Feedback and Engagement Quality
Understanding customer feedback is critical for improving service and engagement. The Advanced Admin Template includes a user rating list, enabling teams to monitor satisfaction scores, comments, and engagement quality. This feature helps businesses identify top-performing content, products, or campaigns and address negative feedback efficiently. By tracking ratings and reviews, organizations can enhance customer experience, improve retention, and optimize offerings.
5. Recent Activity Table for Real-Time Updates and Monitoring
A real-time activity table displays the latest user actions, transactions, and interactions on the platform. Teams can track events such as purchases, form submissions, clicks, and other important activities instantly. This feature ensures nothing goes unnoticed, supporting prompt follow-ups and operational efficiency. Monitoring real-time updates also allows management to detect anomalies and respond quickly, improving overall system performance and user satisfaction.
6. Summary Widgets Providing Quick Access to Essential Stats
Quick-view summary widgets give immediate access to essential statistics, enabling efficient tracking of key business indicators. Users can see aggregated information on sales, traffic, conversions, and engagement without switching between pages. These widgets improve productivity, reduce time spent searching for data, and simplify decision-making. By providing a concise snapshot of performance, the Bootstrap Admin Dashboard ensures teams remain focused and proactive in achieving business goals.
7. Total Sales Graph to Analyze Revenue Progress Efficiently
The total sales graph provides a visual representation of revenue progress over time. Teams can track growth patterns, identify peak sales periods, and compare performance month-to-month or year-to-year. This feature supports forecasting and strategic planning, enabling businesses to make informed decisions about inventory, campaigns, and resource allocation. Visualizing revenue trends helps management understand the bigger picture and optimize profitability.
8. Bright and Well-Organized Layout for Easy Data Visualization and Reporting
The Admin Dashboard layout is designed for simplicity and clarity, with bright colors and organized sections for easy navigation. Users can quickly locate the data they need, reducing confusion and improving efficiency. Reporting becomes seamless as visualized data can be shared with teams or stakeholders without additional formatting. This structure ensures actionable insights are easily accessible, making the UI Dashboard a powerful tool for decision-makers.
9. Designed to Support Fast Decision-Making and Performance Tracking
Overall, the Dashboard UI is built to empower teams with speed and efficiency. By combining visual analytics, real-time data, summary widgets, and interactive charts, it supports faster decision-making and effective performance monitoring. Whether tracking marketing campaigns, analyzing user engagement, or managing revenue, this Bootstrap Admin Panel provides a comprehensive solution that saves time and enhances productivity.
Industries That Can Use This New Digital Performance Dashboard
1. E-commerce & Online Retail
E-commerce platforms can use this dashboard to track visitor traffic, sales performance, and conversion rates. Interactive charts and total sales graphs help optimize marketing campaigns and inventory planning. Customer feedback and user ratings provide actionable insights to improve the shopping experience. With real-time updates, e-commerce teams can respond quickly to trends and enhance profitability.
2. Digital Marketing Agencies
Agencies managing multiple clients benefit from tracking campaign performance, website engagement, and conversion statistics. The dashboard allows comparison of traffic sources, ad clicks, and client ROI. Summary widgets and charts help agencies report results efficiently, make data-driven recommendations, and optimize client strategies for better outcomes.
3. SaaS Platforms & Web Applications
SaaS providers can monitor user activity, subscription metrics, engagement trends, and retention rates using this WebApp Template. Real-time analytics and interactive charts help evaluate product adoption, identify churn risks, and improve user experience. The Analytical Dashboard ensures that platform administrators can take timely actions to enhance performance and revenue.
4. Financial Services & Investment Firms
Finance teams can track commissions, transaction volumes, and customer engagement efficiently. Summary widgets provide quick insights into key metrics, while performance charts support trend analysis. Real-time monitoring ensures timely decision-making for portfolio management, revenue tracking, and client reporting, improving operational efficiency and financial forecasting.
5. Travel & Hospitality
Travel agencies and hospitality businesses can use the Admin Dashboard to track bookings, visitor engagement, and revenue from different regions. Interactive charts provide insights into seasonal trends, user behavior, and campaign effectiveness. The user rating list helps monitor guest feedback, ensuring high-quality service and optimized marketing strategies for maximum bookings.
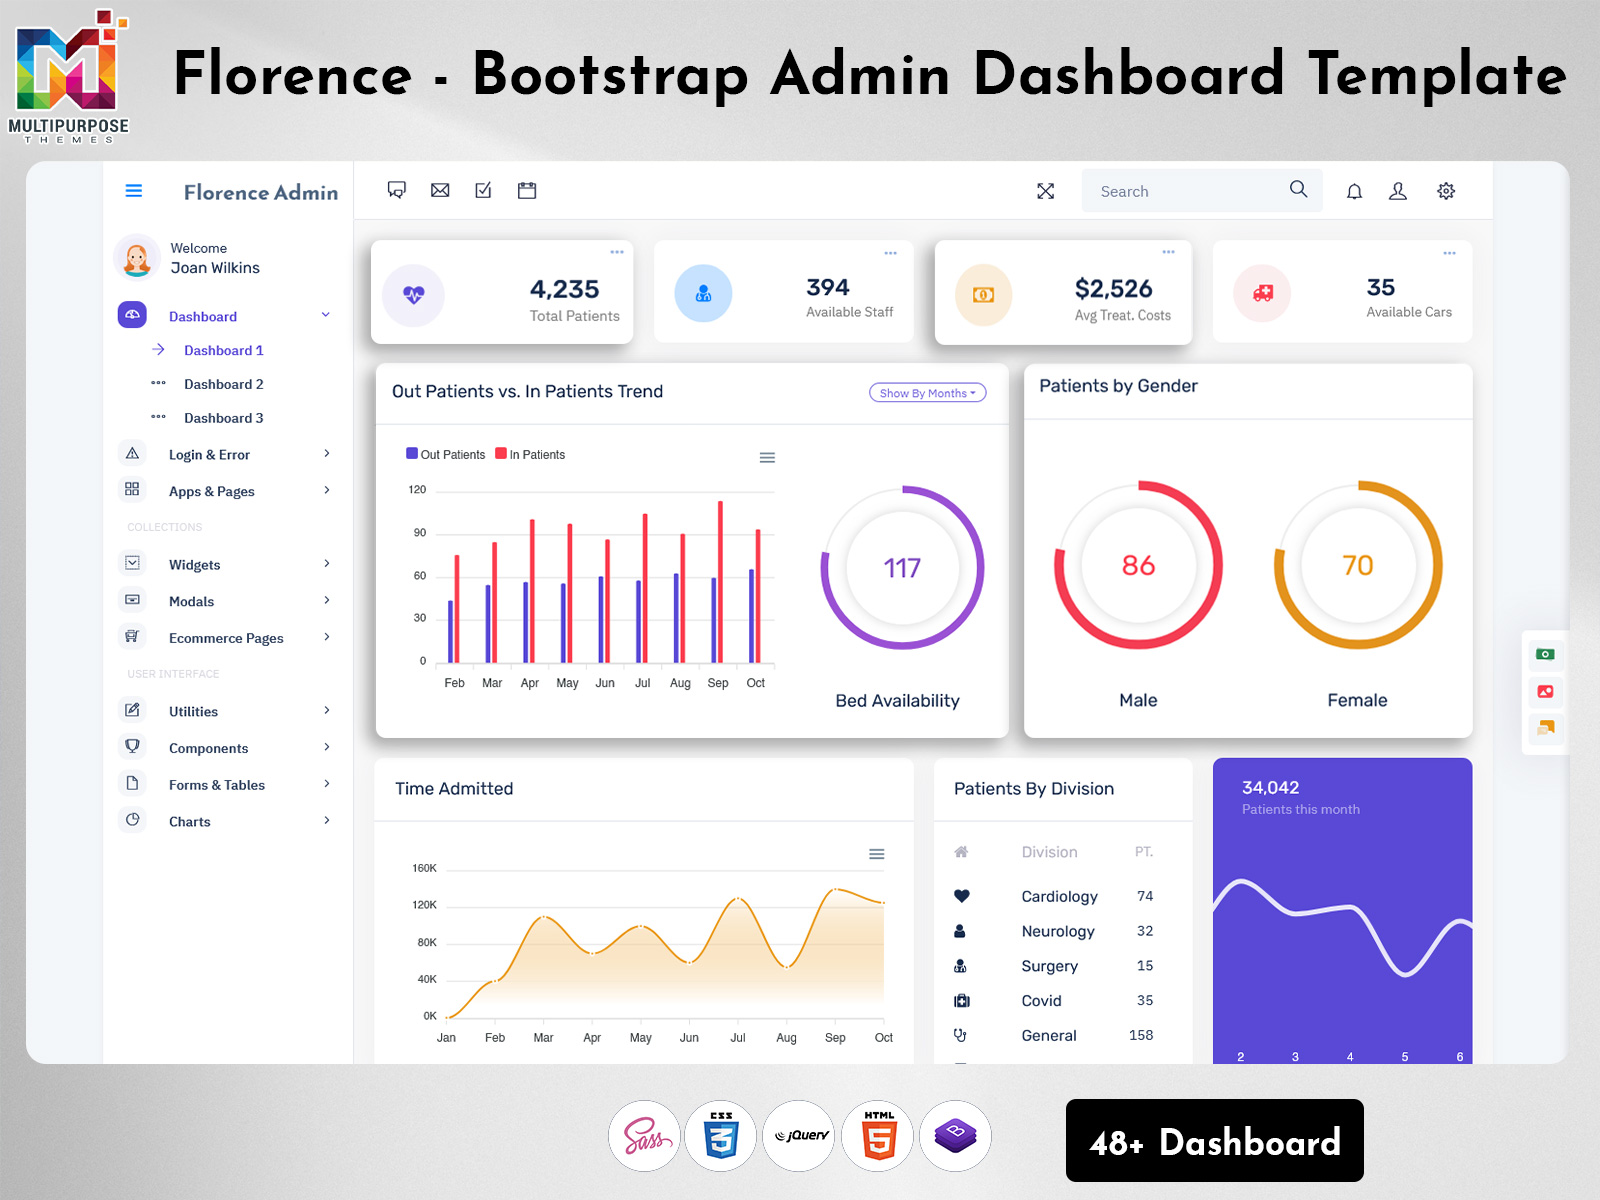
6. Healthcare & Telemedicine Platforms
Healthcare services and telemedicine platforms benefit from tracking user interactions, appointments, and service feedback. Analytics support monitoring of patient engagement, consultation metrics, and revenue trends. Real-time activity tables and performance charts help administrators improve service efficiency, patient satisfaction, and operational decision-making.
7. Education & E-learning Platforms
Educational institutions and e-learning platforms can monitor course performance, student engagement, and subscription revenue. The Admin Panel Dashboard tracks user ratings, activity trends, and completion rates. Interactive charts provide insights into learning patterns, helping educators optimize content and increase student satisfaction.
8. Real Estate & Property Management
Real estate firms can monitor property views, leads generated, agent performance, and revenue trends using the dashboard. Total sales graphs and interactive charts support decision-making for marketing campaigns, property allocation, and client engagement. Real-time activity monitoring helps agents respond quickly to inquiries and manage property listings efficiently.
Explore More Dashboards
Dashboard: 1
BUY NOW DEMO
Dashboard: 2
BUY NOW DEMO
Dashboard: 3
BUY NOW DEMO
Dashboard: 4
BUY NOW DEMO
Conclusion
The upgraded Bootstrap 5 Admin Dashboard is a powerful and visually engaging solution for digital performance tracking and analytics. Built as a responsive Admin Template, it provides real-time insights, interactive charts, and organized summary widgets for faster, smarter decision-making. With a clean and modern layout, this Bootstrap Admin Panel ensures easy navigation, efficient reporting, and actionable insights for various industries. Whether you manage a SaaS platform, e-commerce site, marketing campaigns, or web applications, this WebApp Template equips teams with the tools needed for improved performance and growth.
By integrating data visualization, trend tracking, real-time updates, and user engagement monitoring, businesses can stay ahead in their respective industries. This upgraded dashboard is not just a tool—it’s a comprehensive solution for performance optimization and strategic decision-making.
FAQs
1. What is a Bootstrap 5 Admin Dashboard?
A Bootstrap 5 Admin Dashboard is a responsive web-based interface for monitoring and analyzing business performance using structured visualizations and interactive charts.
2. Can this Admin Template track real-time metrics?
Yes, it updates metrics like visitors, clicks, commissions, and bounce rates in real time for accurate monitoring and faster decision-making.
3. What industries can benefit from this dashboard?
E-commerce, digital marketing, SaaS platforms, finance, travel, healthcare, education, and real estate industries can leverage this dashboard.
4. Does it include interactive charts and graphs?
Yes, the dashboard includes dynamic sales, performance, and revenue charts for trend comparison and deeper data insights.
5. Is this Bootstrap Admin Panel mobile-friendly?
Absolutely. Built with Bootstrap 5, it’s fully responsive and works smoothly across desktops, tablets, and mobile devices.
6. Can I monitor user engagement and feedback?
Yes, the user rating list and activity tables allow monitoring of engagement quality, feedback, and interaction trends effectively.
7. Does this WebApp Template include summary widgets?
Yes, summary widgets provide quick access to essential stats like traffic, sales, conversions, and engagement metrics.
8. Can the dashboard improve decision-making?
Yes, it visualizes complex data into clear insights, enabling faster and more informed strategic decisions.
9. Is this dashboard suitable for multiple web applications?
Yes, it supports multi-application tracking, making it ideal for SaaS platforms and businesses managing multiple properties.
10. How does the dashboard help analyze revenue trends?
The total sales graph and interactive charts track revenue progress over time, helping identify patterns, opportunities, and growth areas.
Related Posts


This Post Has 0 Comments