


An Education Dashboard is a powerful tool that brings together all essential academic data into…
Education Dashboards: Visualizing Data to Enhance Learning
Reading Time: 6 minutes
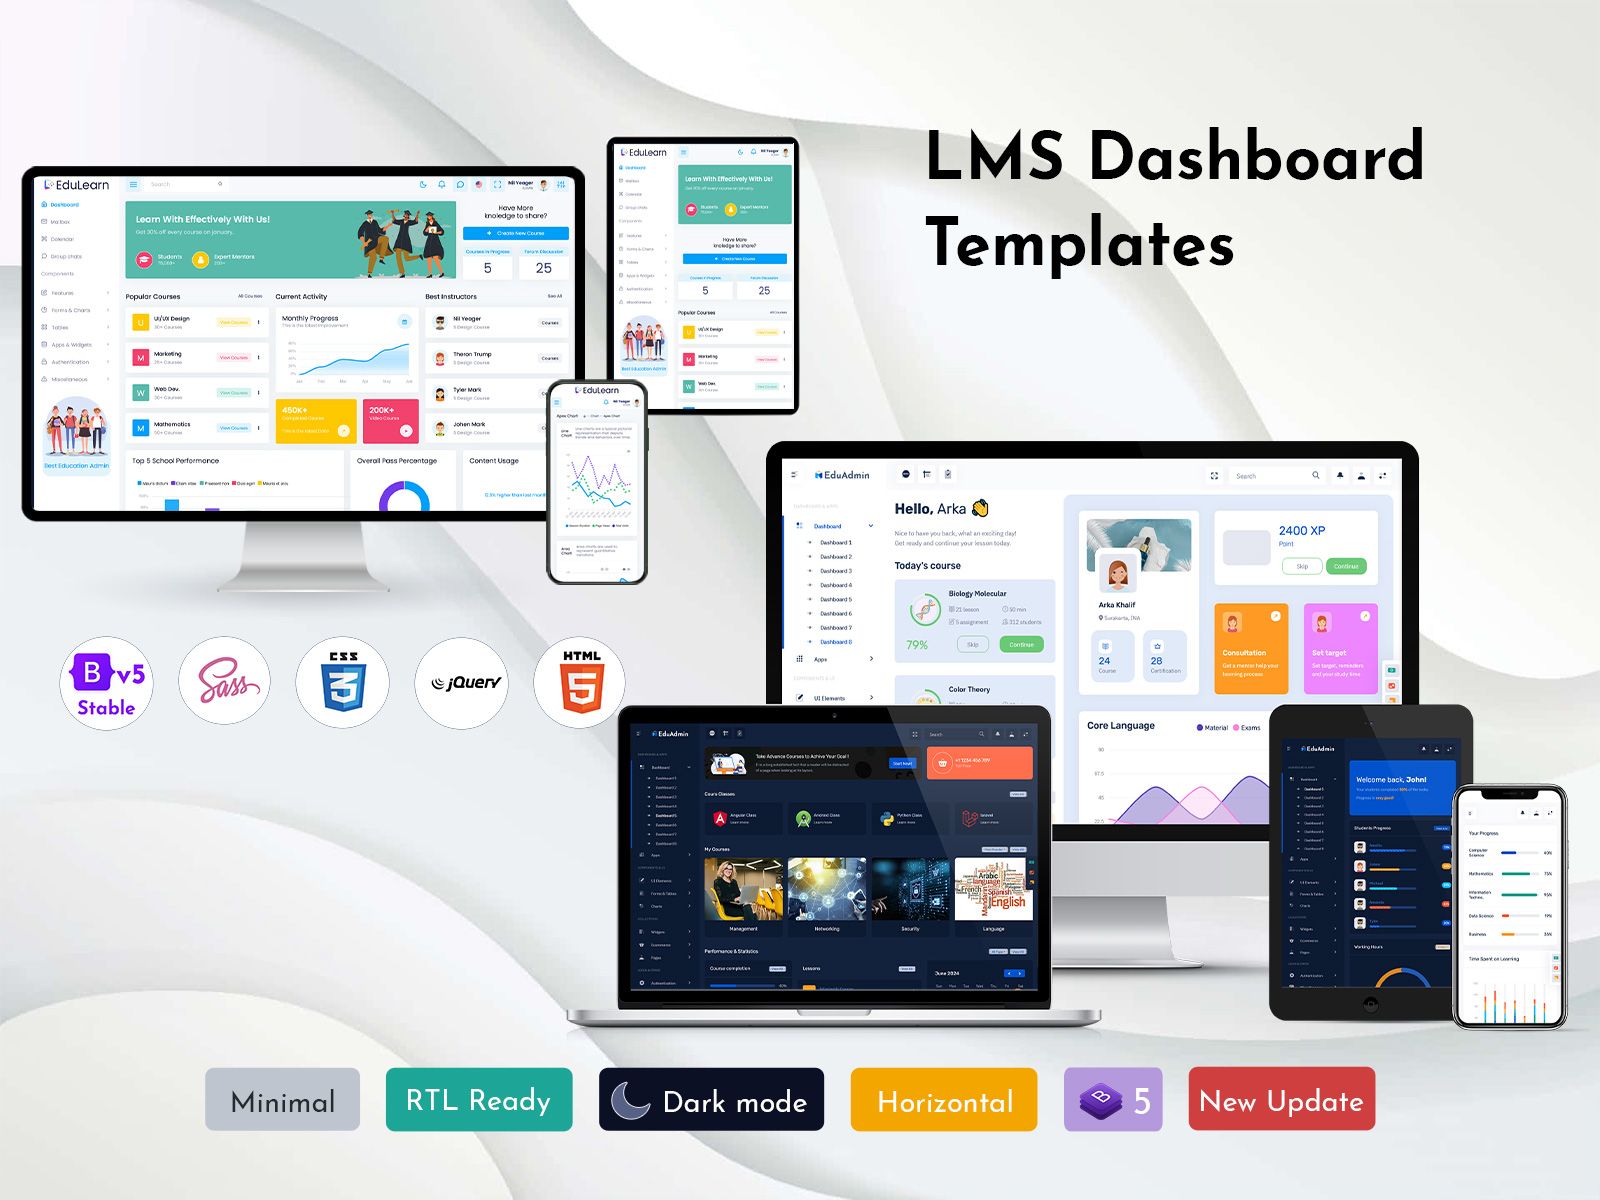
Dashboard technology has become an integral part of education in the digital age. Education dashboards are data visualization tools that consolidate various metrics into easy-to-interpret graphical displays, providing administrators and educators with at-a-glance insights into school or district performance. Well-designed LMS dashboard template empowers users to track key indicators and make data-driven decisions to improve student outcomes.
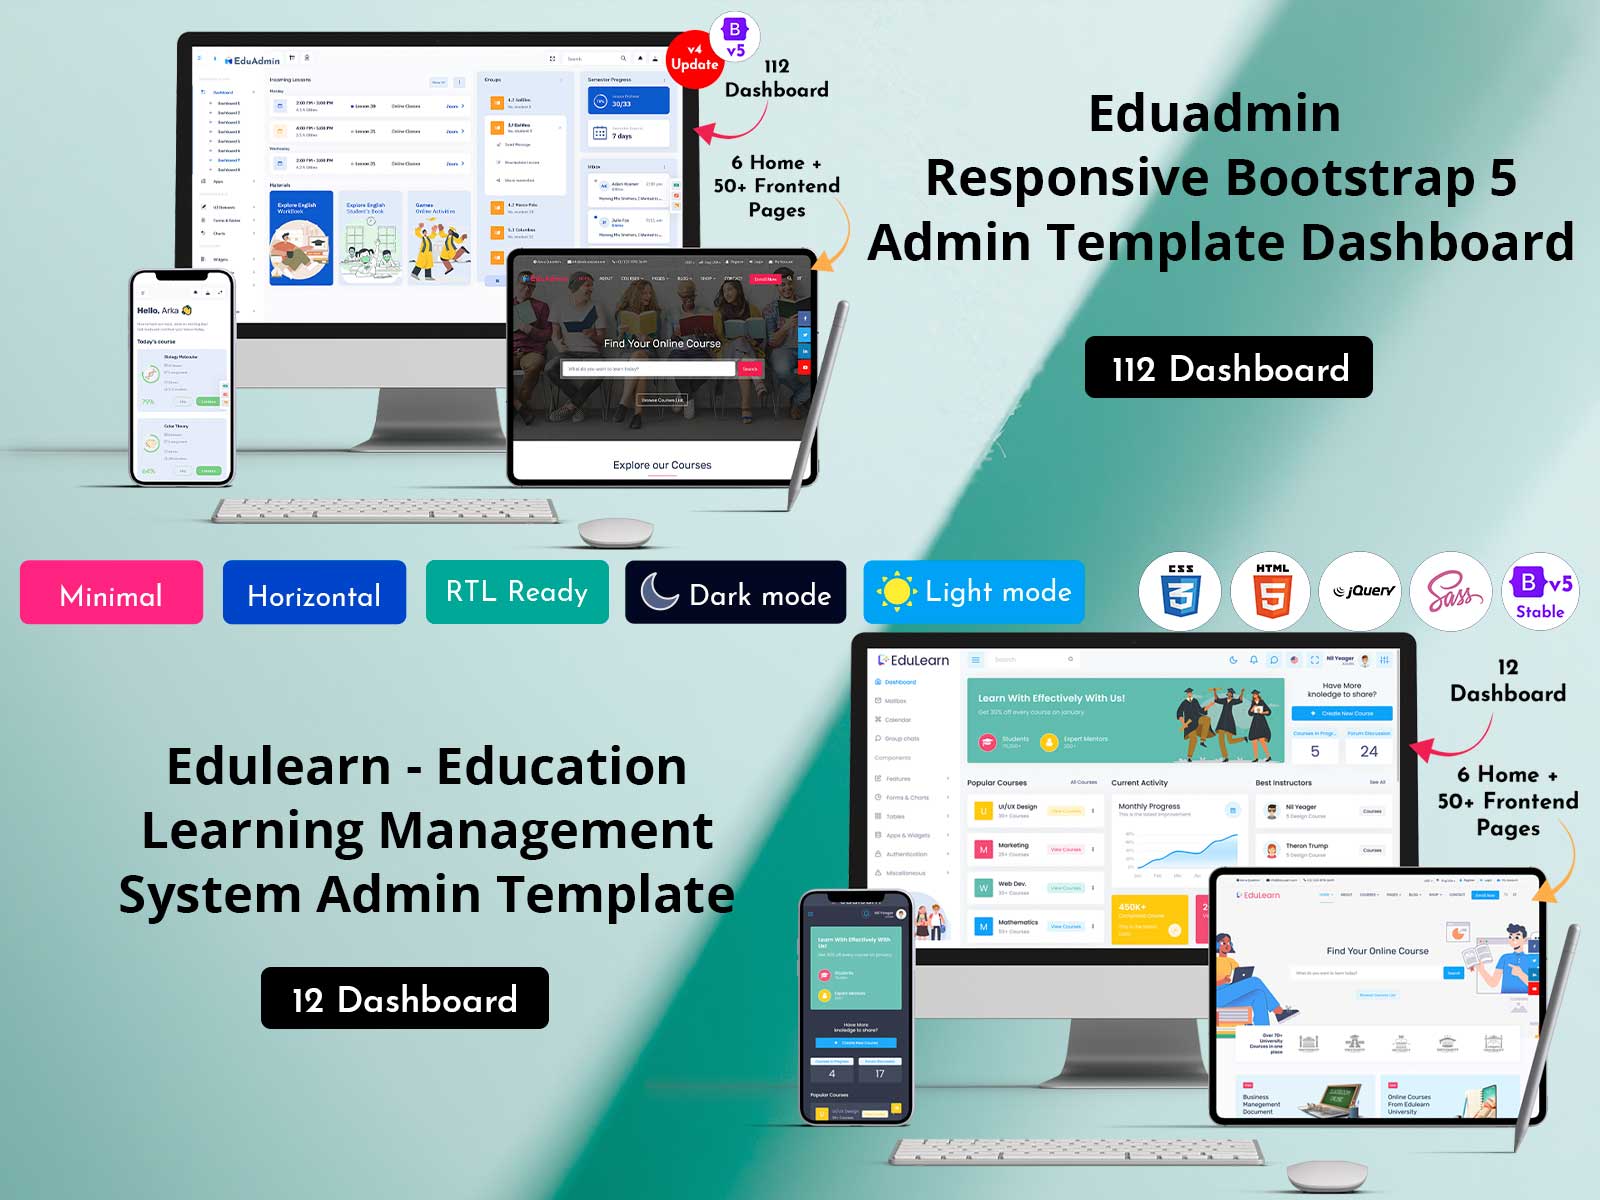
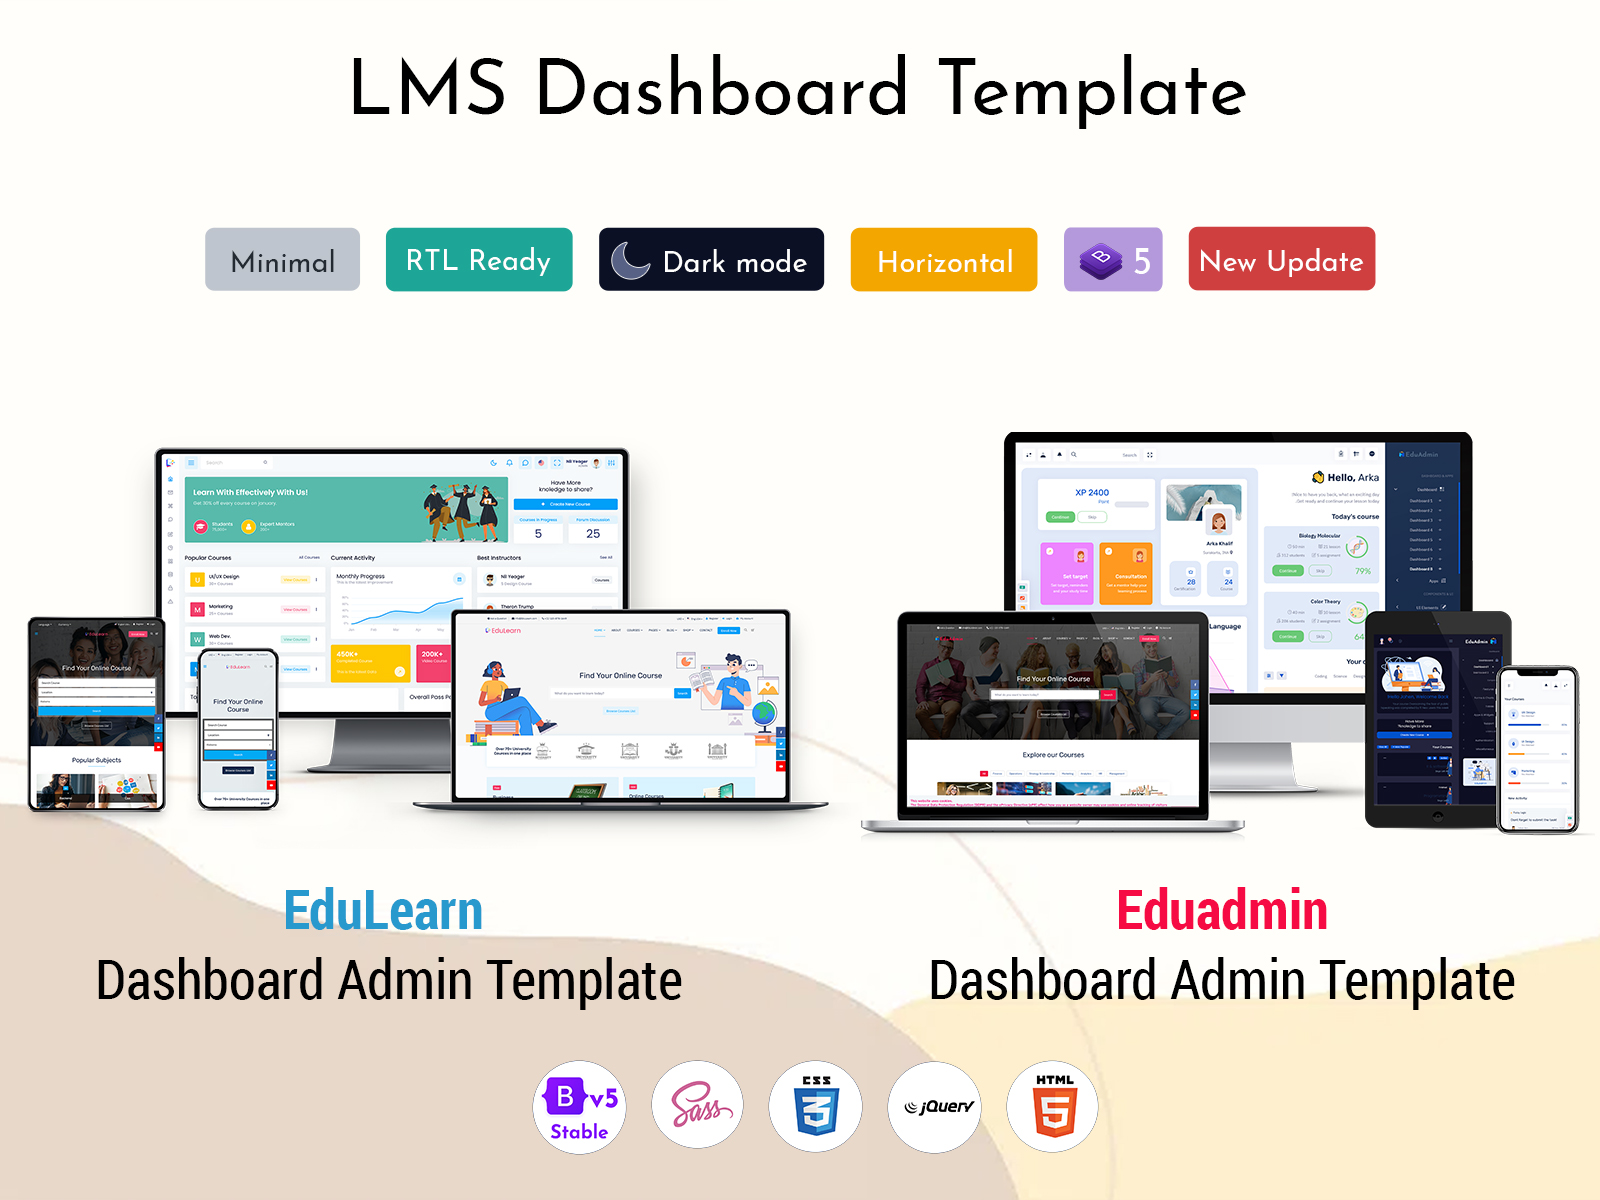
Explore Dashboard Layouts of EduLearn Admin
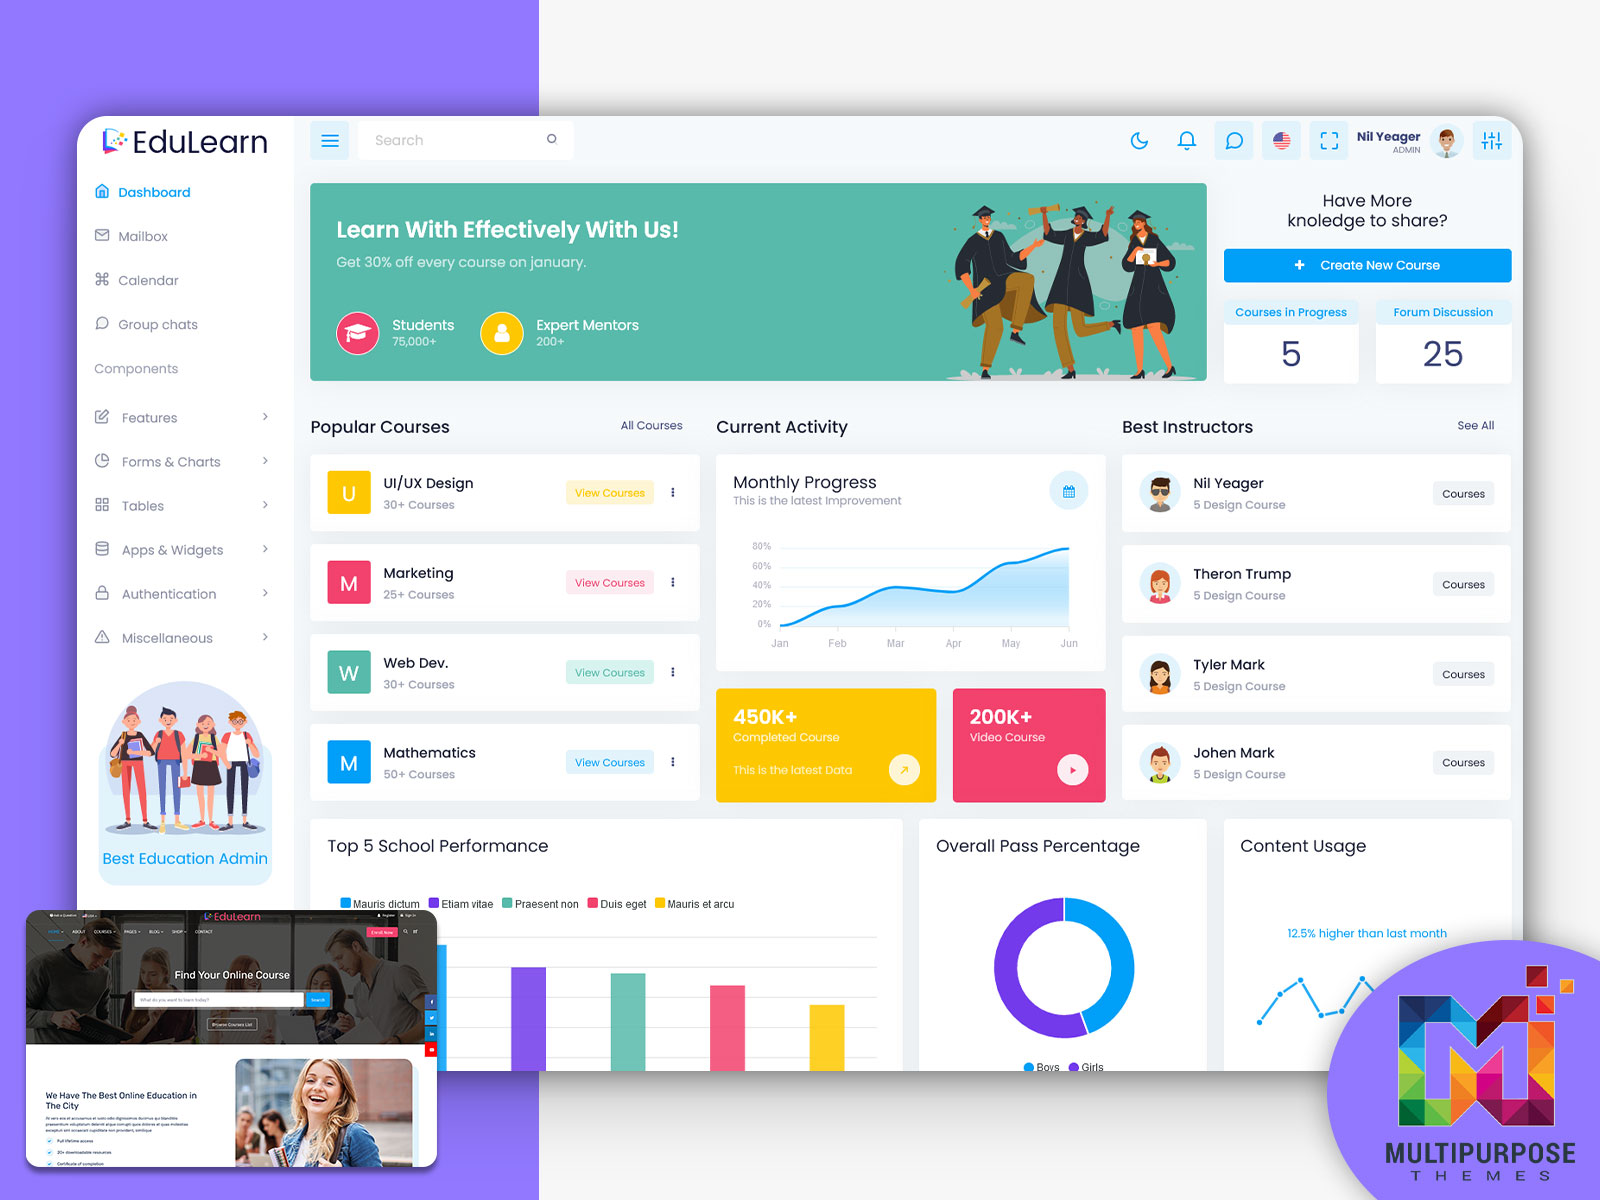
Light Dashboard

MORE INFO / BUY NOW DEMO
Dark Dashboard

MORE INFO / BUY NOW DEMO
The Promise of Data-Driven Education
We live in an increasingly data-rich world. The lowered cost of gathering, storing, and analyzing information over the past decades has fueled a push towards data-driven decision making across nearly every industry, including education. Proponents argue that numerical data should inform policies and teaching practices to enhance effectiveness. Dashboard systems are an important way education leaders put volumes of student data towards constructive ends.
Administrators deal with overwhelming amounts of information from various sources – attendance records, grades, standardized test scores, demographic statistics, and more. But raw data does little good on its own. An LMS admin template organizes metrics into digestible visualizations that spotlight trends, gaps, and relationships that might otherwise go unnoticed in spreadsheets or reports. Stakeholders can use an online course dashboard or learning management system dashboard to turn abstract figures into actionable insights.
Uncover Dashboard Design of EduAdmin
Light Dashboard
MORE INFO / BUY NOW DEMO
Dark Dashboard
MORE INFO / BUY NOW DEMO
Key Features of Education Dashboard
An education dashboards pulls data from diverse back-end sources into a unified interface. While Learning Management System dashboard may look different depending on their audience and use case, most share these traits:
- Customizable visuals – Charts, graphs, gauges, and maps present data effectively. Users can tailor views to focus on the most relevant metrics.
- Dynamic updating – Online course Dashboard connects to real-time data feeds and update automatically as new figures stream in. This keeps information current.
- Alert capabilities – Admins can configure thresholds and alerts for critical performance indicators. Automated notifications enable rapid response when metrics go above or below set levels.
- Access controls – Role-based permissions let schools limit exposure of sensitive student data to authorized eyes only.
Core Metrics in Education Dashboard
The metrics and education dashboard tracks depend largely on the department and position of the intended users. Platforms are highly customizable, but often showcase some combination of the following data points:
For district and school administration:
- Enrollment statistics
- Demographic breakdowns
- Standardized test results
- Dropout and graduation rates
- College admissions and scholarship trends
- Teacher retention and absences
- Classroom utilization rates
- Budget tracking
For teachers:
- Individual student profiles and backgrounds
- Assignment completion rates
- Course grades and grade trends
- Attendance records and absenteeism warning signs
- Student engagement during lectures
- Test/quiz results tied to academic standards/learning objectives
For students and parents:
- Assignment deadlines and calendar notifications
- Grades for current courses
- Test scores and grade trends over time
- Attendance history with absence reasons
- Progress towards graduation requirements
Presenting this kind of data visually through an online course dashboard allows users to spot patterns that identify successes to replicate as well as problem areas requiring intervention.
Use Cases for Education Dashboard
An online course dashboard serves a wide variety of practical applications at the classroom, school, and district levels:
Tracking student performance
Administrators and teachers monitor indicators like assignment completion rates, quiz/test scores, and course failure rates to pinpoint individual students or demographic groups that need extra support. Early warning systems highlight at-risk students so educators can intervene before issues snowball.
Informing instructional strategies
Metrics tied to academic standards and learning objectives give insight into how effective lessons resonate. Educators can use engagement data to determine topics and teaching methods that work well or poorly for their students. These insights allow continual refinement of classroom techniques.
Simplifying school comparisons
District leaders often supervise numerous schools with varied characteristics. LMS Admin Template allows easy analysis of demographic variables, academic achievement, teacher effectiveness ratings, and other factors to characterize school strengths and identify those needing targeted improvements. Visualized data simplifies apples-to-apples comparisons.
Optimizing resource allocation
School budgets balance many competing priorities with limited funding. The bird’s-eye overview dashboards help districts distribute technical infrastructure, staff, and programs cost-efficiently based on documented needs. Metrics reveal current resources failing to remedy persistent issues.
Informing policy decisions
Quantitative data lends credibility when proposing significant policy changes that impact students and faculty. Boards and committees can use Learning Management System dashboard facts and figures to build an evidence-based case for reforms aimed at improving grades, test scores, attendance rates, equity gaps and more.
Enhancing transparency
Public-facing dashboard views allow families and community members to see summary district and school information like demographics, finances, academic ratings, and trends over time. Open data portals foster engagement, accountability, and trust.
Selecting the Right Education Dashboard Platform
With data’s immense potential to amplify education efficiency, numerous technology vendors now offer purpose-built education dashboards solutions for learning organizations. Selecting systems aligned to needs and goals is key to realizing the promised benefits of data-driven practices. When evaluating options, consider these points:
- What metrics matter most based on your role and priorities? Confirm tools provide insightful visualizations into required KPIs.
- Is the interface intuitive and easy to navigate without training? Stakeholders will only adopt tools they can use effortlessly.
- How flexible is the system? Opt for customizable platforms that allow fluid adjustments as needs shift.
- Does the solution integrate securely with your existing data infrastructure? Centralized data fusion simplifies analysis.
- How automated is dashboard population and upkeep? The less manual data wrangling required, the better.
- Does the vendor provide ongoing customer support and system training? Look for partners invested in your success.
Final Words
Gleaning actionable intelligence from the sea of information schools generate today requires the right digital tools. Thoughtfully designed education dashboard spotlight the metrics that matter most, offering decision makers an invaluable compass to chart a course towards data-driven educational excellence.
As education becomes increasingly data-driven, purpose-built dashboards provide the visual intelligence to guide better decisions. By condensing volumes of metrics into clear snapshots, these tools help administrators, teachers, and policy makers leverage data analytics for real gains. Well-implemented education dashboard promotes more informed resource allocation, instruction, and reforms to improve student outcomes. Get hold of the best LMS dashboard template and create that perfect system.
FAQs
1. What exactly is an education dashboard and how can it help our school or institution?
An education dashboard is a data visualization tool that consolidates various academic and administrative metrics into a single, easy-to-read interface. It helps schools, colleges, or districts track performance indicators like attendance, grades, test scores, teacher activity, and more — enabling quicker, data-driven decisions to improve student outcomes and operational efficiency.
2. Can the dashboard be customized based on our school’s specific needs?
Yes, most modern LMS dashboard templates are fully customizable. You can tailor visuals, metrics, alerts, and access controls to suit your roles — whether you’re an administrator, teacher, or part of the IT team. This flexibility ensures the dashboard serves the exact priorities and workflows of your institution.
3. How secure is the student and faculty data on these dashboards?
Top-tier education dashboards come with built-in role-based access controls and secure data integration protocols. This ensures that only authorized personnel can view or interact with sensitive information, maintaining compliance with data privacy regulations like FERPA or local data protection laws.
4. How difficult is it to integrate the dashboard with our current student information systems or LMS?
Most education dashboard platforms are designed to integrate seamlessly with existing systems such as SIS, LMS, or third-party data sources. A good vendor will support integration and ensure smooth data flow without requiring complex IT setups.
5. Will our staff need extensive training to use the dashboard system effectively?
No. A well-designed Learning Management System dashboard or online course dashboard is built for intuitive navigation and ease of use. Still, many providers include onboarding sessions, user guides, and ongoing support to ensure your team can confidently leverage the system from day one.
Click the Button to Explore More Education Dashboards
1. Gilded Admin
BUY NOW DEMO
2. Tresto Admin
BUY NOW DEMO
3. Bsinx Admin
BUY NOW DEMO
Need More Templates? Explore Our Full Collection!
Explore Our Full Collection!
Related Posts


This Post Has 0 Comments