
In today’s fast-moving business world, managing warehouse operations efficiently is very important. A Warehouse Dashboard…
Move into 2026 with a Digital Portal powered by a Warehouse KPI Dashboard
Reading Time: 7 minutes
The logistics and supply chain industry in 2026 is rapidly evolving, driven by automation, artificial intelligence, and real-time analytics. In this data-driven environment, the Warehouse KPI Dashboard has become a critical tool for businesses aiming to maintain efficiency, accuracy, and profitability. A modern warehouse is no longer just a storage facility; it is a dynamic hub where every movement, transaction, and workflow is tracked and optimized through intelligent systems.
A Warehouse Dashboard acts as a centralized digital interface that allows businesses to monitor performance metrics, analyze trends, and make informed decisions. It transforms raw data into actionable insights, helping organizations stay competitive in an increasingly complex logistics landscape. According to industry insights, KPI dashboards provide a real-time snapshot of warehouse performance, enabling managers to respond quickly and effectively to operational challenges.
Watch Full Video
Understanding the Concept of Warehouse KPI Dashboard
A Warehouse KPI Dashboard is a visual representation of key performance indicators that measure warehouse efficiency, productivity, and accuracy. These dashboards collect and display data from multiple sources such as inventory systems, order processing tools, and logistics platforms.
The purpose of a Warehouse Management Dashboard is to provide clarity. Without it, warehouse operations can become fragmented and inefficient. With it, managers gain full visibility into processes such as inventory movement, order fulfillment, and workforce productivity. This visibility allows organizations to shift from reactive problem-solving to proactive decision-making.
The Growing Importance of Warehouse Dashboard in 2026
In 2026, the importance of a Warehouse Dashboard has increased significantly due to rising customer expectations and the growth of e-commerce. Customers now demand faster deliveries, accurate orders, and real-time tracking. To meet these expectations, businesses rely heavily on Warehouse Metrics Dashboard systems.
A well-designed dashboard helps organizations monitor operations continuously and identify inefficiencies before they become major issues. It enables better planning, improved resource allocation, and enhanced service quality. As a result, businesses can achieve higher customer satisfaction and stronger market positioning.
Role of Warehouse Management Dashboard in Operations
The Warehouse Management Dashboard serves as the backbone of warehouse operations. It integrates various systems and processes into a single platform, allowing managers to monitor and control activities efficiently.
This dashboard provides insights into inventory levels, order processing, shipping performance, and workforce efficiency. By analyzing these insights, businesses can optimize their operations and reduce costs. The ability to track real-time data ensures that decisions are based on accurate and up-to-date information.
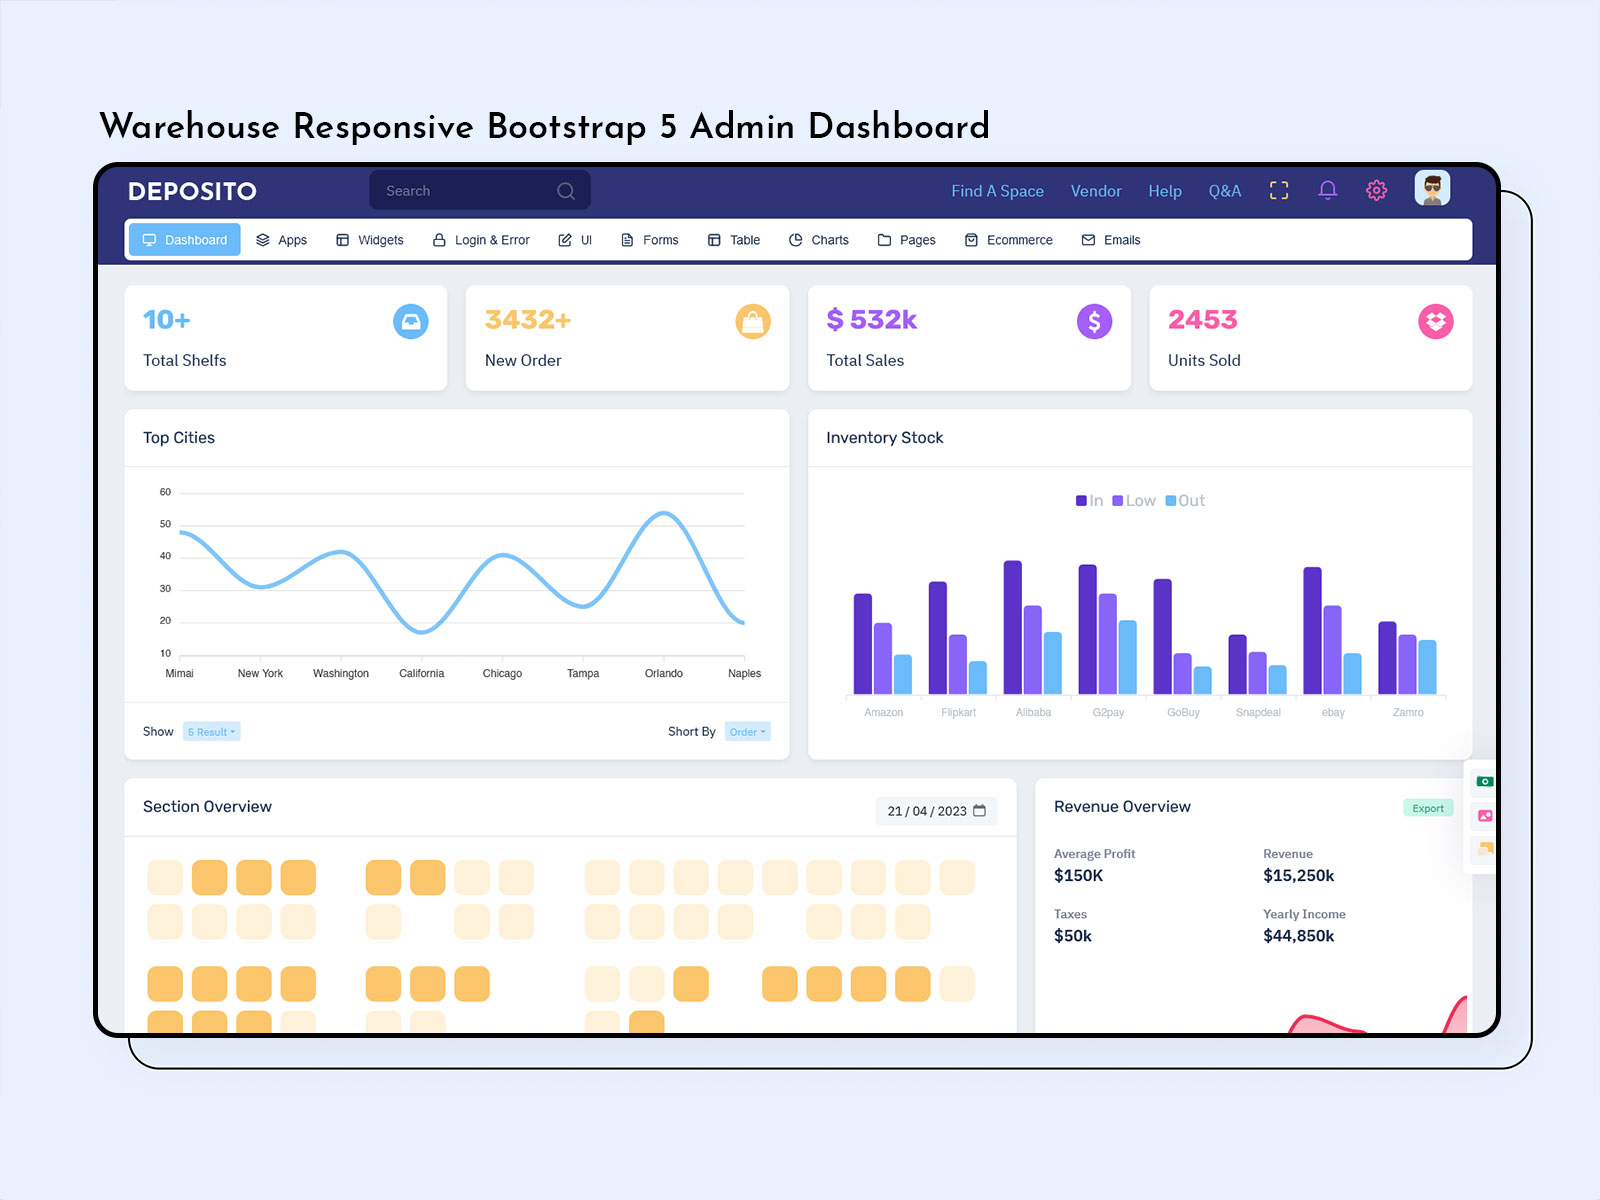
Discover Dashboard Design of Logistic and Warehosue
Dashboard – 1
BUY NOW DEMO
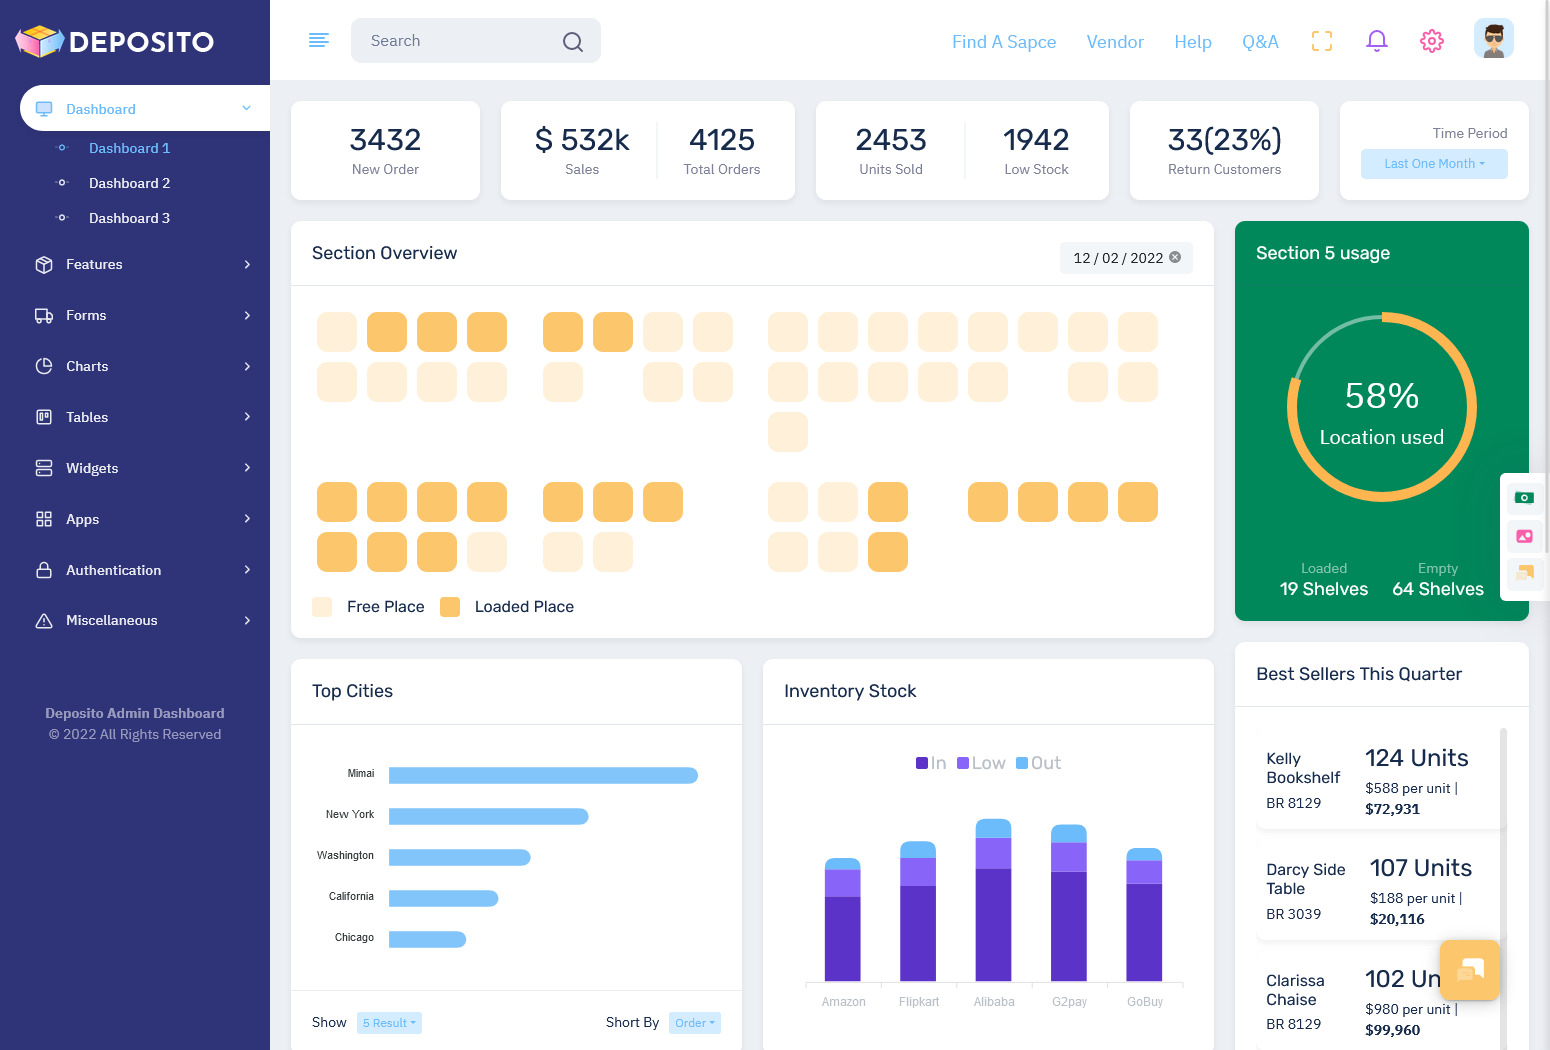
Dashboard – 2
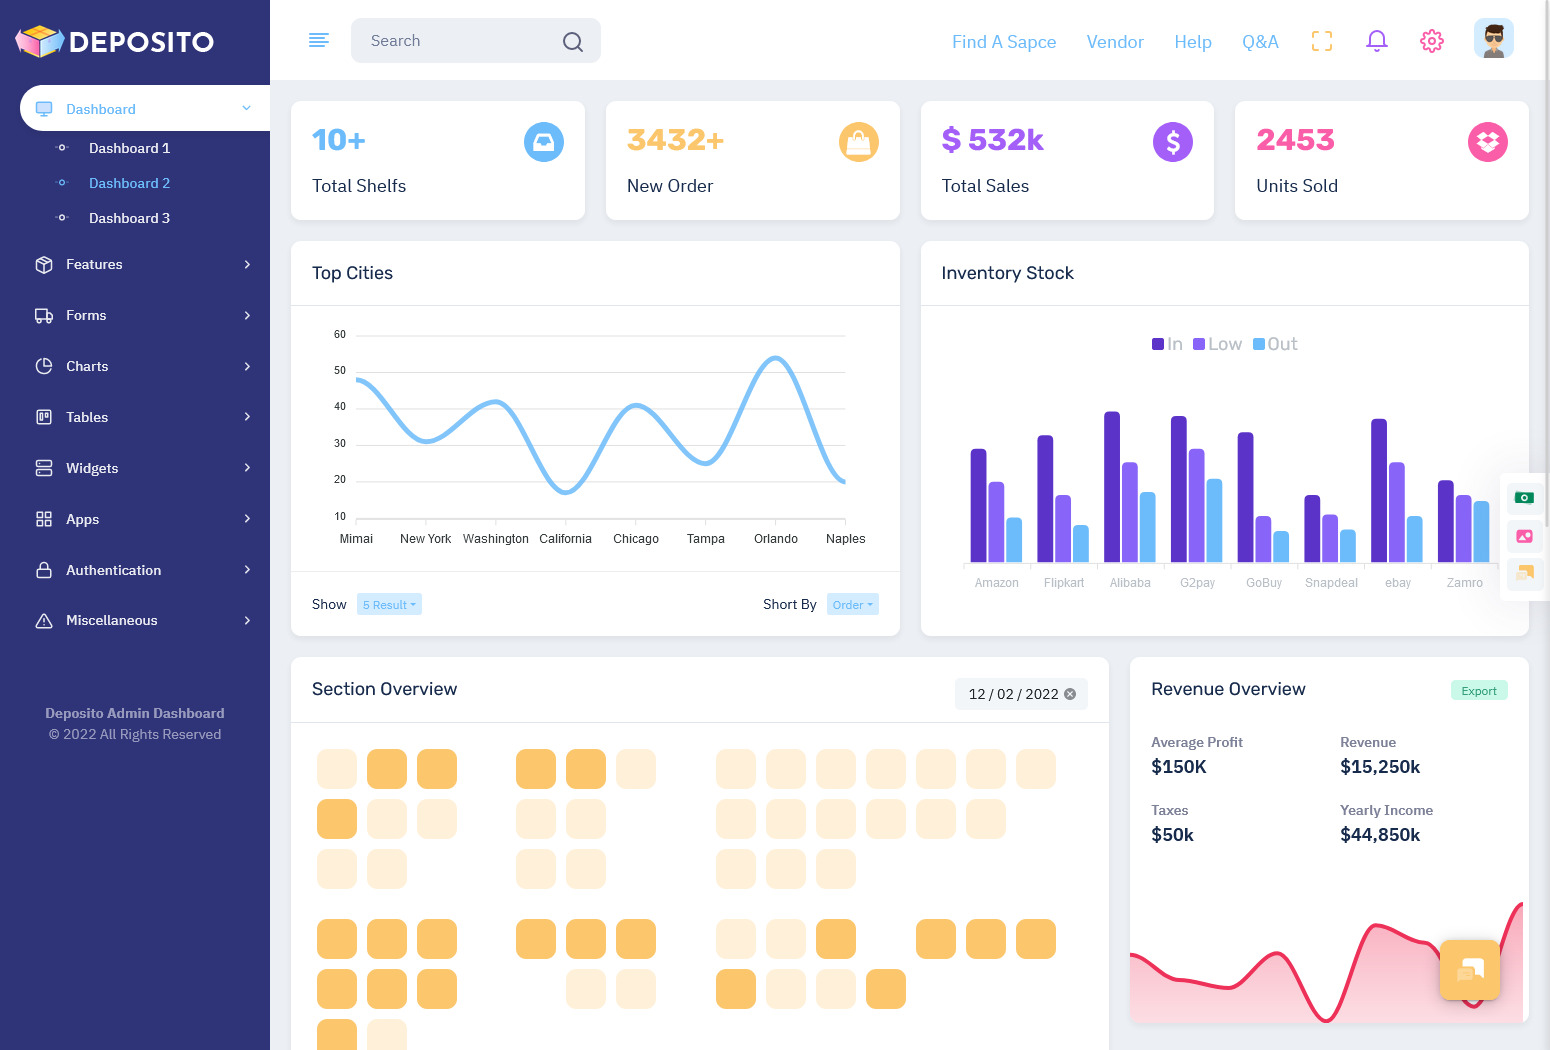
BUY NOW DEMO
Dashboard – 3
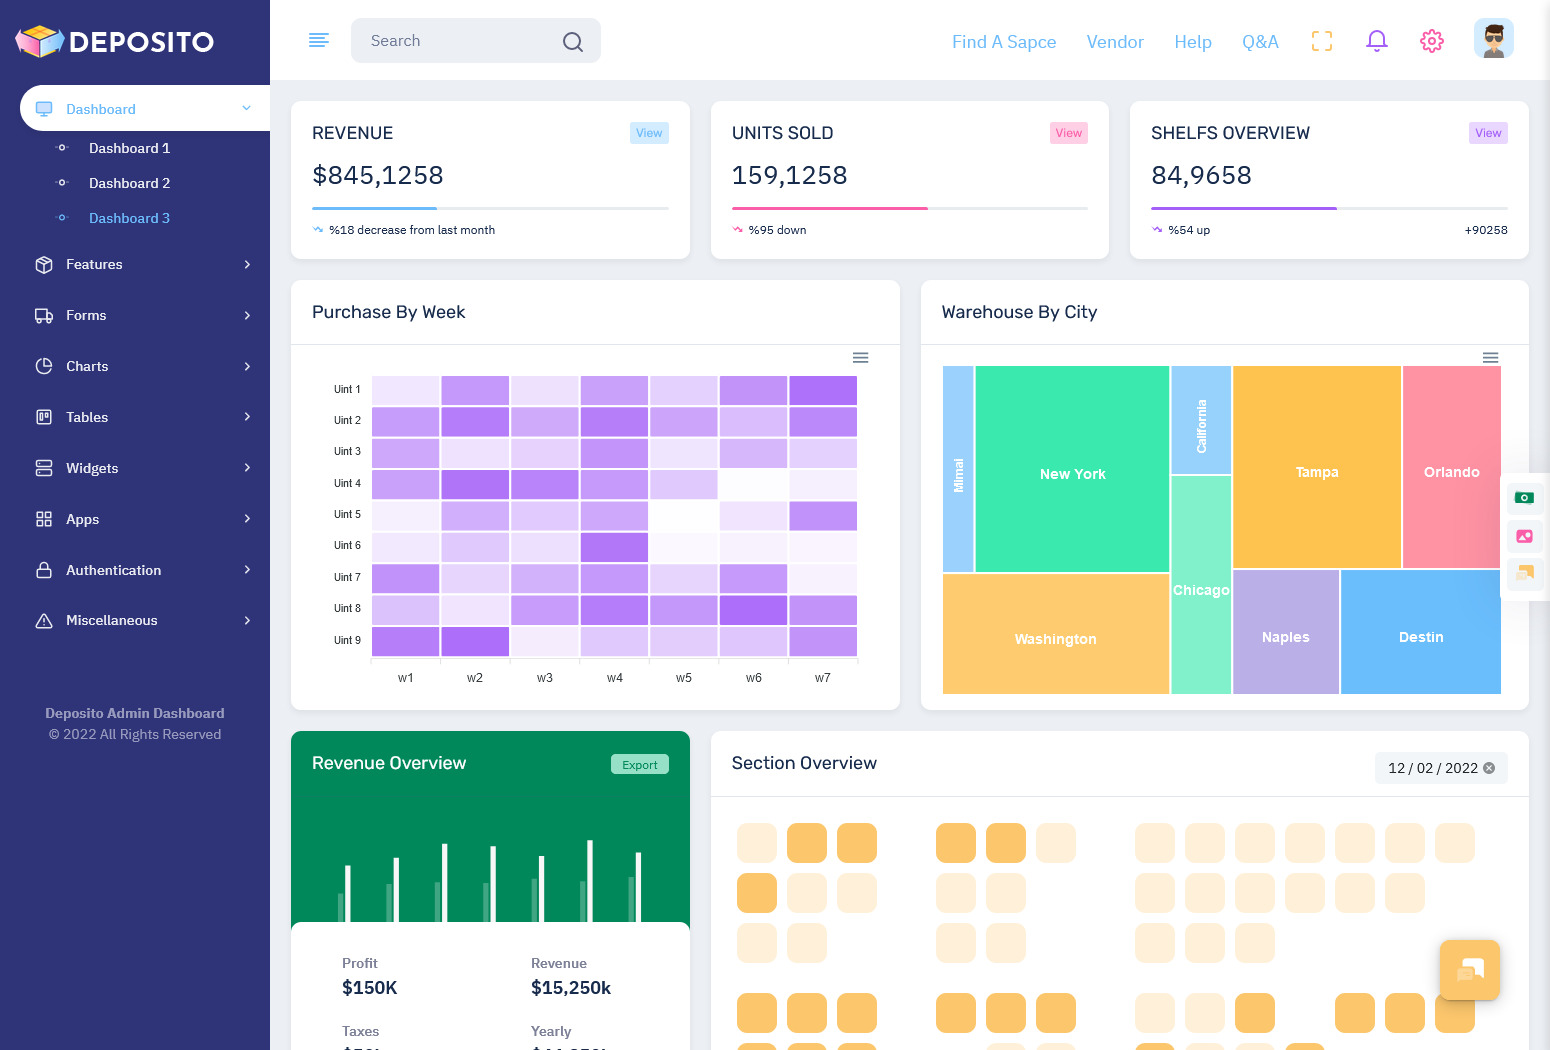
BUY NOW DEMO
Key Features of Warehouse Manager Dashboard
The Warehouse Manager Dashboard is specifically designed for operational leaders who oversee daily warehouse activities. It provides detailed insights into performance metrics and helps managers make informed decisions.
This dashboard includes features such as real-time monitoring, performance tracking, and customizable reports. Managers can quickly identify bottlenecks, track employee productivity, and ensure that operations run smoothly. By leveraging these features, businesses can improve efficiency and maintain consistent performance.
Understanding Warehouse Metrics Dashboard for Data Analysis
A Warehouse Metrics Dashboard focuses on analyzing key performance indicators in detail. It provides a deeper understanding of warehouse operations by highlighting trends, patterns, and areas for improvement.
Metrics such as inventory turnover, order cycle time, and picking accuracy are essential for evaluating performance. These metrics help businesses identify inefficiencies and implement strategies to improve operations. Tracking these indicators allows organizations to maintain a balance between supply and demand while minimizing costs.
Importance of Work Flow Dashboard in Warehouse Efficiency
A Work Flow Dashboard plays a crucial role in managing and optimizing warehouse processes. It tracks each stage of the workflow, from receiving goods to shipping orders.
By visualizing workflows, businesses can identify delays and inefficiencies. This allows them to streamline operations and improve productivity. A well-structured workflow ensures that tasks are completed efficiently and accurately, reducing errors and improving overall performance.
Core KPIs in Warehouse KPI Dashboard
The effectiveness of a Warehouse KPI Dashboard depends on the selection of relevant KPIs. These metrics provide valuable insights into warehouse performance and help businesses achieve their goals.
Inventory accuracy is one of the most critical KPIs, as it ensures that stock records match actual inventory levels. Poor accuracy can lead to stockouts and overstocking, both of which negatively impact operations. Inventory turnover measures how quickly products are sold and replaced, indicating the efficiency of inventory management.
Order cycle time tracks the time taken to process and deliver orders. Reducing this time improves customer satisfaction and operational efficiency. The perfect order rate measures the percentage of error-free deliveries, reflecting the quality of service. Backorder rate indicates how often orders cannot be fulfilled due to insufficient stock, highlighting issues in inventory planning.
Integration of Data Sources in Warehouse Dashboard
A Warehouse Dashboard relies on data from multiple sources to provide a comprehensive view of operations. These sources include warehouse management systems, inventory platforms, order processing systems, and logistics tools.
Integrating these systems ensures that data is accurate and consistent. It allows businesses to analyze operations holistically and make informed decisions. Without proper integration, dashboards may provide incomplete or misleading insights, reducing their effectiveness.
Visualization Techniques in Warehouse KPI Dashboard
Data visualization is a key aspect of any Warehouse KPI Dashboard. It transforms complex data into easy-to-understand visuals, enabling managers to interpret information quickly.
Charts such as bar graphs, line charts, and pie charts are commonly used to represent data. Heat maps and gauge charts provide real-time insights into performance levels. These visualization techniques make it easier to identify trends, detect anomalies, and take corrective actions.
Advantages of Using Warehouse Dashboard
The use of a Warehouse Dashboard offers numerous benefits for businesses. It improves operational efficiency by providing real-time insights into warehouse activities. It enhances decision-making by offering accurate and up-to-date information.
Cost reduction is another significant advantage. By monitoring KPIs such as carrying costs and inventory turnover, businesses can optimize their operations and minimize expenses. Additionally, dashboards improve customer satisfaction by ensuring timely and accurate order fulfillment.
Role of Bootstrap 5 Admin Dashboard in Modern Systems
In 2026, technology plays a vital role in dashboard development. The Bootstrap 5 Admin Dashboard framework is widely used to create responsive and user-friendly dashboards.
This framework provides pre-designed components, flexible layouts, and seamless integration capabilities. It allows developers to build visually appealing dashboards that work efficiently across different devices. By using a Bootstrap-based Admin Template, businesses can reduce development time and enhance user experience.
Importance of Admin Template in Dashboard Development
An Admin Template serves as the foundation for building dashboards. It provides a structured layout and design elements that simplify the development process.
Using a high-quality admin template ensures consistency, scalability, and ease of use. It allows businesses to customize dashboards according to their specific needs while maintaining a professional appearance. In 2026, admin templates are becoming more advanced, offering features such as real-time data integration and interactive visualizations.
Real-World Applications of Warehouse KPI Dashboard
A Warehouse KPI Dashboard is used in various real-world scenarios to improve operations. It helps businesses monitor receiving efficiency by tracking how quickly goods are processed upon arrival. It enhances picking accuracy by ensuring that the correct items are selected during order fulfillment.
Shipping efficiency is another area where dashboards play a crucial role. By analyzing shipping data, businesses can optimize delivery routes and reduce transit times. Workforce productivity can also be improved by tracking employee performance and identifying areas for improvement.
Challenges in Implementing Warehouse KPI Dashboard
Despite its benefits, implementing a Warehouse KPI Dashboard can be challenging. Data integration is one of the primary challenges, as it requires combining information from multiple systems.
Data quality is another concern. Inaccurate or incomplete data can lead to incorrect insights and poor decision-making. Additionally, the initial setup cost and technical expertise required for implementation can be barriers for some businesses. However, advancements in technology are making these challenges easier to overcome.
Future Trends in Warehouse Dashboard for 2026 and Beyond
The future of the Warehouse Dashboard is shaped by emerging technologies such as artificial intelligence, machine learning, and the Internet of Things. These technologies enable predictive analytics, allowing businesses to forecast demand and optimize inventory levels.
Automation is another key trend, with warehouses increasingly relying on automated systems for data collection and analysis. Cloud-based dashboards provide flexibility and accessibility, enabling managers to monitor operations from anywhere. These advancements are transforming warehouse management and setting new standards for efficiency and performance.
Conclusion
The Warehouse KPI Dashboard has become an essential tool for modern warehouse operations in 2026. It provides a comprehensive view of performance metrics, enabling businesses to optimize processes, reduce costs, and improve customer satisfaction.
By leveraging tools such as the Warehouse Management Dashboard, Warehouse Manager Dashboard, Warehouse Metrics Dashboard, and Work Flow Dashboard, organizations can achieve greater efficiency and productivity. The integration of technologies like Bootstrap 5 Admin Dashboard and advanced Admin Template solutions further enhances the capabilities of these systems.
As the logistics industry continues to evolve, the importance of data-driven decision-making will only increase. Businesses that invest in robust Warehouse Dashboard solutions will be better equipped to navigate challenges, seize opportunities, and achieve long-term success.
Frequently Asked Questions (FAQs)
1. What is a Warehouse KPI Dashboard?
A Warehouse KPI Dashboard is a visual tool that displays key performance indicators related to warehouse operations, helping businesses monitor inventory, track performance, and make data-driven decisions efficiently.
2. Why is a Warehouse Management Dashboard important in 2026?
A Warehouse Management Dashboard is important in 2026 because it provides real-time insights, improves operational efficiency, supports faster decision-making, and helps businesses meet increasing customer expectations in logistics.
3. What are the key metrics in a Warehouse Metrics Dashboard?
A Warehouse Metrics Dashboard includes metrics like inventory accuracy, order cycle time, picking accuracy, inventory turnover, and perfect order rate to evaluate performance and optimize warehouse operations effectively.
4. How does a Work Flow Dashboard improve warehouse operations?
A Work Flow Dashboard improves operations by tracking each stage of processes like receiving, picking, packing, and shipping, helping identify bottlenecks and streamline tasks for better productivity and efficiency.
5. What is the role of a Warehouse Manager Dashboard?
A Warehouse Manager Dashboard helps managers monitor daily activities, track employee performance, identify inefficiencies, and ensure smooth operations by providing real-time data and actionable insights.
6. How does a Bootstrap 5 Admin Dashboard help in building Warehouse Dashboards?
A Bootstrap 5 Admin Dashboard provides responsive design, customizable UI components, and faster development, allowing businesses to create scalable, user-friendly, and visually appealing warehouse dashboards using modern admin templates.
Related Posts


This Post Has 0 Comments