
Managing a warehouse today is no longer just about storing goods. It is about speed,…

Warehouse Dashboard for Inventory & KPI Management
Reading Time: 2 minutes
At the top of this blog, you can watch a complete Warehouse Dashboard demo video. The video gives a clear view of how the dashboard works, how warehouse data is displayed, and how key metrics are tracked in real time. Watching the video first helps users quickly understand the dashboard before reading the detailed explanation below.
This video-first approach improves engagement and helps users make faster decisions.
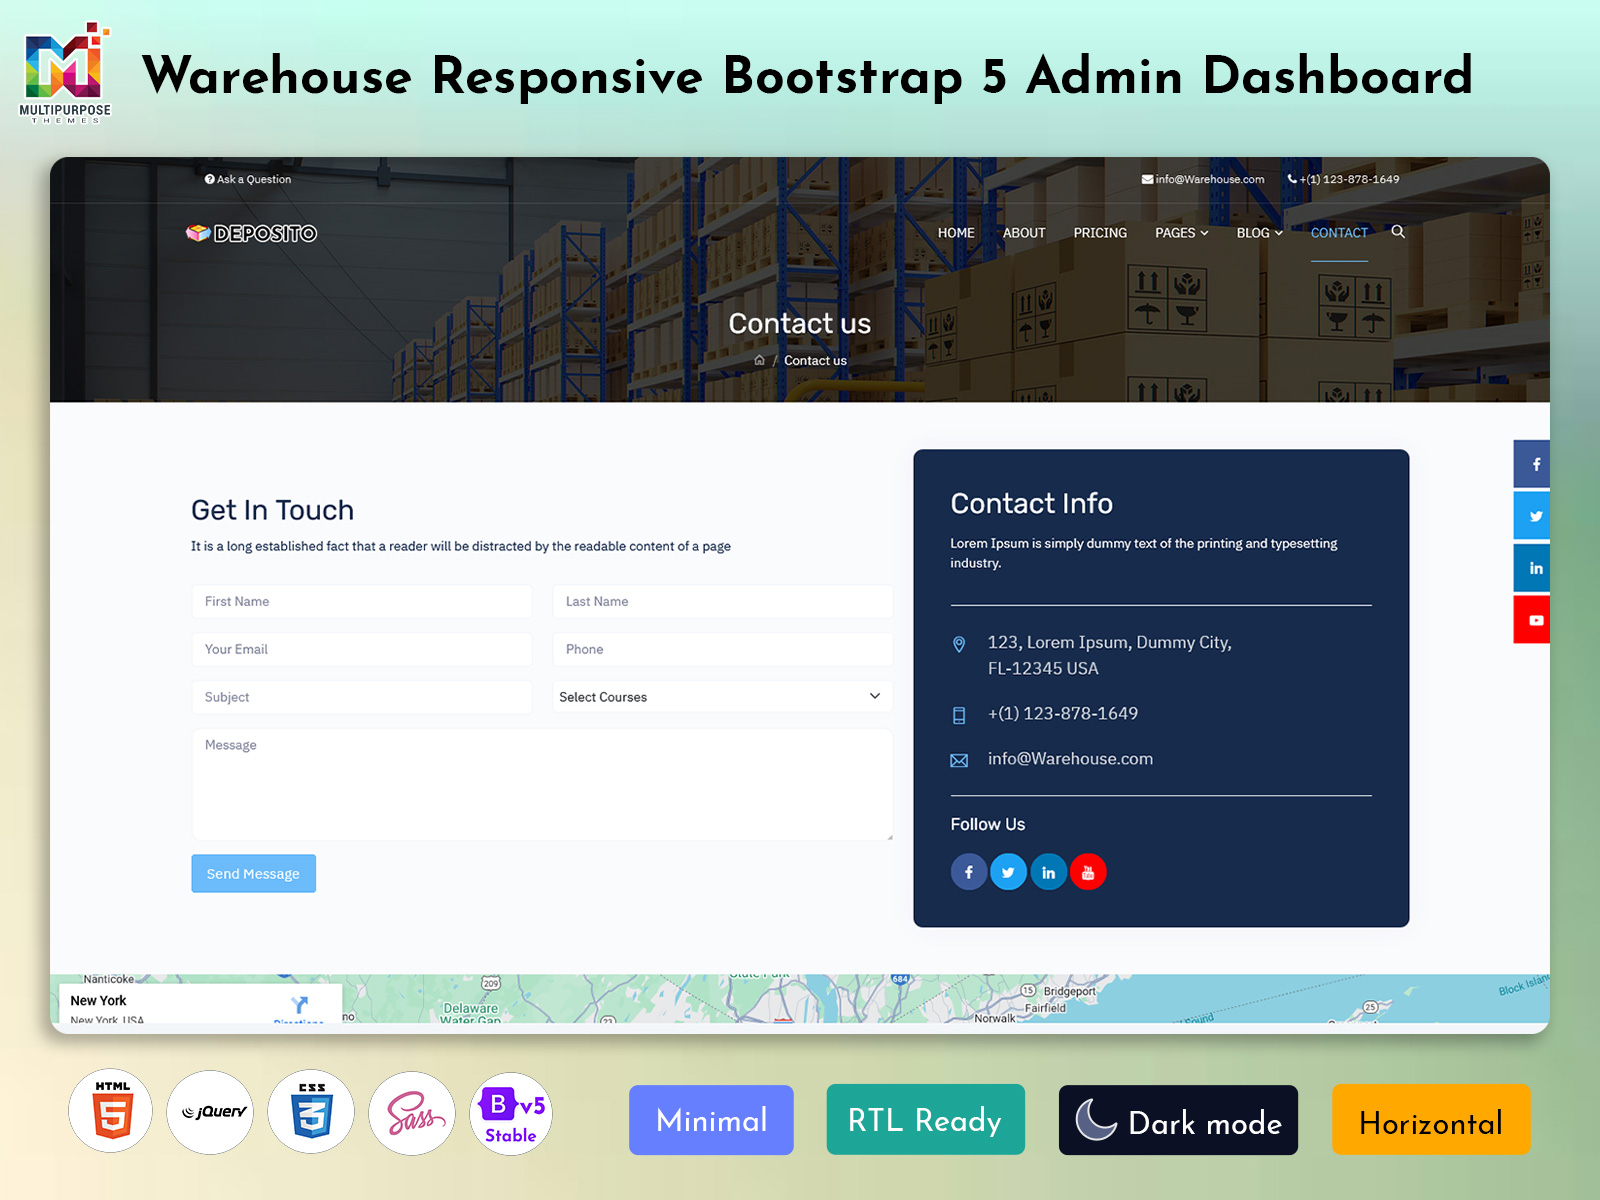
What Is a Warehouse Dashboard?
A Bootstrap 5 Dashboard is an admin panel designed to manage and monitor warehouse operations from a single screen. It provides real-time visibility into inventory levels, inbound and outbound stock, orders, and warehouse performance.
This dashboard often works as a Warehouse KPI Dashboard, where important warehouse KPIs such as stock turnover, order accuracy, picking speed, and fulfillment time are clearly displayed. It helps businesses reduce errors, save time, and improve operational efficiency.
The dashboard is usually built using modern technologies like HTML, CSS, JavaScript, Bootstrap, React, or Power BI, depending on business needs. Its main purpose is to turn complex warehouse data into simple visual insights.
Watch Full Video
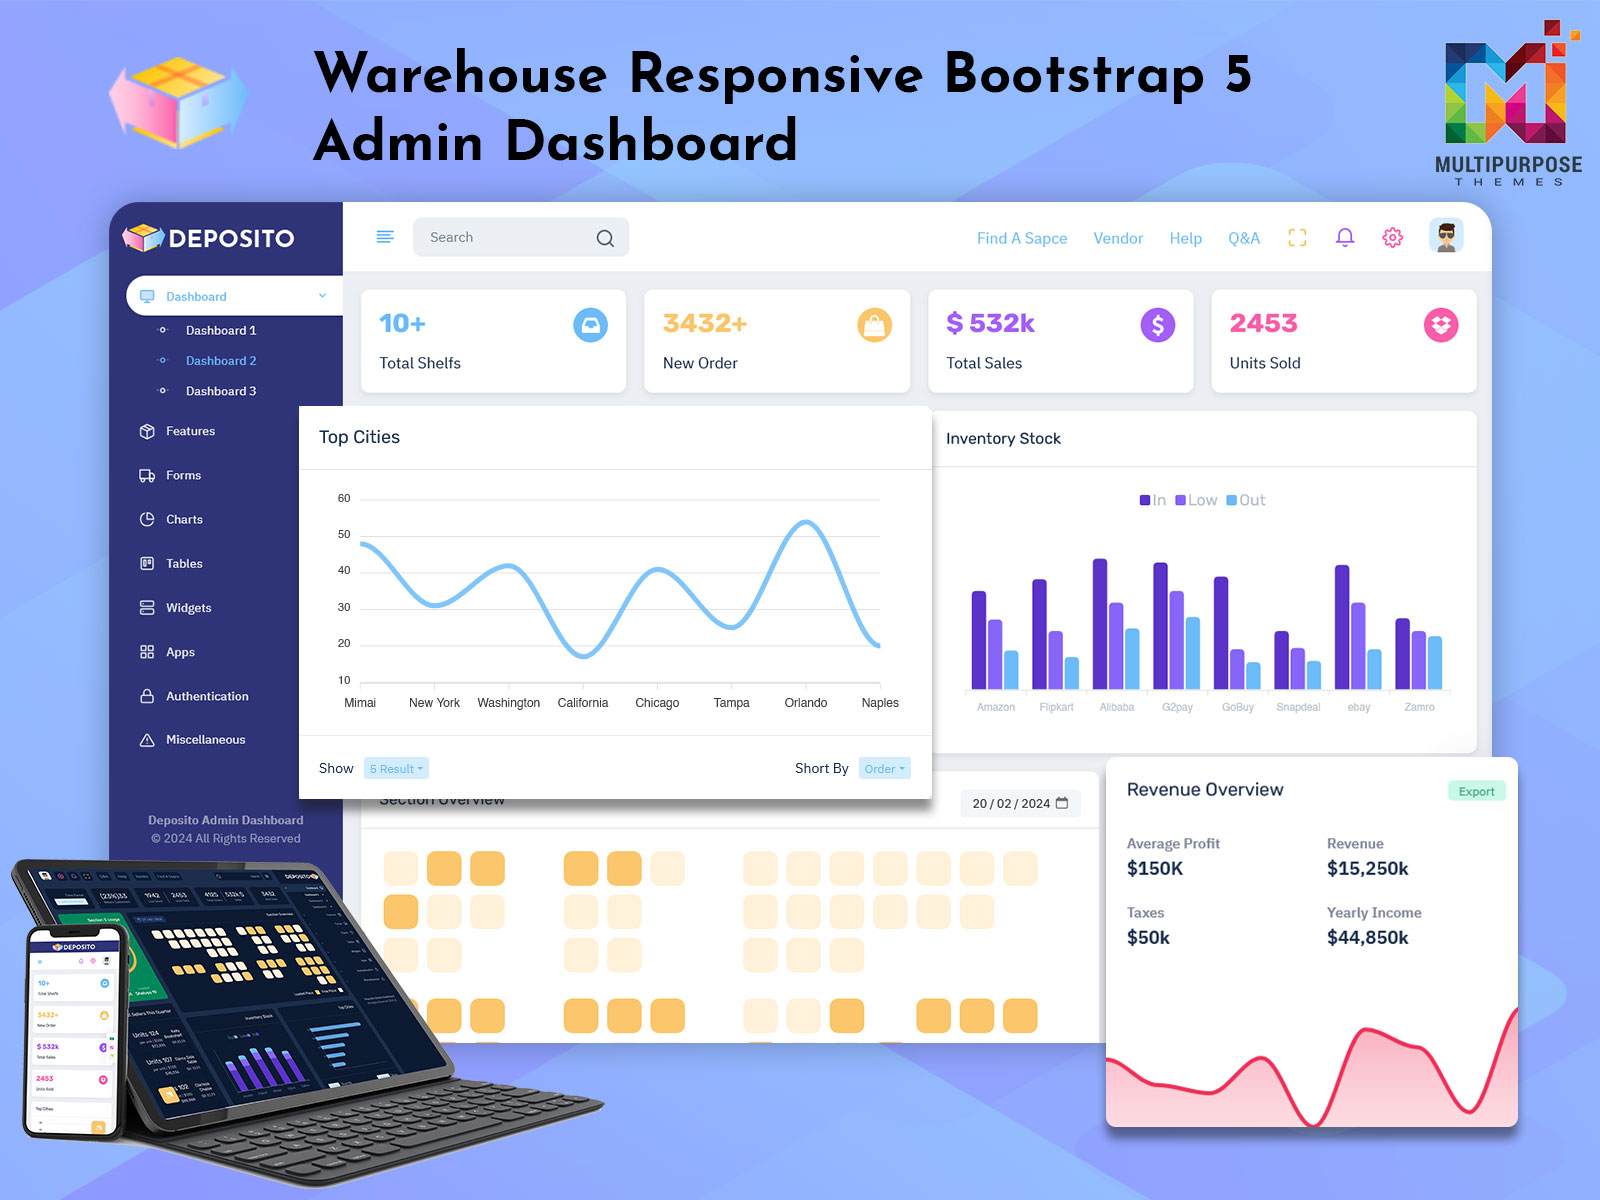
Key Features of Warehouse Dashboard
Inventory Dashboard – Track stock levels, low inventory alerts, and product availability
Warehouse KPI Dashboard – Monitor performance metrics like order fulfillment rate and stock movement
Real-Time Data Updates – Live visibility into warehouse activities
Order Management Panels – View pending, completed, and delayed orders
Charts & Graphs – Visual representation of warehouse KPIs
Responsive Design – Works smoothly on desktop, tablet, and mobile devices
Custom Filters & Reports – Analyze data by date, product, or location
Clean & User-Friendly UI – Easy to understand for warehouse teams
These features help warehouse managers make better and faster decisions.
Use Cases of Warehouse Dashboard
A Admin Dashboard is useful across multiple industries and business models:
E-commerce Businesses – Manage inventory and order fulfillment efficiently
Logistics & Supply Chain Companies – Track warehouse KPIs and stock movement
Manufacturing Units – Monitor raw material and finished goods inventory
Retail Chains – Control inventory across multiple warehouses
SaaS Products – Offer warehouse analytics as part of admin panels
Enterprise Operations – Centralize warehouse data for better planning
Using a KPI Dashboard helps identify bottlenecks and optimize warehouse performance.
Who Should Use This Dashboard?
This KPI Dashboard is ideal for:
Warehouse Managers handling daily operations
Business Owners tracking inventory and performance
Developers building inventory or warehouse systems
Startups working on logistics or supply chain products
Agencies & Freelancers creating admin dashboards for clients
Product Owners needing data-driven warehouse insights
If your business depends on inventory and storage operations, this dashboard is a perfect solution.
Why Video-First Content Works for Warehouse Dashboards
A video demo shows real data flow, charts, and KPIs much better than text alone. Users can instantly understand how the Inventory Dashboard and KPI Dashboard function in real scenarios.
This approach helps with:
Better SEO performance
Higher user engagement
Increased YouTube watch time
More trust and conversions
Call to Action (CTA)
Watch the full Warehouse Dashboard demo and subscribe to our YouTube channel for more KPI Dashboard and admin template videos.
Related Posts


This Post Has 0 Comments