
In today’s digital world, every business depends on powerful web applications to manage operations, users,…

The Role of AI and Automation in CRM Dashboard
Reading Time: 6 minutes
In today’s fast-paced digital world, businesses are increasingly relying on data to make decisions and optimize operations. Whether it’s tracking sales, monitoring customer interactions, or understanding trends, dashboards play a crucial role in simplifying and streamlining these complex processes. Among the various types of dashboards, the CRM Dashboard stands out as a powerful tool that consolidates information from various departments into a single, user-friendly interface.
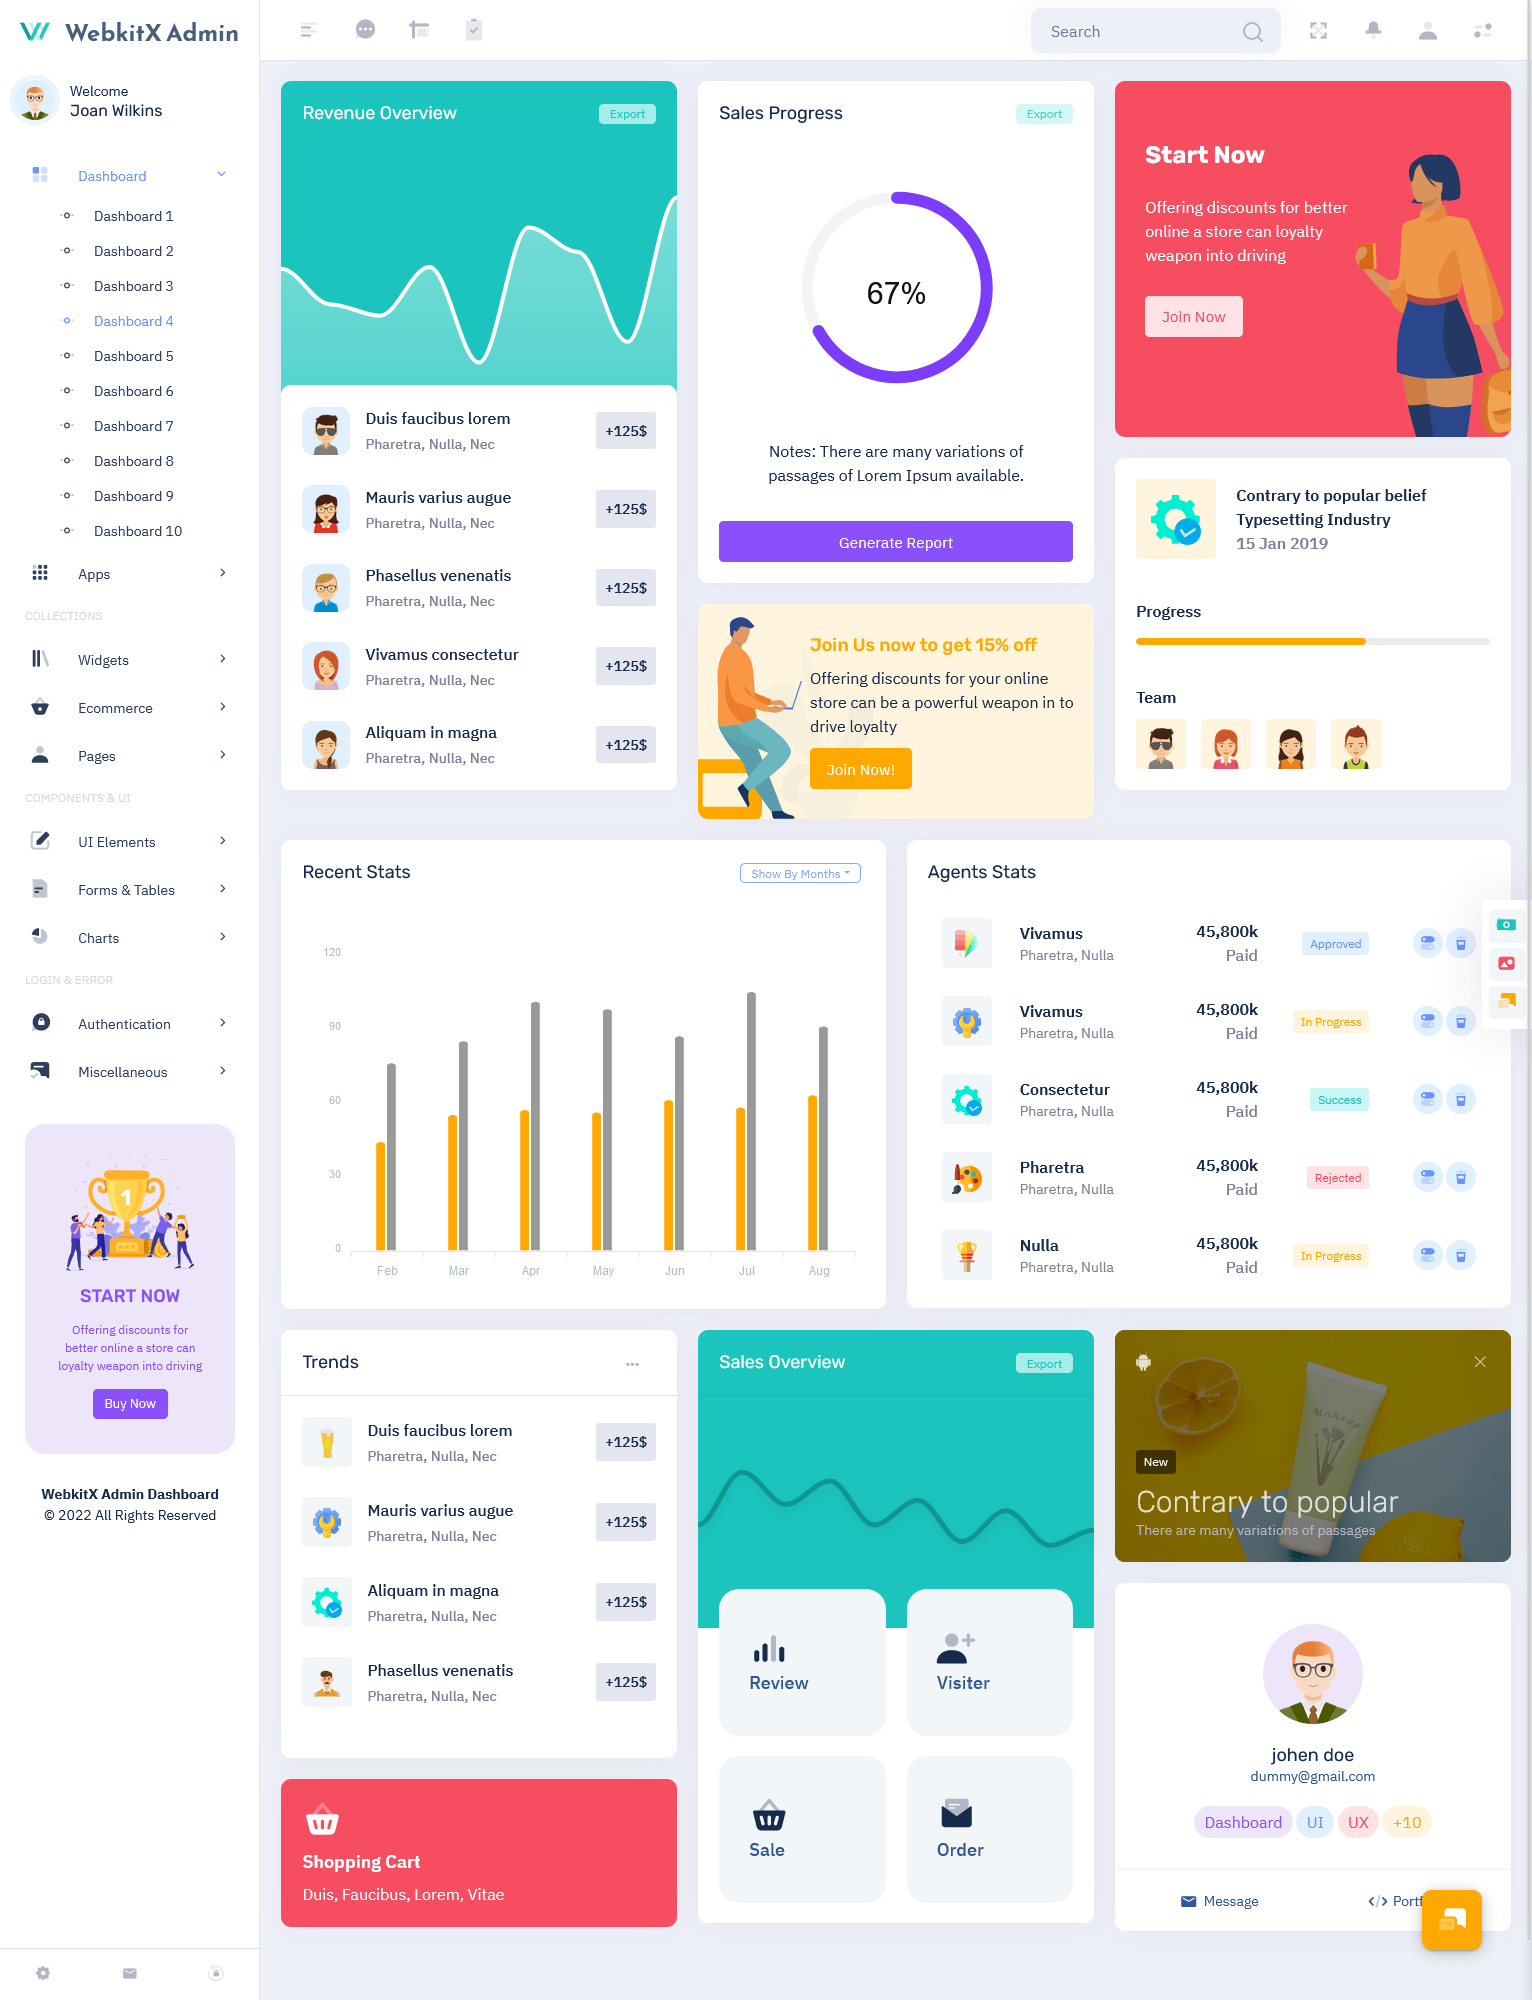
CRM Dashboards of WebkitX Admin
Dashboard – 1

MORE INFO / BUY NOW DEMO
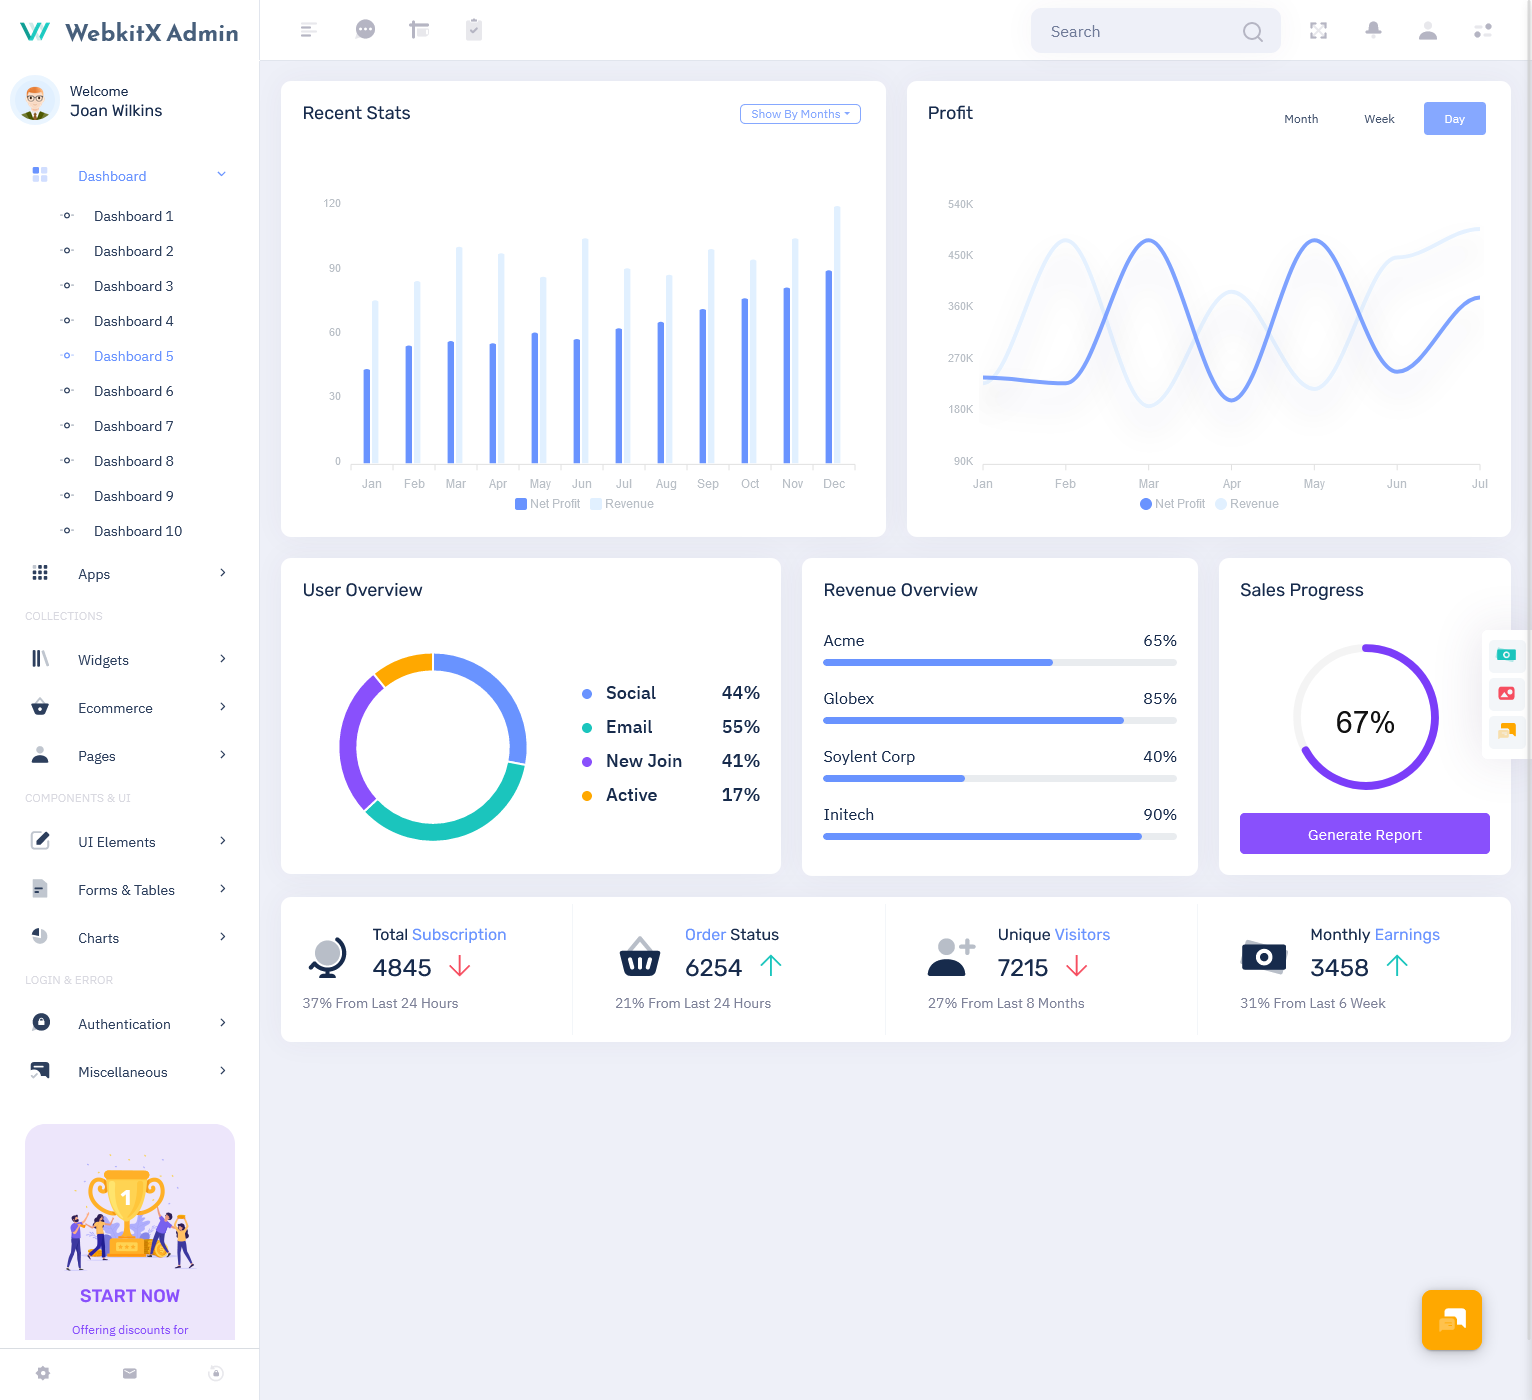
Dashboard – 2

MORE INFO / BUY NOW DEMO
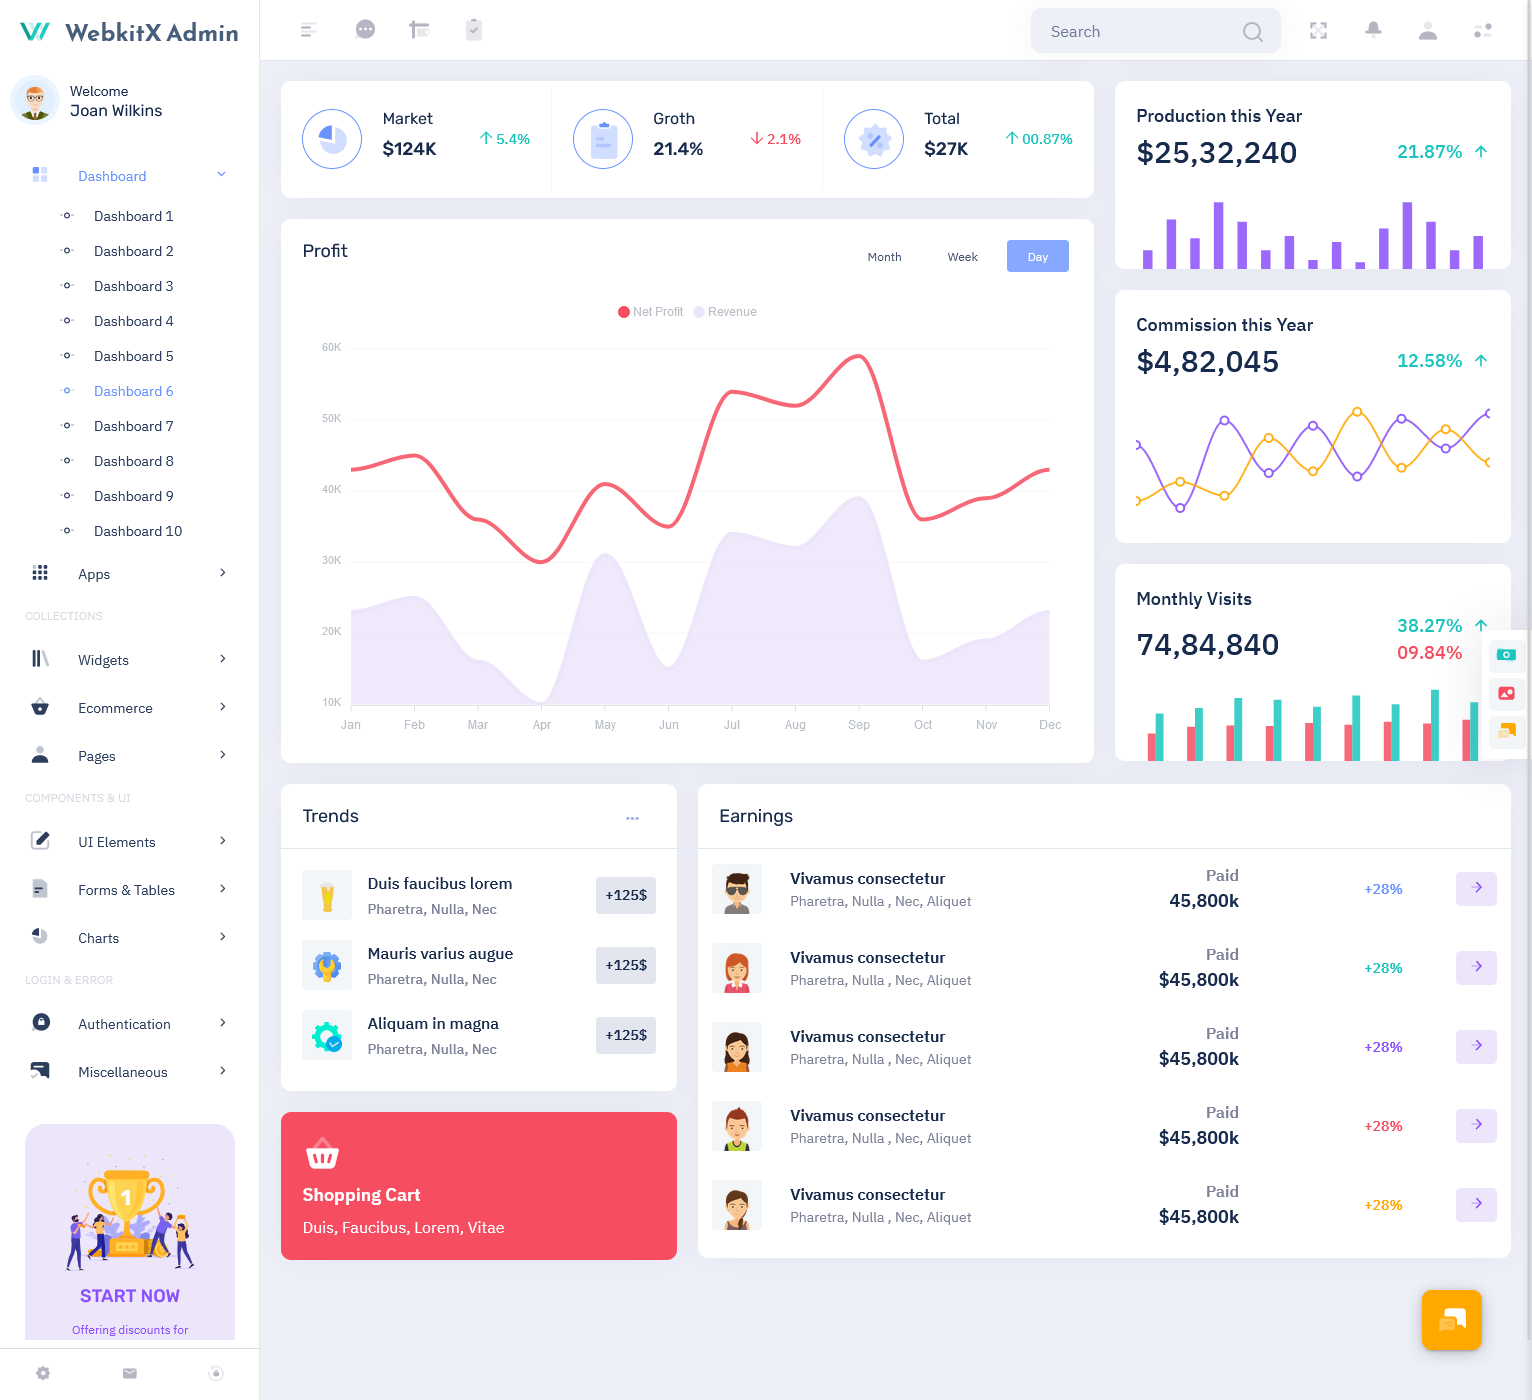
Dashboard – 3

MORE INFO / BUY NOW DEMO
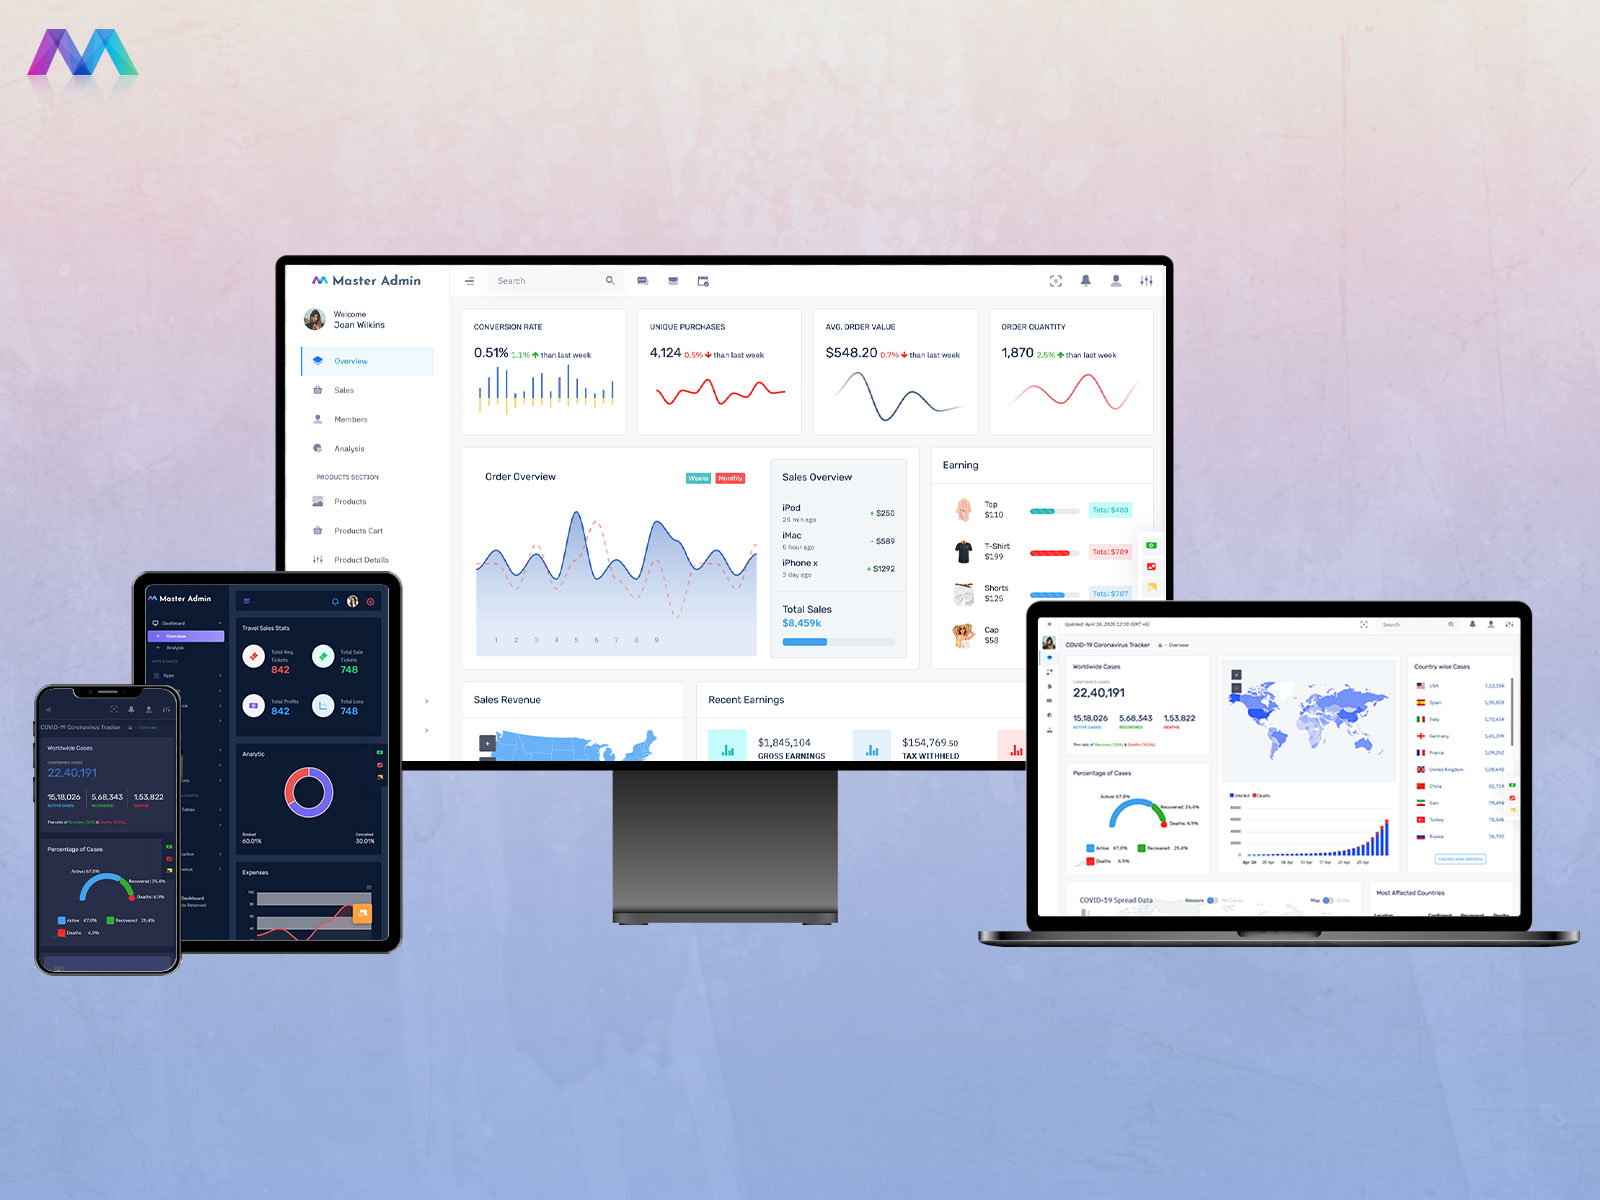
Introduction: Why the Master Dashboard UI is Important
A Master Dashboard UI is designed to provide an overview of different metrics and performance indicators from various sources. It can be used by businesses in any industry, whether in sales, healthcare, education, or energy. The key advantage of a Master Dashboard UI is that it brings together diverse data streams into one central place, making it easier for users to track and analyze information without having to navigate through multiple platforms.
With the integration of Artificial Intelligence (AI) and automation, these dashboards have evolved to be more than just data visualization tools. They are now intelligent systems that can identify patterns, predict trends, and automate tasks that were once time-consuming. In this article, we will explore the role of AI and automation in the Master Dashboard UI and how they can transform business operations across industries.
Sales & Analytics Dashboard
Dashboard – 1

MORE INFO / BUY NOW DEMO
Dashboard – 2

MORE INFO / BUY NOW DEMO
Dashboard – 3

MORE INFO / BUY NOW DEMO
Dashboard – 4
MORE INFO / BUY NOW DEMO
Dashboard – 5
MORE INFO / BUY NOW DEMO
Dashboard – 6
MORE INFO / BUY NOW DEMO
Benefits of Products/Theme of CRM Dashboard
A Master Dashboard UI offers a wide range of benefits that can help businesses stay on top of their operations. Here are some of the main advantages of using a Dashboard UI:
1. Centralized Information
One of the primary benefits of a Master Dashboard UI is that it consolidates data from various departments or systems into a single view. Whether it’s sales data, marketing metrics, or customer service performance, everything can be accessed in one place. This saves time and reduces the need to toggle between multiple software applications.
2. Real-time Data
A UI Dashboard can provide real-time data updates, allowing businesses to monitor their performance continuously. This is especially important for fast-paced industries where timely decision-making can make a significant difference.
3. Data Visualization
Dashboard Templates present data in a visually appealing way, using charts, graphs, and other data visualization tools. This makes it easier for business leaders and employees to understand complex information at a glance and make informed decisions quickly.
4. Customization
Depending on the user’s role or department, the Admin Dashboard UI can be customized to show the most relevant metrics and data. This personalization ensures that each user sees the information they need to perform their tasks efficiently.
5. Increased Productivity
By automating repetitive tasks and presenting data in an organized manner, the CRM Dashboard helps increase productivity. Employees can focus on decision-making and strategic tasks rather than spending time on manual data entry or analysis.
UI Dashboard Features for Sales, Revenue, and More
The Master Dashboard UI is not just for monitoring basic data; it offers detailed insights into key business areas. Let’s take a look at some of the common metrics and data points businesses track in their dashboards.
1. Sales Overview:
A sales overview is one of the most commonly monitored metrics on a dashboard. This includes data on total sales, sales by region, and sales trends over time. It helps sales teams track progress and ensure they are meeting targets.
2. Online Users:
For e-commerce businesses or websites, tracking online user activity is critical. A dashboard can show the number of active users, their engagement levels, and even their location. This information can help businesses understand customer behavior and tailor marketing strategies accordingly.
3. Monthly Orders:
Tracking orders is essential for businesses that rely on online sales. The dashboard can show the number of orders placed in a given month, helping businesses monitor their sales performance and identify any fluctuations.
4. Revenue:
Revenue is the lifeblood of any business, and a CRM Dashboard provides a real-time view of income generated over time. It can also break down revenue by product, region, or sales channel, offering deeper insights into performance.
5. Sales
Report by Country: For global businesses, it’s essential to track sales by region or country. The dashboard can provide detailed sales reports by location, helping businesses identify strong markets and areas where more focus is needed.
6. Sales by Category:
Another important aspect of sales analysis is tracking performance by product category. This allows businesses to understand which product lines are performing well and which may require additional marketing efforts.
The Role of AI and Automation in CRM Dashboards
Artificial Intelligence (AI) and automation are transforming how businesses use dashboards, especially in the context of Customer Relationship Management (CRM). AI-powered Bootstrap Admin Template now provides predictive analytics, automating routine tasks, and offering real-time insights for improving customer relationships and sales.
1. Identifying Trends:
AI can analyze historical data to identify patterns and trends that humans may overlook. For example, AI can spot seasonal changes in customer behavior, helping businesses forecast demand more accurately.
2. Predicting Customer Behavior:
AI can predict future customer actions based on past interactions. For instance, it can predict which leads are most likely to convert into paying customers, enabling sales teams to prioritize their efforts on high-potential prospects.
3. Automating Follow-ups:
Automation can streamline follow-up tasks. For instance, AI-powered CRM Dashboard can automatically send emails or notifications to customers after a purchase, schedule reminders for sales reps to follow up with leads, or even trigger alerts for customer support teams when issues arise.
4. Improved Efficiency:
AI and automation work together to reduce the time spent on manual tasks. By automating routine data analysis, sending follow-ups, and handling notifications, businesses can focus on high-level decision-making and strategy.
5. Personalized Customer Interactions:
AI helps businesses deliver a more personalized experience by analyzing customer data and tailoring communication based on preferences, previous purchases, or behaviors. This helps build strong customer relationships and drive loyalty.
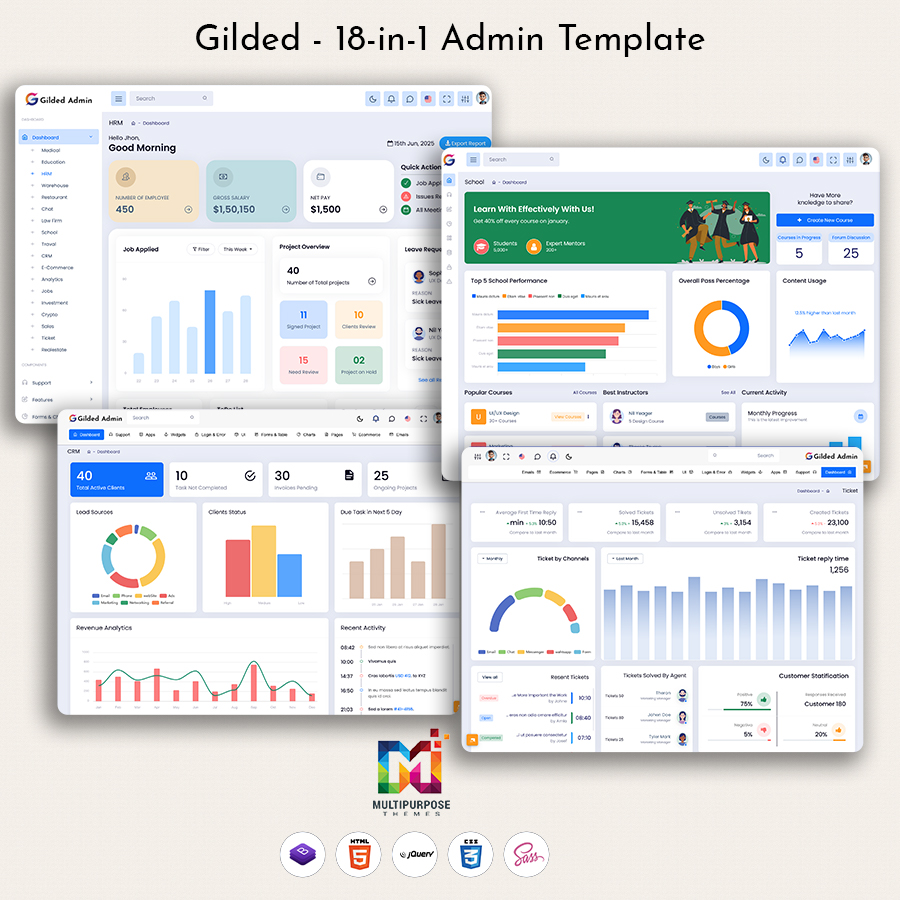
Expanding the Reach of the Master Dashboard UI
The Master Dashboard UI is not limited to just sales or marketing; it can integrate data from various departments, providing a comprehensive view of business operations. Here are some examples of specialized dashboards that can be incorporated into a Master Dashboard UI:
1. Medical Dashboard:
Healthcare organizations can integrate patient data, treatment progress, and staff performance into their dashboard, providing a holistic view of hospital operations.
2. Education Dashboard:
Educational institutions can track student performance, attendance, grades, and faculty effectiveness, all in one place.
3. HRM Dashboard:
HR departments can use the Master Dashboard UI to monitor employee performance, track recruitment efforts, and manage payroll and benefits information.
4. ETicketing Dashboard:
Event organizers can monitor ticket sales, attendance, and customer feedback through an integrated ticketing system dashboard.
5. EV Dashboard:
Electric vehicle (EV) companies can monitor the status of charging stations, vehicle usage, and energy consumption across their network.
6. Solar Admin Dashboard:
For renewable energy businesses, the Solar Dashboard can track solar panel performance, energy production, and maintenance schedules.
7. Warehouse Dashboard:
In logistics and supply chain management, the Master Dashboard UI can help monitor warehouse operations, inventory levels, and order fulfillment.
Why We Are Better
At our company, we believe in the power of customization and flexibility. Unlike many off-the-shelf dashboard solutions, our Bootstrap 5 CRM Dashboard Template is designed to fit your unique business needs. Whether you are in healthcare, education, sales, or logistics, we tailor the Admin Templates to collect, display, and analyze the data that matters most to you.
Conclusion
The integration of AI and automation in the Master Dashboard UI is changing the way businesses operate. From tracking sales and customer behavior to automating follow-up tasks and predicting trends, AI-powered dashboards are helping companies make data-driven decisions more efficiently. Whether you are in healthcare, education, logistics, or energy, the Admin Dashboard UI brings all your essential data into one place, providing a comprehensive view of your operations. Contact us today to learn how we can help you get started with a Dashboard Template tailored to your business needs.
Buy Now and Get Started Today!
Click below to purchase and start unlocking the full potential of your business!
BUY NOW
Related Posts


This Post Has 0 Comments