The Bootstrap Admin Template is a highly versatile and user-friendly solution designed to meet the…

The Fire Bootstrap Admin Template on Power Bi with Bootstrap 5
Reading Time: 8 minutes
Power BI is an invaluable business intelligence tool that empowers organizations to visualize, analyze, and share data in real time. One of its most powerful features is the ability to use templates for creating dashboards and reports, which streamlines the process of presenting complex data. Among these templates, the Power BI Bootstrap Admin Template holds significant importance for businesses aiming to effectively manage, monitor, and optimize their Power BI environment. It helps administrators keep track of usage, performance, and other crucial aspects of Power BI, providing a comprehensive overview of the system.
In this article, we will explore the Power BI Admin Template, delve into its key features, benefits, and applications, and understand how businesses can leverage these templates to enhance data visualization and reporting.
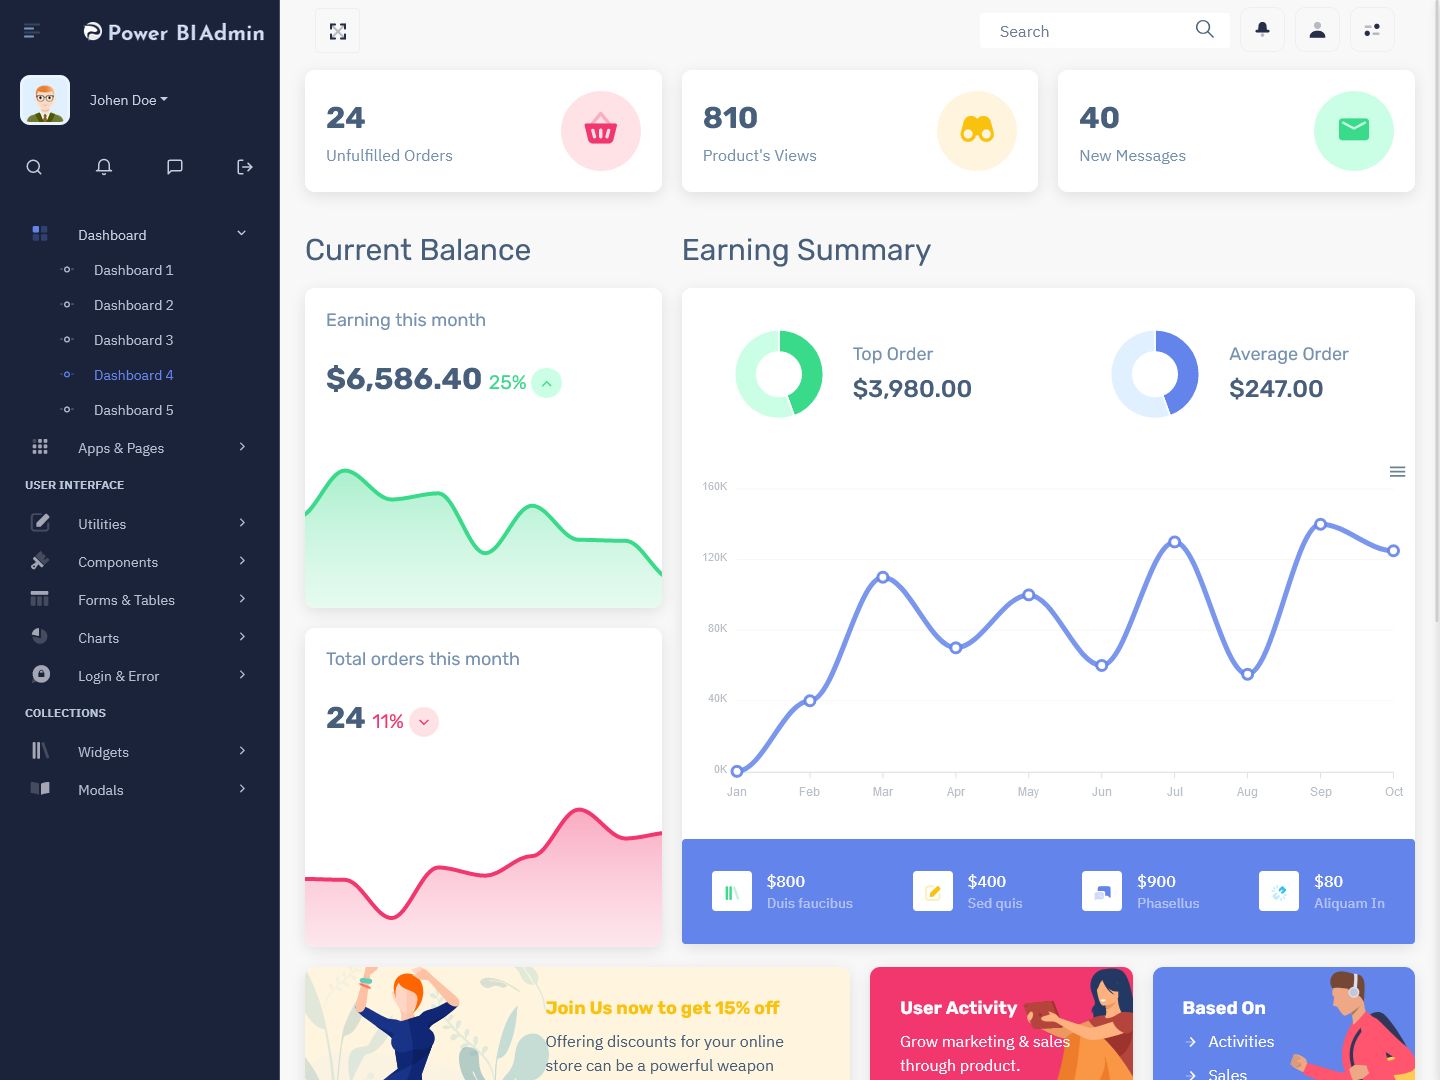
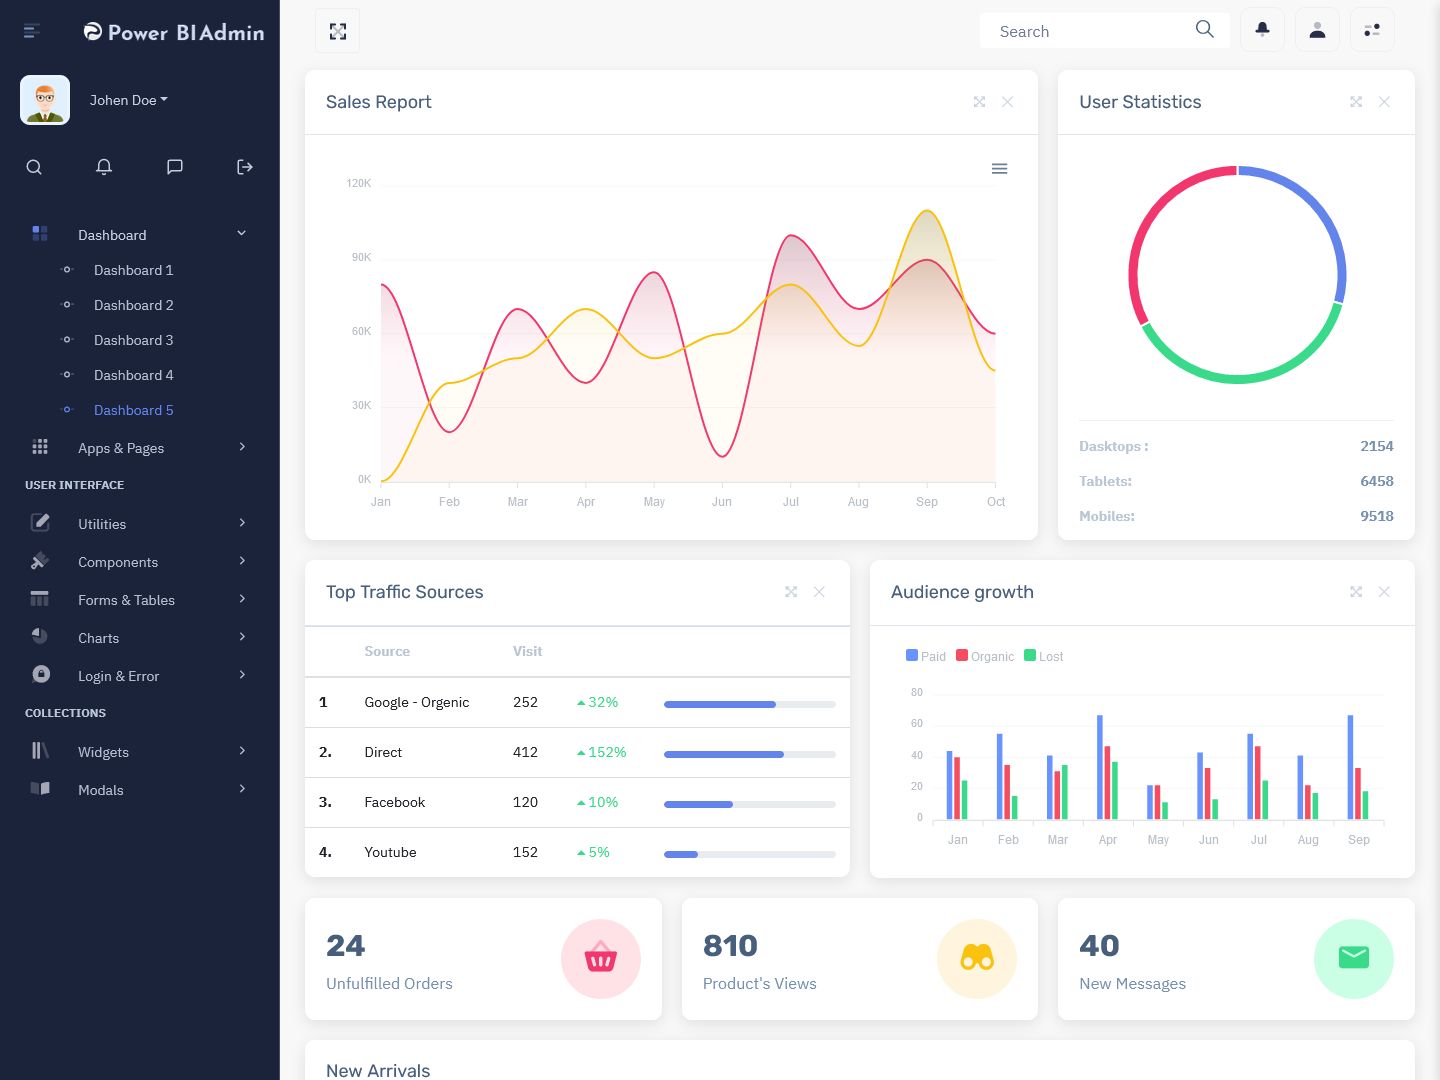
Dashboards of Power Bi Admin
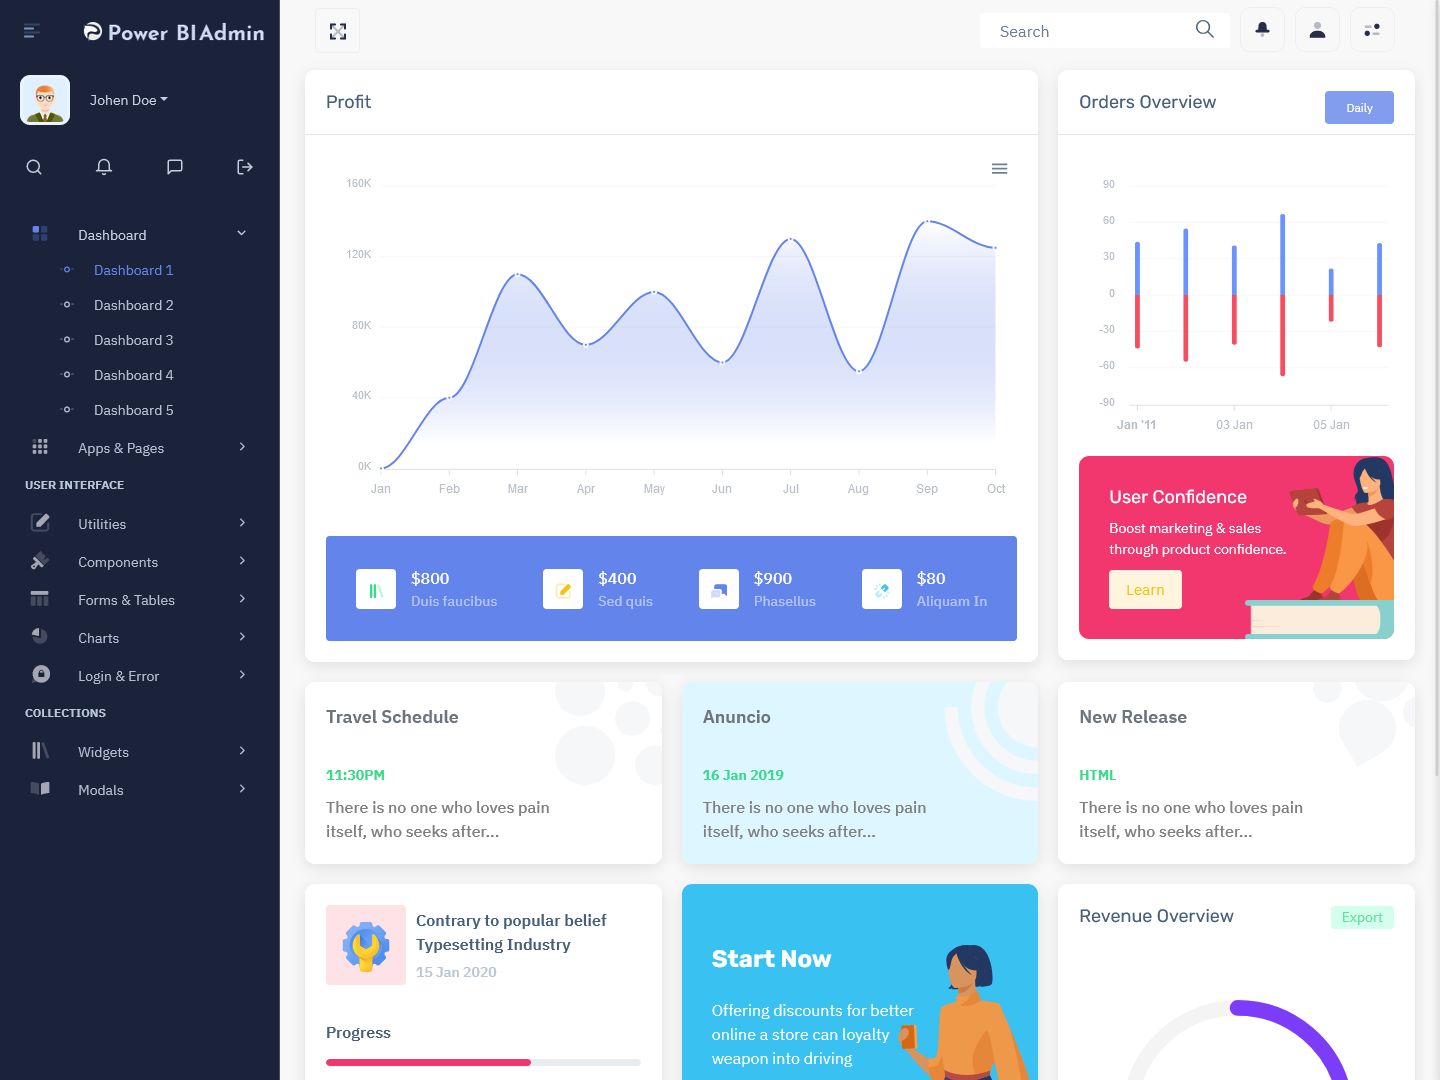
LTR Style – Light Version Dashboard – 1
MORE INFO / BUY NOW DEMO
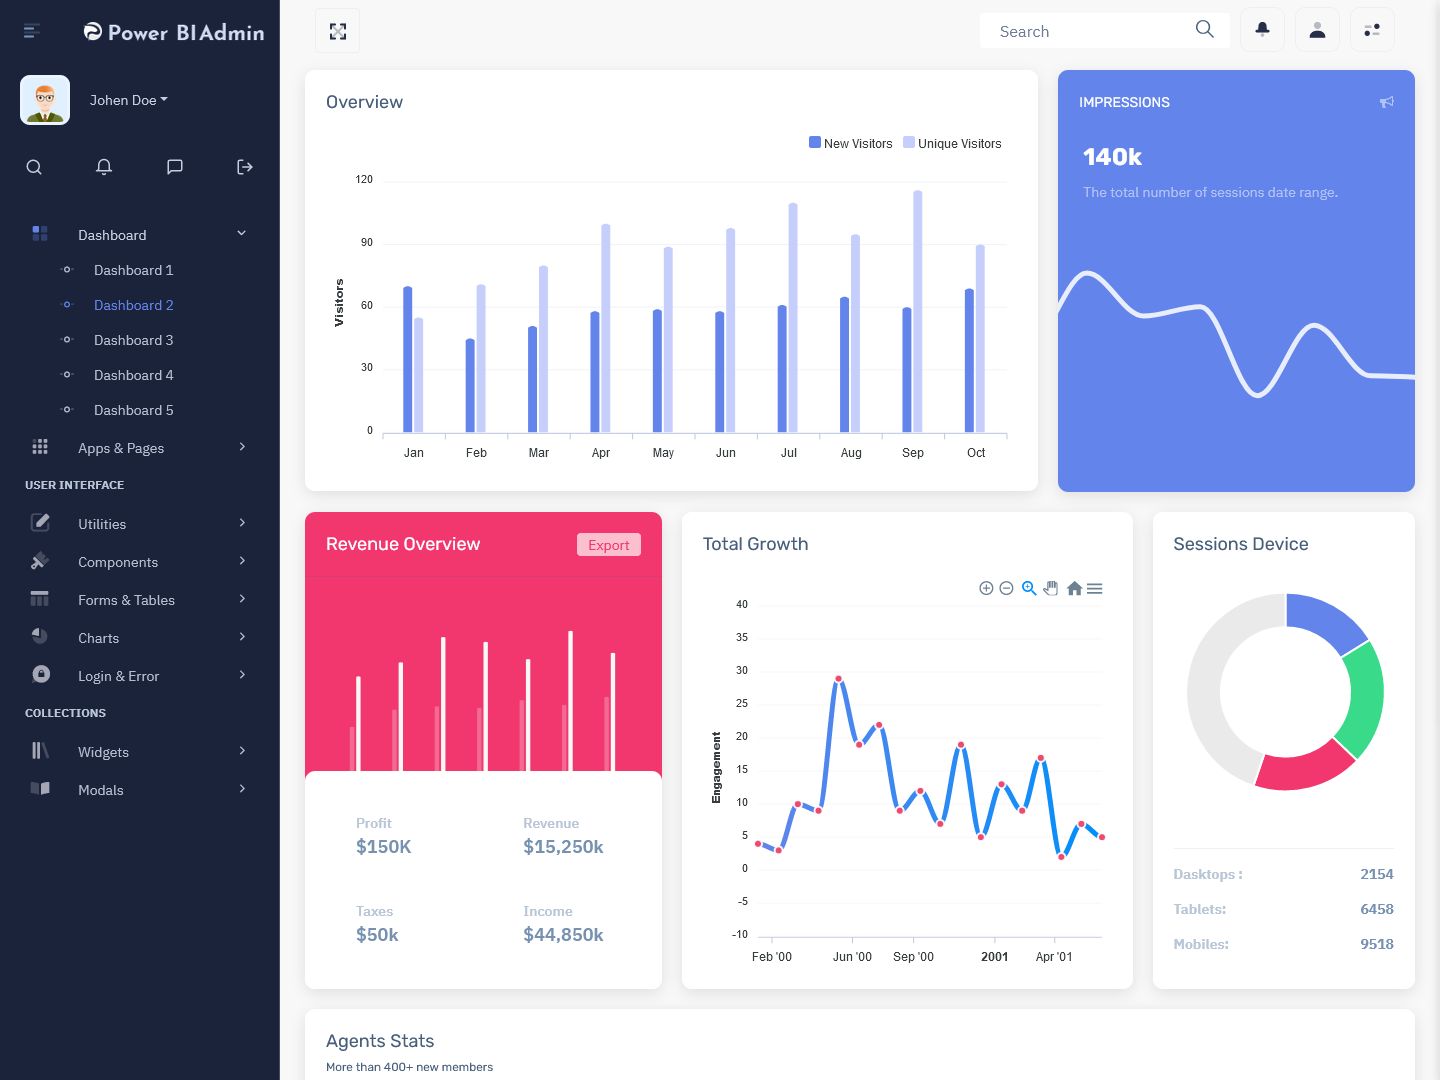
LTR Style – Light Version Dashboard – 2
MORE INFO / BUY NOW DEMO
LTR Style – Light Version Dashboard – 3
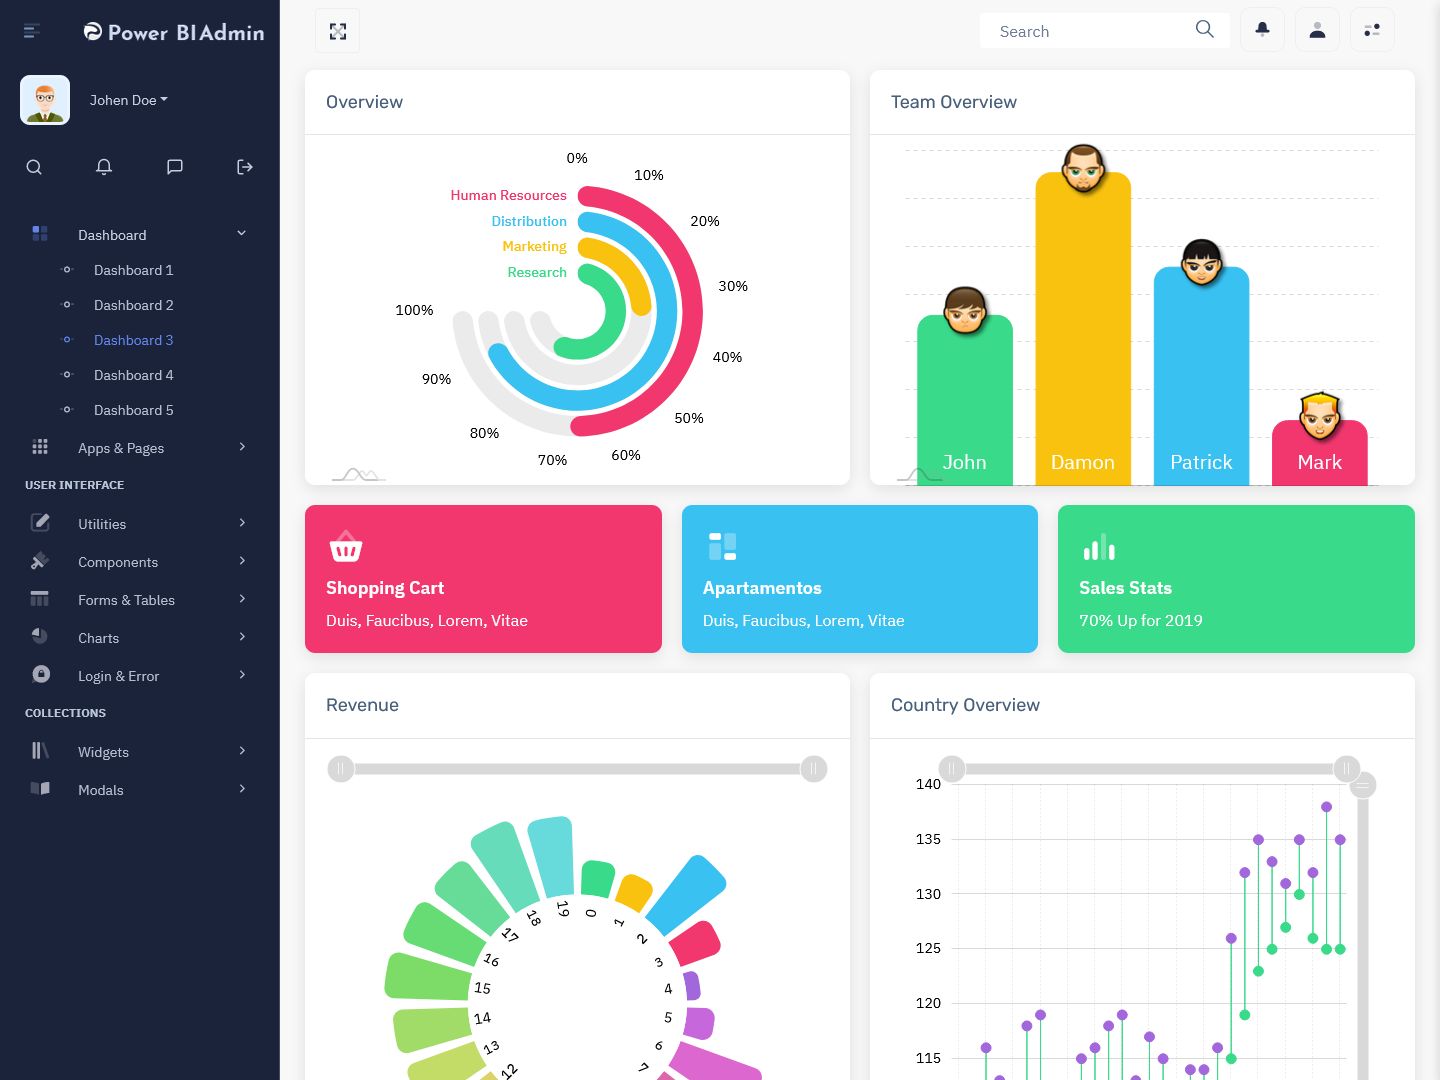
MORE INFO / BUY NOW DEMO
LTR Style – Light Version Dashboard – 4
MORE INFO / BUY NOW DEMO
LTR Style – Light Version Dashboard – 5
MORE INFO / BUY NOW DEMO
What is Power BI?
Before diving into the specifics of Power BI Master Dashboard Templates, it’s essential to understand what Power BI is and why it’s so valuable to businesses.
Power BI is a suite of business analytics tools developed by Microsoft. It enables users to connect to a wide variety of data sources, clean and transform the data, and then create visually rich reports and dashboards. Power BI dashboards are a compilation of interactive visualizations and reports that provide real-time insights, which help decision-makers monitor key metrics and KPIs (Key Performance Indicators).
Power BI provides several features for business intelligence tasks, including data cleaning, transformation, data visualization, report creation, and sharing. With its cloud-based architecture, users can access and interact with their reports from anywhere, at any time. Additionally, Power BI integrates seamlessly with Microsoft Office tools, Azure services, and other third-party data sources, making it an incredibly versatile platform for organizations of all sizes.
Dashboards of Power Bi Admin
RTL Style – Dark Version Dashboard – 1
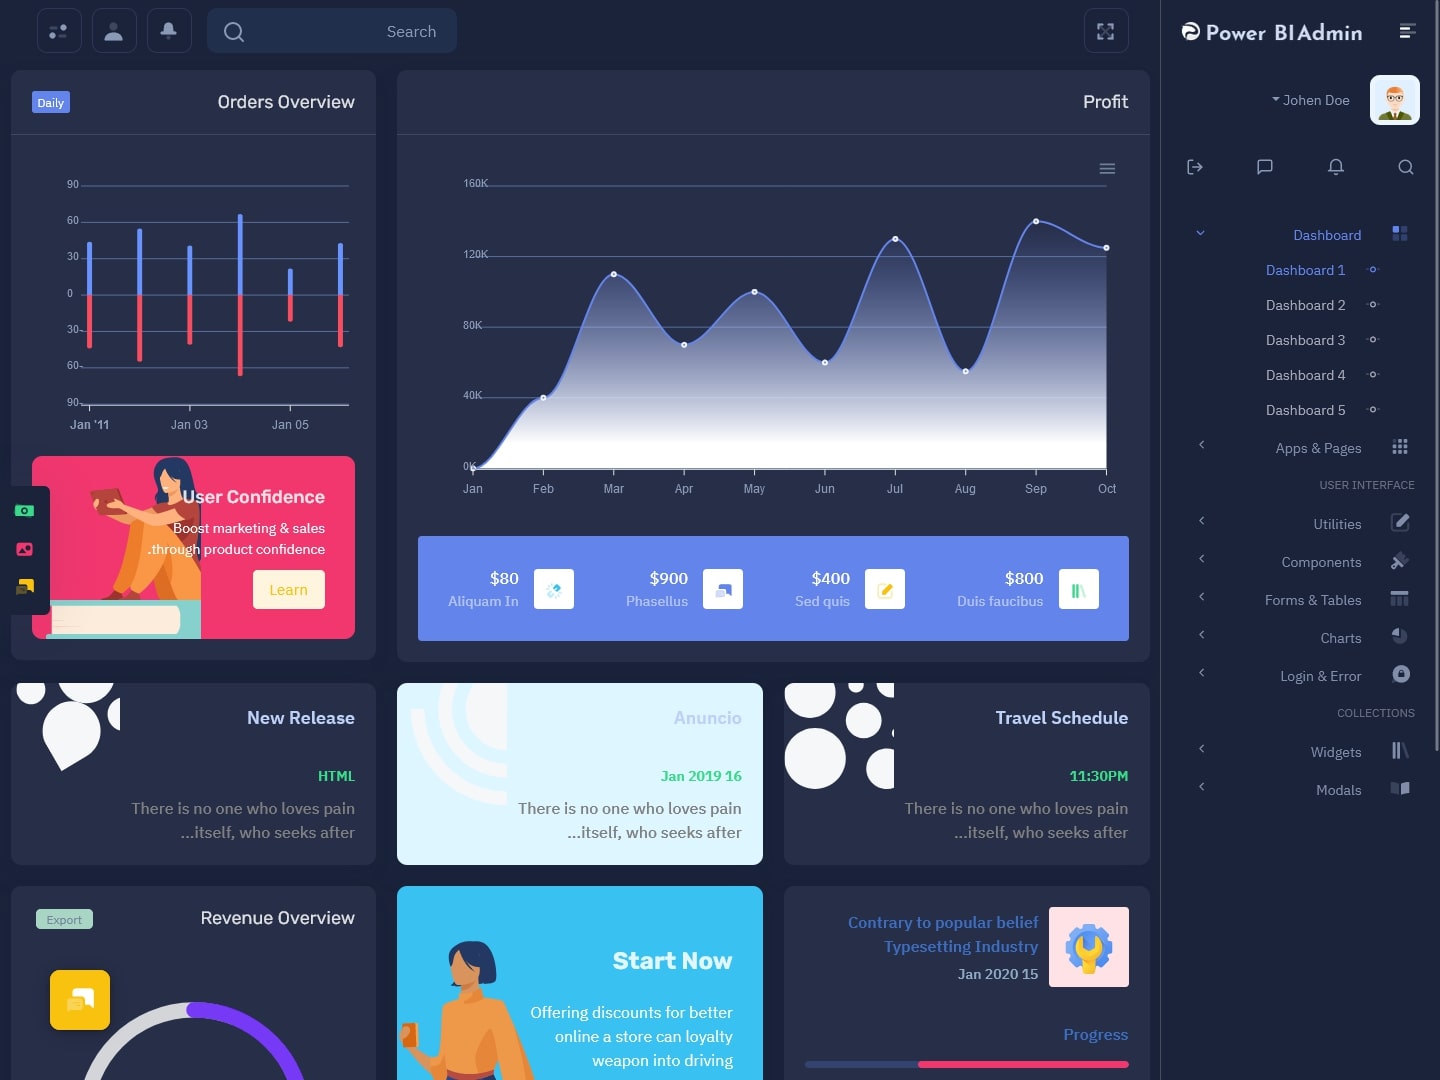
MORE INFO / BUY NOW DEMO
RTL Style – Dark Version Dashboard – 3
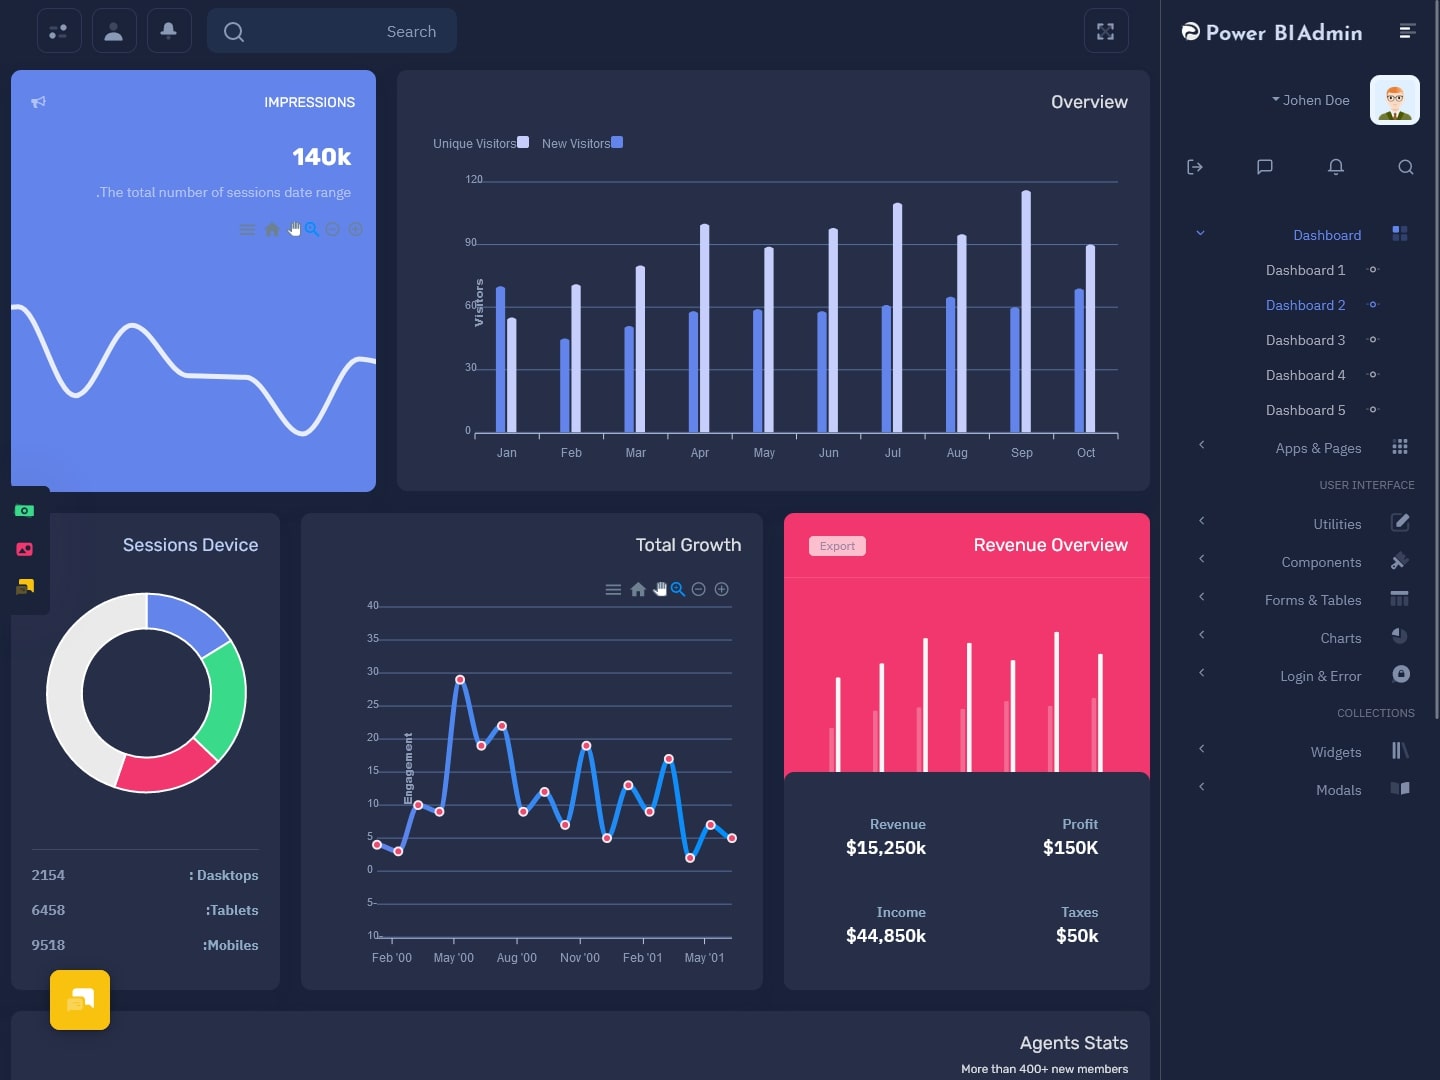
MORE INFO / BUY NOW DEMO
RTL Style – Dark Version Dashboard – 4
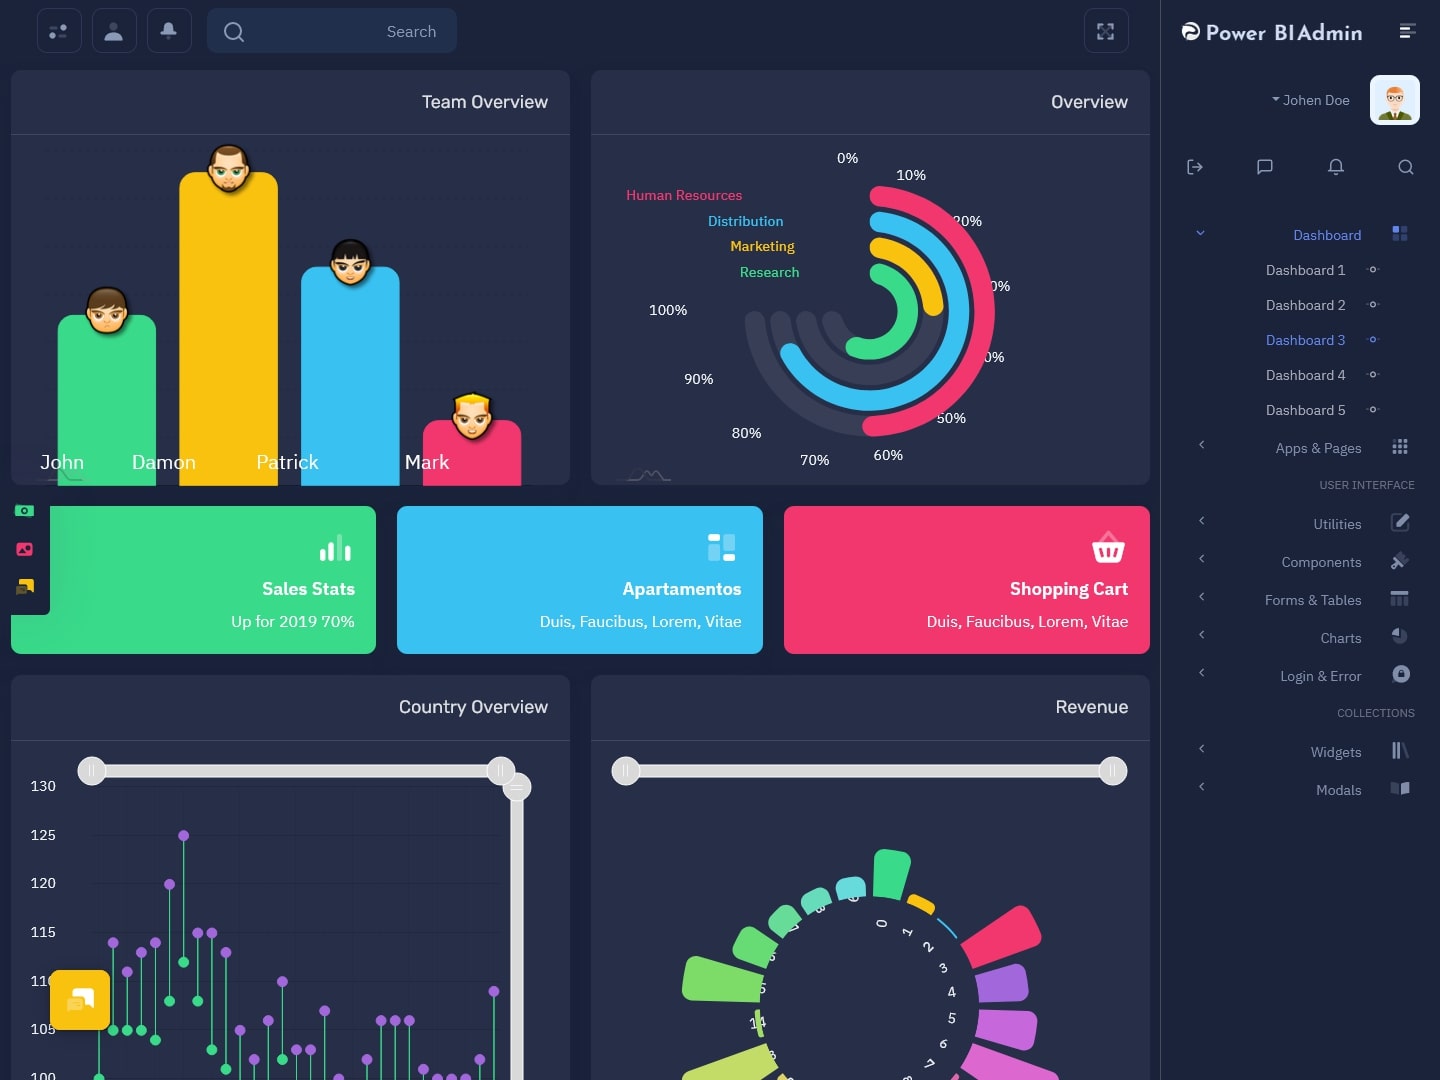
MORE INFO / BUY NOW DEMO
RTL Style – Dark Version Dashboard – 4
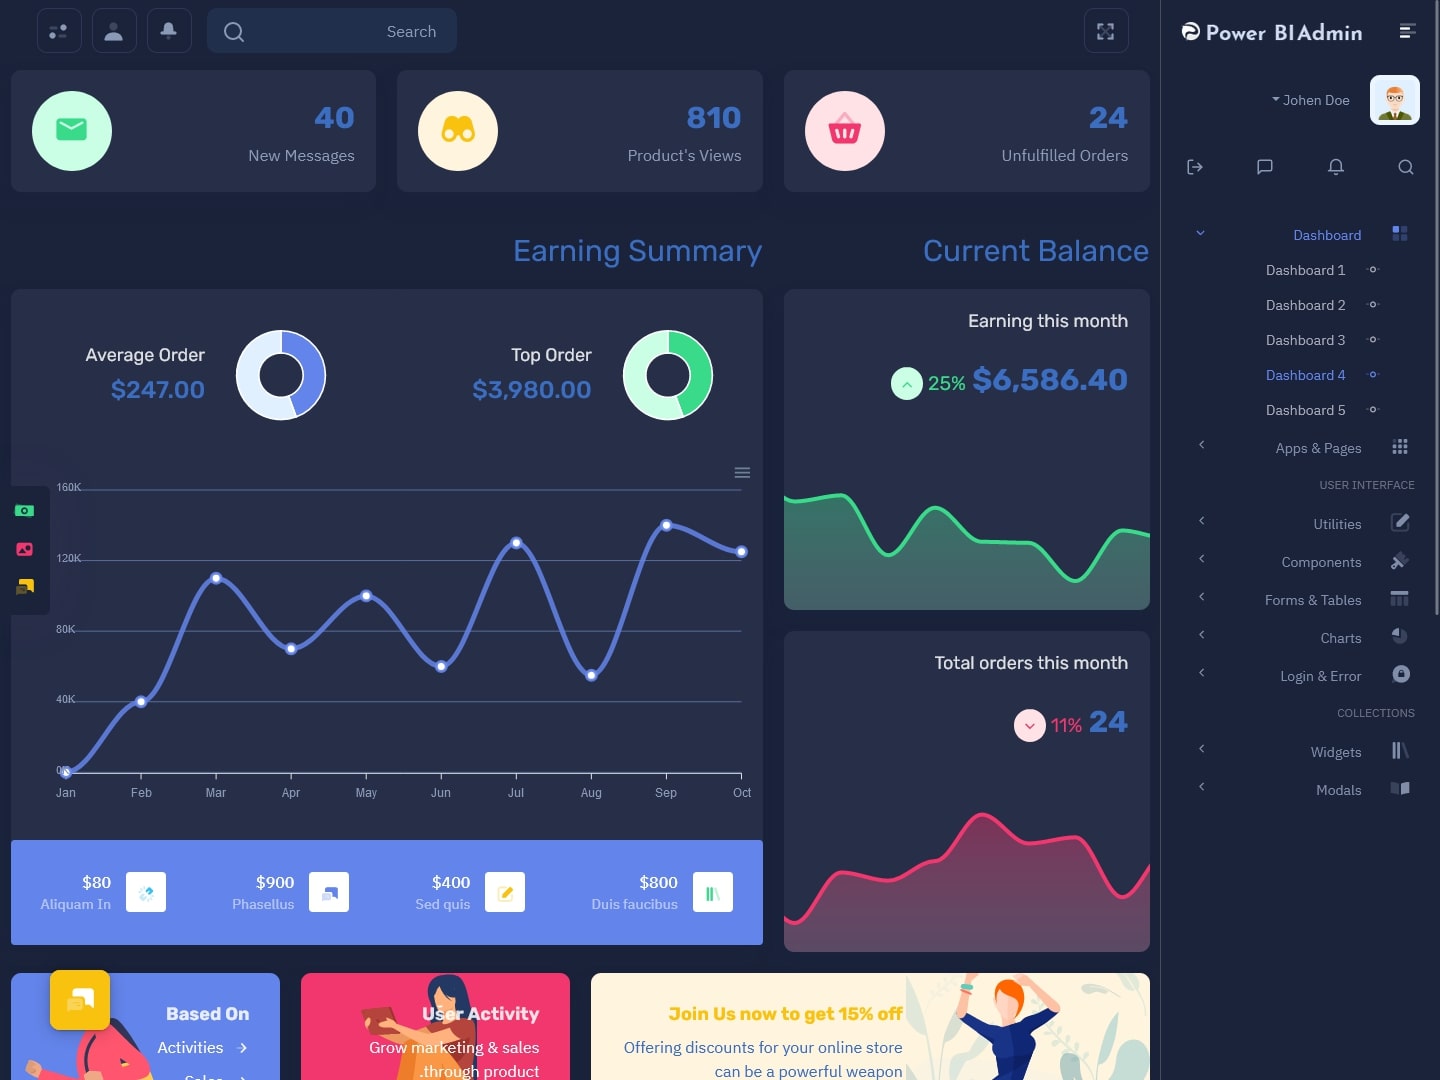
MORE INFO / BUY NOW DEMO
RTL Style – Dark Version Dashboard – 5
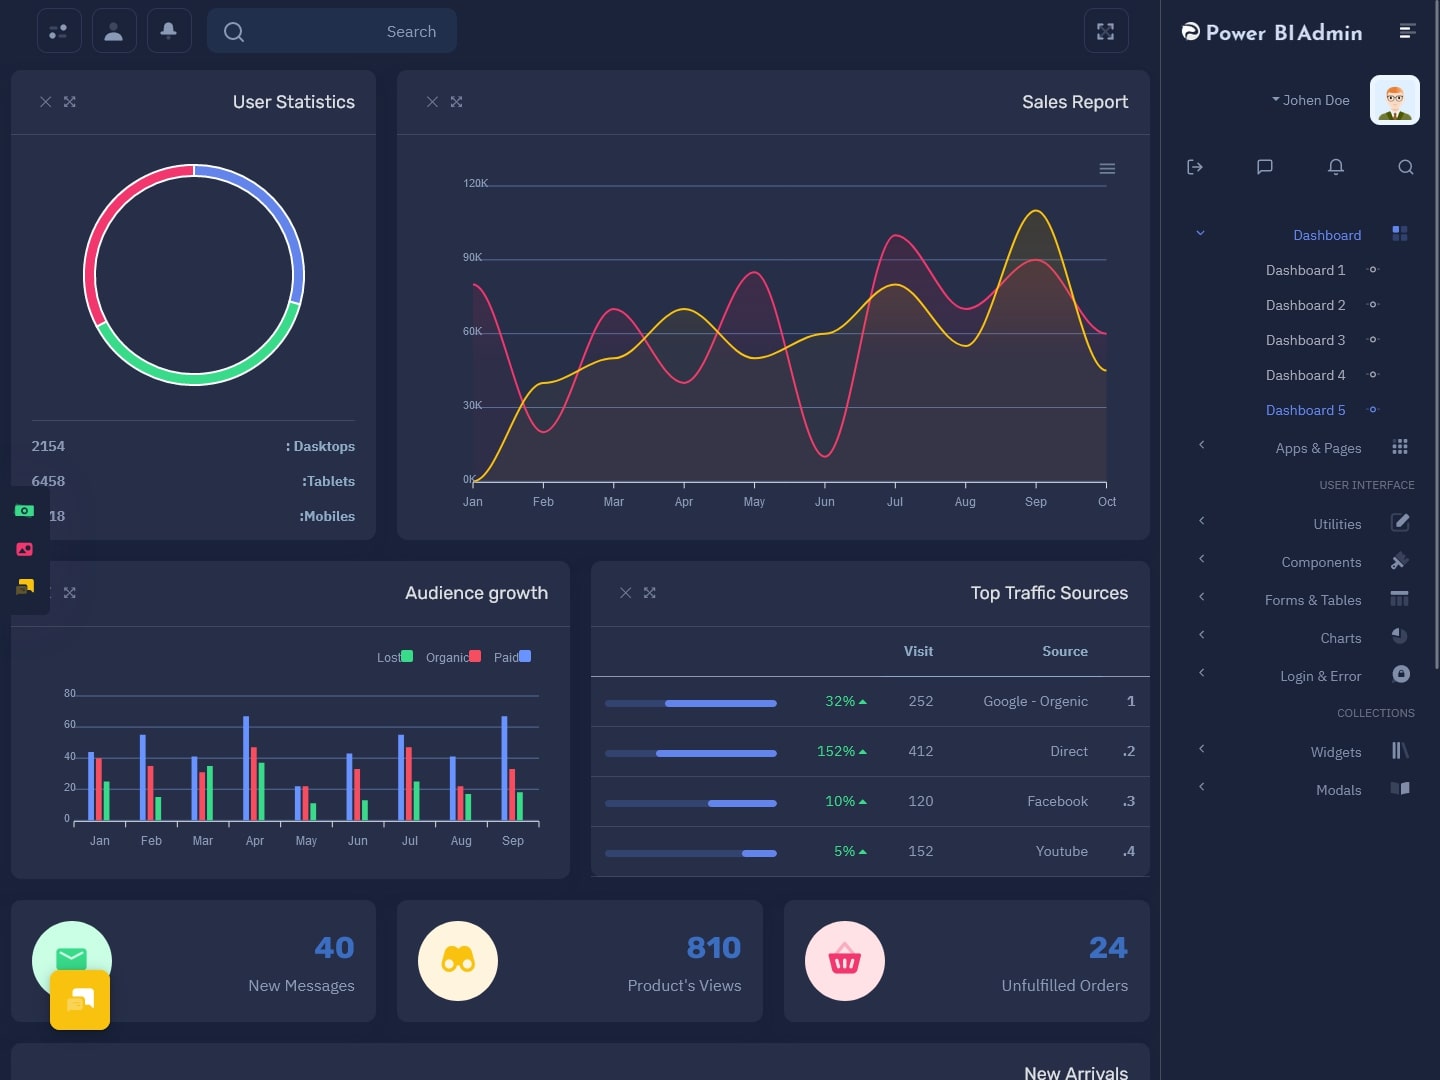
MORE INFO / BUY NOW DEMO
What is a Power BI Admin Template?
The Bootstrap Admin Template is a pre-built framework designed specifically for Power BI administrators. It offers a set of standard reports and dashboards that are particularly focused on the usage and performance of Power BI environments. This template is used by Power BI admins to gain insights into key aspects such as report consumption, dataset refresh performance, user activity, and license allocation.
The Power BI Admin Template is typically available as a downloadable template file (.pbit), which can be imported into a Power BI workspace. Once imported, the template automatically populates the dashboard with data from the Power BI Admin API, and the admin can use it to track the health and performance of their Power BI services.
Key Features of Power BI Admin Template
- User Activity and Usage Tracking: One of the primary features of the Power BI Admin Template is its ability to track and monitor user activity. Admins can see how many users are actively engaging with the Power BI reports, how often they are using them, and which reports or datasets are the most popular. This information is essential for understanding user engagement and identifying areas for improvement.
- Dataset Refresh Monitoring: Power BI allows administrators to schedule automatic data refreshes for their reports and dashboards. The Admin Template provides insights into the performance and success rates of these scheduled refreshes. Admins can track which datasets are failing or succeeding in terms of refresh performance, helping them troubleshoot issues proactively.
- Capacity Utilization Insights: The Admin Dashboard UI provides metrics related to Power BI capacity usage, including CPU, memory, and storage consumption. This information is essential for administrators to assess the efficiency of the Power BI environment and make necessary adjustments to ensure that resources are being allocated optimally.
- Licensing and User Management: Admins can also use the template to track user licenses and permissions. It allows them to monitor the allocation of Power BI licenses to users, helping ensure that users have the correct level of access and that no license is being underutilized.
- Performance Insights: The template includes metrics related to the performance of Power BI reports, including load times and rendering speeds. These insights are critical for understanding the performance bottlenecks in the system and optimizing the report performance to ensure a seamless experience for end-users.
- Audit Logs: The Admin Template can provide logs of user activities, such as report sharing, dataset refresh history, and other administrative actions. This can help track changes and ensure the security and integrity of the system.
Benefits of Using the Power BI Admin Template
- Improved Decision Making: By having real-time data on the performance and usage of Power BI, administrators can make data-driven decisions that improve system efficiency. For example, if usage patterns show that certain reports are underutilized, admins can work to improve their visibility or even retire them to free up resources.
- Proactive Issue Resolution: The template provides early indicators of potential issues. For instance, if dataset refreshes are failing, admins can act quickly to resolve the issue, minimizing downtime and ensuring the accuracy of the data in reports.
- Cost Optimization: Monitoring license usage and capacity performance helps ensure that organizations are not overpaying for unused resources. By identifying unused licenses or excess capacity, businesses can optimize their Power BI expenditures and better allocate resources.
- Increased User Adoption: By tracking user activity, admins can identify gaps in user engagement with Power BI. If certain teams are not using the tool effectively, targeted training or communication can be provided to increase adoption across the organization.
- Streamlined Reporting and Monitoring: Rather than manually collecting data across multiple Power BI workspaces and reports, the Admin Template streamlines the process by centralizing these insights into one dashboard. This reduces administrative overhead and allows admins to focus on higher-value tasks.
How to Use Power BI Admin Templates
Using the Power BI Bootstrap Admin Template is straightforward, even for organizations new to Power BI administration. Here’s a step-by-step guide to help you get started:
- Download the Power BI Admin Template: You can find the Power BI Dashboard UI on the Power BI website or the Microsoft documentation portal. Download the template file.
- Import the Template into Power BI Desktop: Open Power BI Desktop and click on the “File” menu. Select “Import” and choose the downloaded template file. This will import the necessary queries and report structures into your workspace.
- Connect to the Power BI Admin API: After importing the template, you need to connect it to the Power BI Admin API to pull data related to your Power BI environment. This involves providing appropriate credentials (Azure Active Directory admin credentials) that allow you to access the necessary data.
- Customize the Template: While the template comes with predefined metrics and visuals, it’s important to customize the template to match your organization’s specific needs. You can modify visualizations, add or remove fields, and adjust the design to better represent the data relevant to your business.
- Publish to Power BI Service: Once the report is customized, you can publish it to the Power BI service, where it can be shared with other administrators and stakeholders. The report can be updated automatically to reflect real-time data, keeping your team informed at all times.
- Monitor and Act: Use the Admin Dashboard UI to track important metrics and monitor system performance. If issues are detected, take proactive measures to resolve them quickly. Over time, you can refine your usage of the template based on the insights it provides.
Customizing Power BI Dashboard Templates
Power BI Bootstrap Admin Template is a set of pre-designed frameworks that provide a structured, visual representation of data. These templates can be customized to cater to the unique needs of different departments or functions within an organization. In contrast to the more specialized Power BI Admin Template, general Power BI dashboard templates can be used to visualize KPIs, sales metrics, financial data, and more. The flexibility of Power BI allows businesses to create dashboards that are both functional and visually appealing.
Here’s how businesses can leverage and customize Power BI Dashboard Templates:
- Choosing the Right Template: Start by selecting a Power BI template that aligns with the specific goals or KPIs you want to track. Power BI offers a wide range of pre-built templates that cater to different industries and business needs. These include templates for sales, marketing, finance, operations, and more.
- Customizing Visualizations: Power BI Master Dashboard come with various visualization options, such as bar charts, line charts, pie charts, tables, and maps. These can be customized to reflect the data that matters most to your organization. For example, a sales dashboard may include KPIs like total sales, customer acquisition, or sales growth percentage.
- Integrating Data Sources: Power BI templates are highly customizable, allowing you to integrate data from multiple sources. Whether it’s Excel files, cloud-based data, or third-party apps, you can connect your Power BI dashboards to a variety of data sources to present a complete picture of your business performance.
- Design Consistency: One of the key benefits of using Power BI Dashboard Templates is the ability to maintain design consistency across reports. With templates, you can ensure that all stakeholders are looking at the same data presented in a uniform and standardized manner, which improves communication and decision-making.
- Real-Time Data Updates: Power BI supports real-time data updates, meaning that the dashboard will reflect the most current data at any given time. This is particularly useful for monitoring live KPIs and making timely decisions based on the latest performance metrics.
Conclusion
The Power BI Bootstrap Admin Template is an essential tool for organizations seeking to optimize and manage their Power BI environment effectively. By providing insights into user activity, data refresh performance, licensing, and system health, it allows admins to proactively manage resources, optimize performance, and ensure smooth operations.
In addition to the admin-focused template, Power BI dashboards offer organizations a way to present key business metrics in a visually compelling and accessible format. With pre-designed templates and the ability to customize visuals and data sources, businesses can streamline reporting, increase user engagement, and ultimately drive better decision-making.
Leveraging both the Power BI Admin Template and Power BI Dashboard Templates enables businesses to maintain a well-optimized Power BI environment while also ensuring that stakeholders have access to the insights they need to make informed, data-driven decisions. Whether used for monitoring system performance or visualizing business KPIs, Power BI templates play a critical role in enhancing the value of data for organizations across the globe.
Buy Now and Get Started Today!
Click below to purchase and start unlocking the full potential of your business!
 skip to Main Content




This Post Has 0 Comments