
In today’s digital world, every business depends on powerful web applications to manage operations, users,…
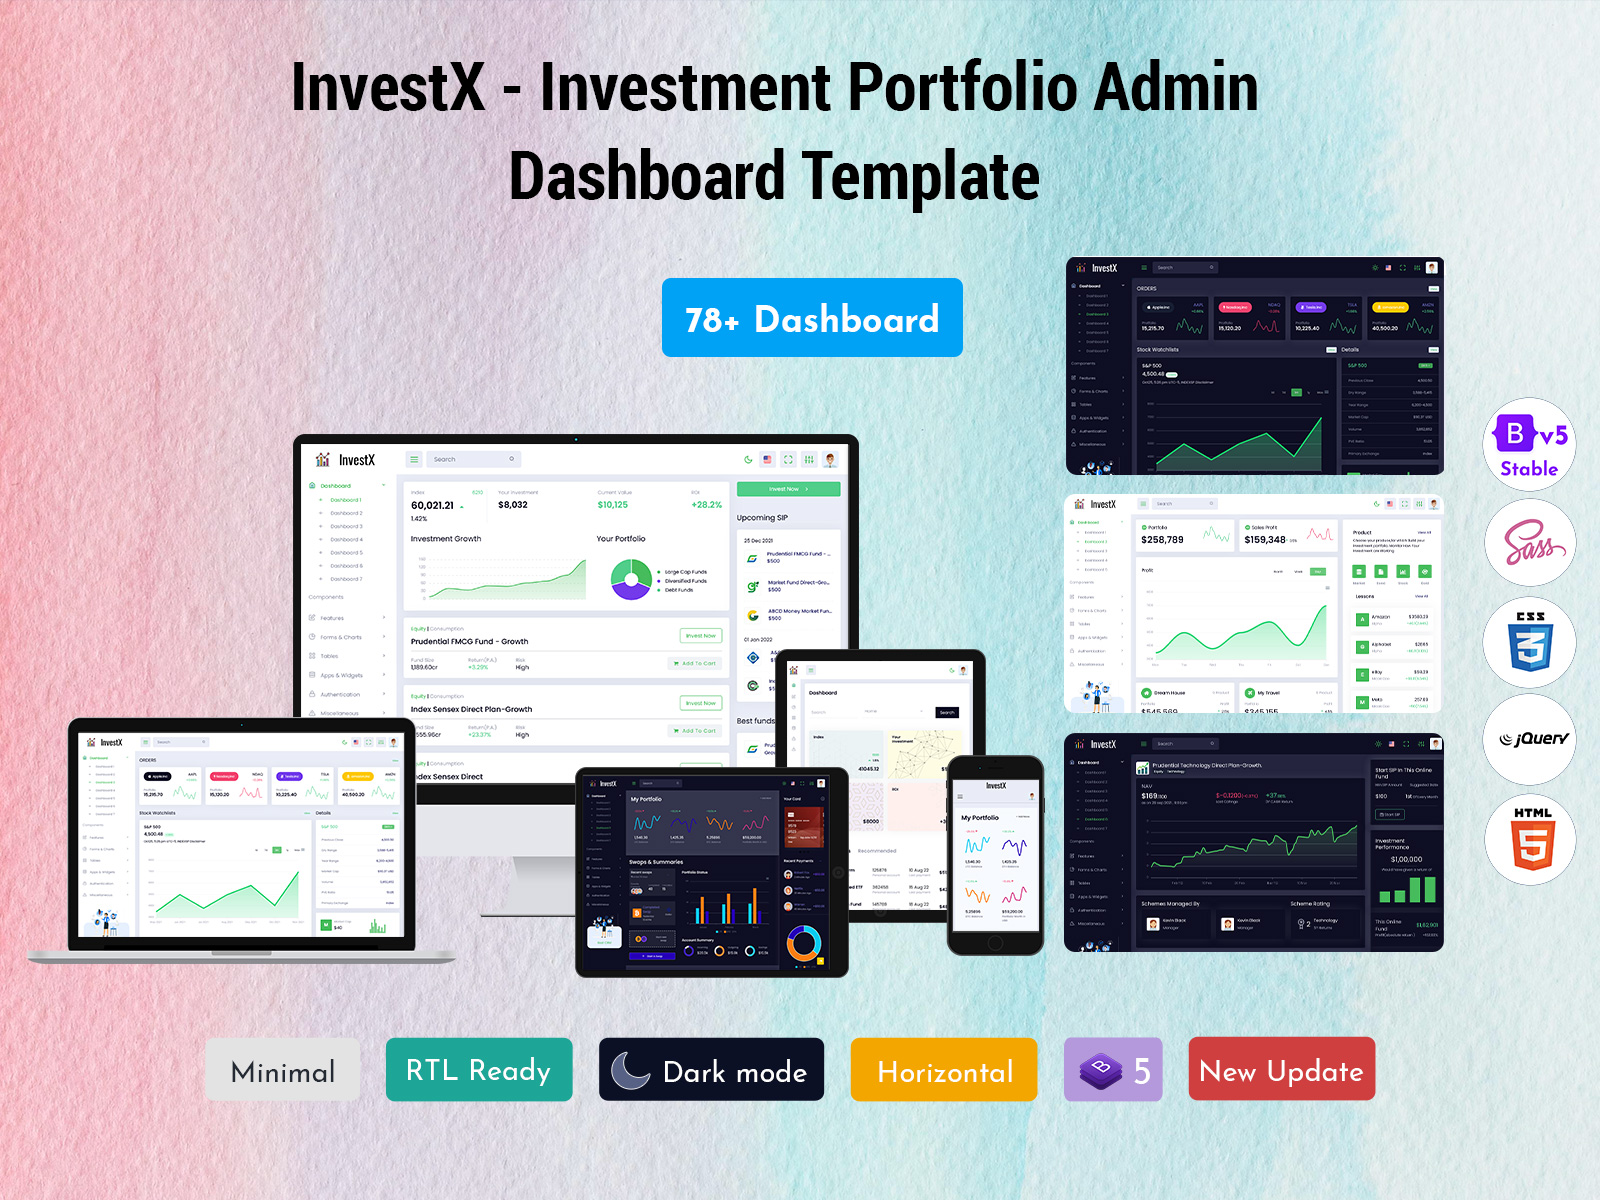
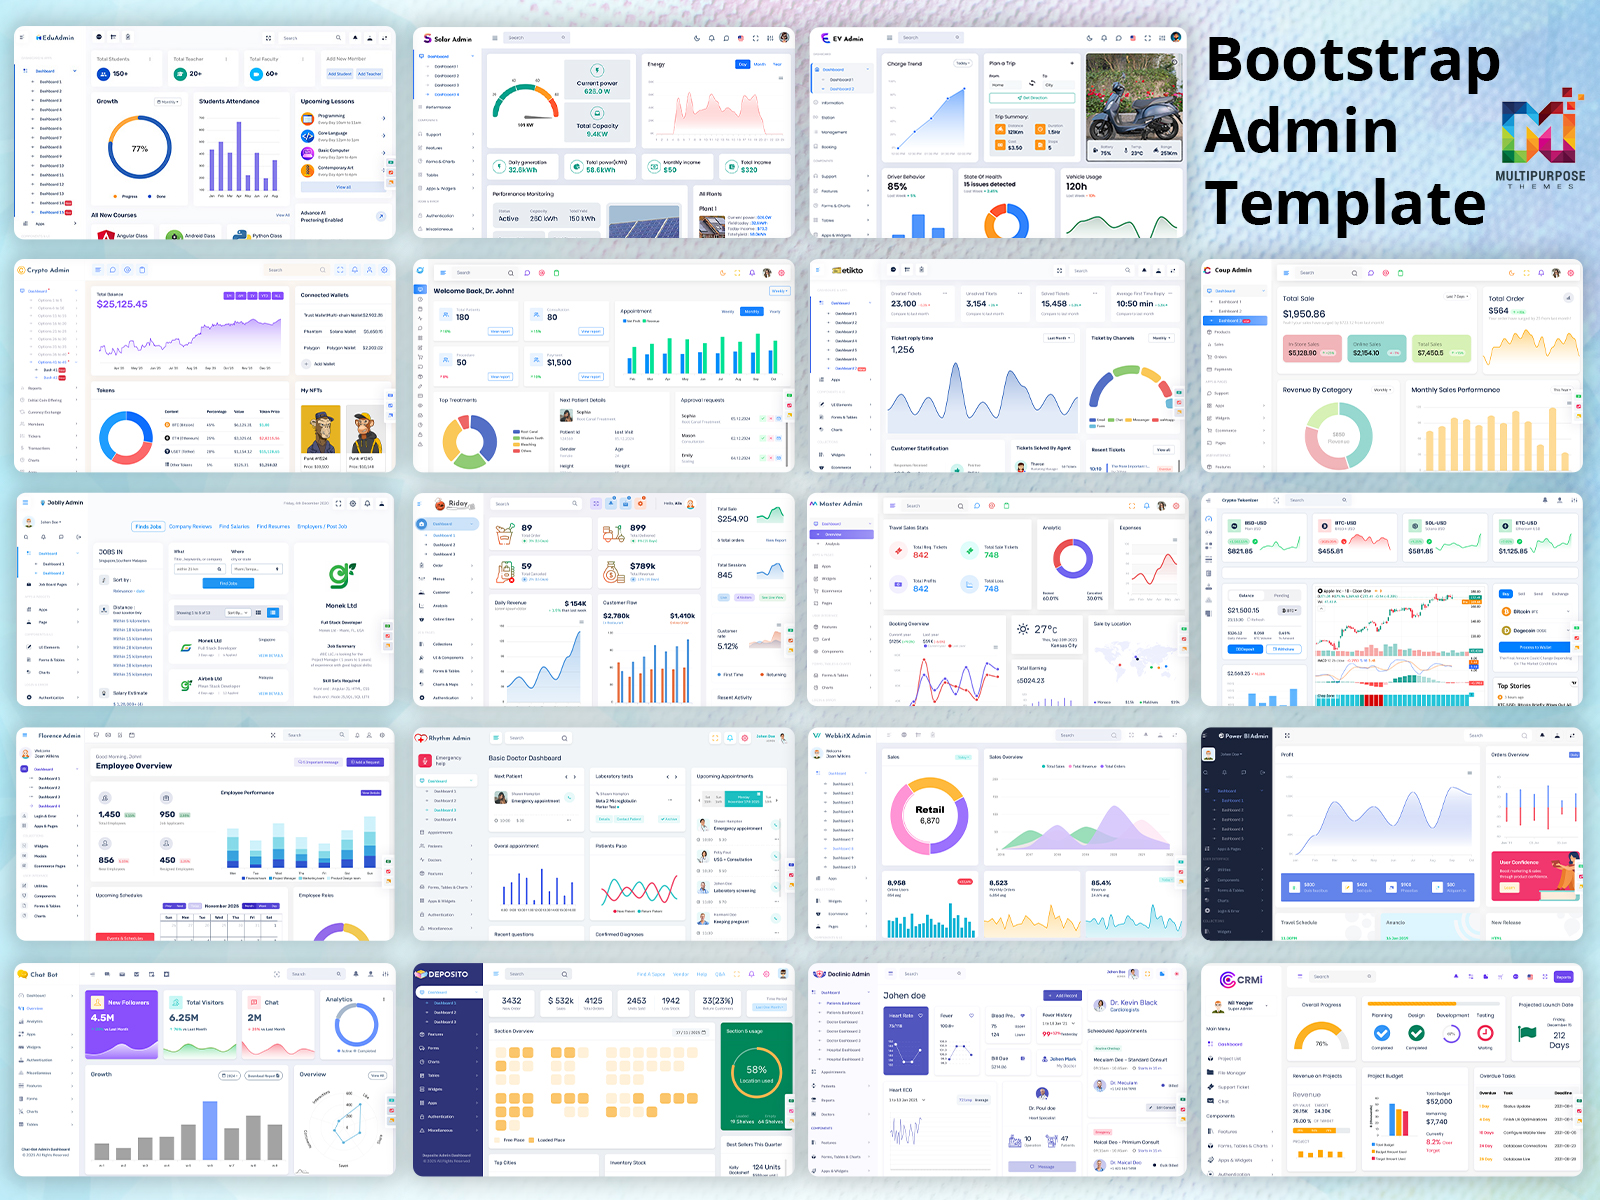
Investment Portfolio Admin Dashboard Template with UI Framework
Reading Time: 5 minutes
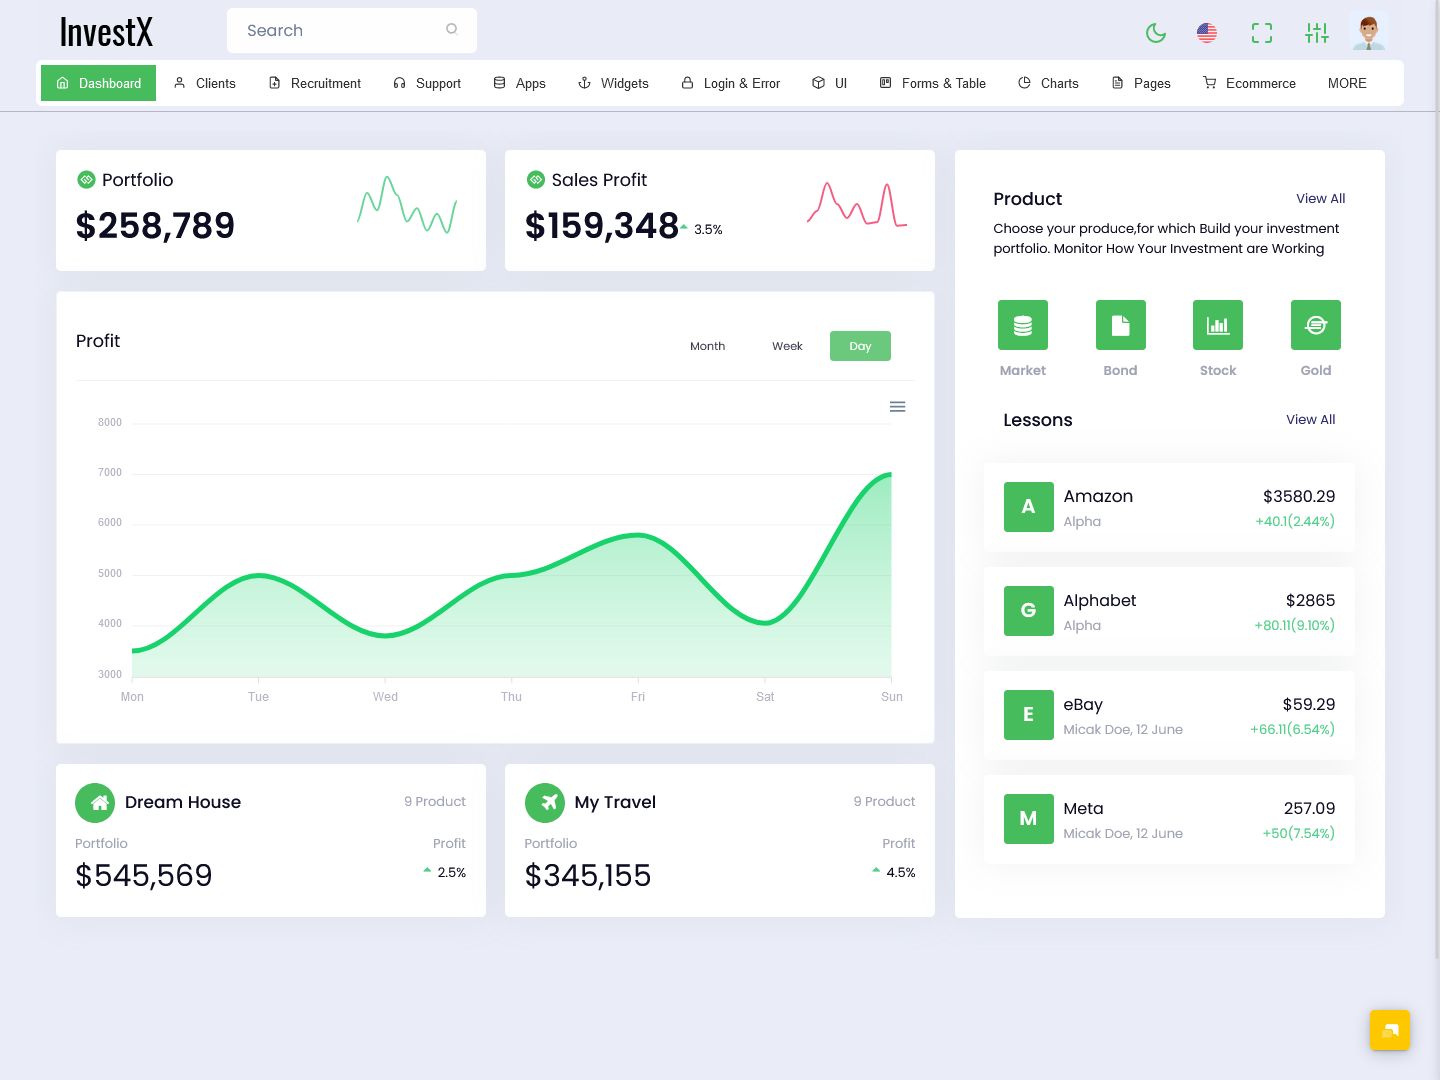
Investment Portfolio Admin Dashboard is a computer software program which is helpful for audit and administration purposes. The main function of it is to manage and inspect the pool of investment which a company dedicates to its various business projects. It keeps a track and measures the status of investment activity through a range of key performance indicators. As a result, the whole process of administration becomes hassle free and the company can focus on its core parameters easily. Apart from it, Dashboard Admin Templates have various types of usages. It helps the organization to provide a report of assets performance to owners, investors, sponsors and other focused parties and stakeholders.
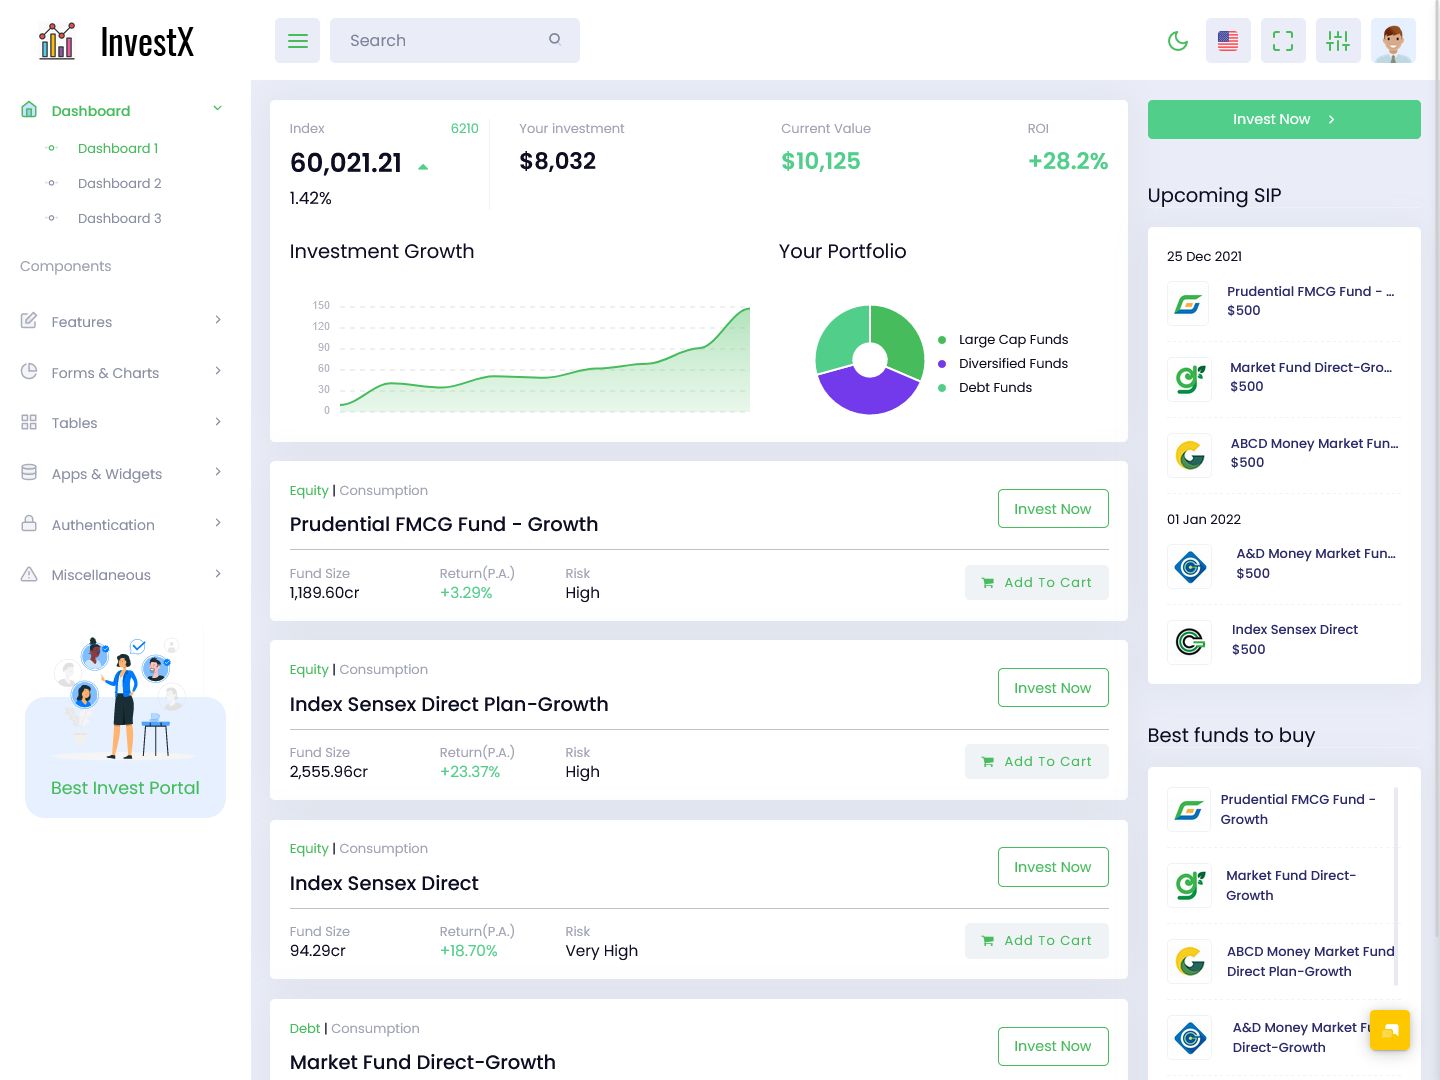
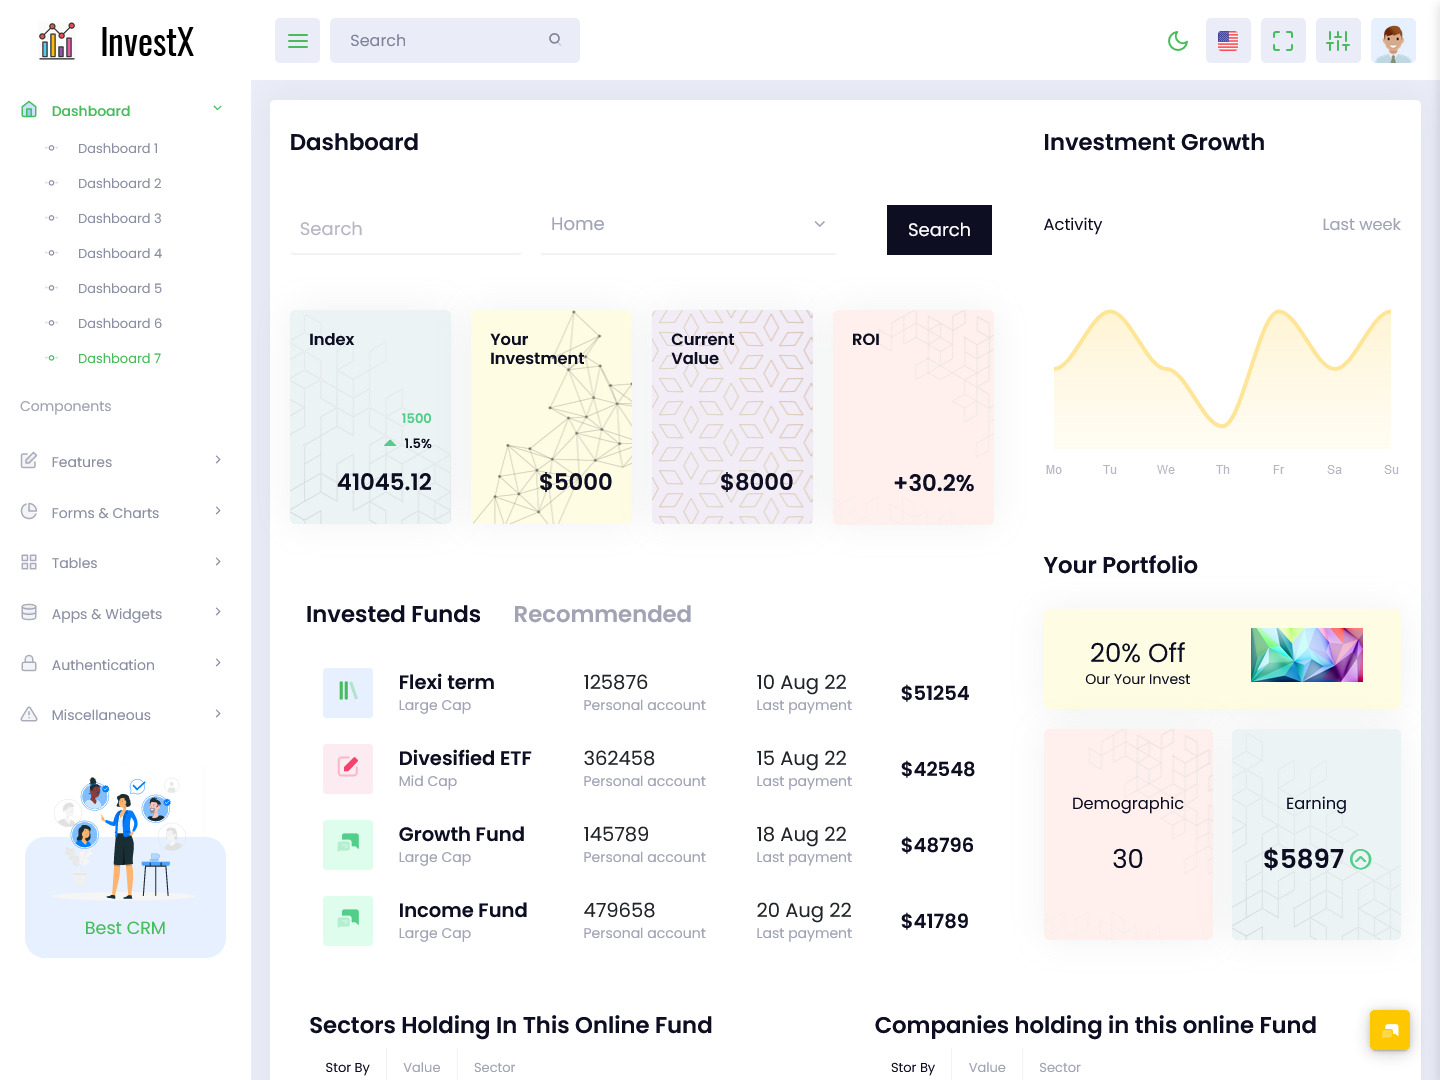
Admin Dashboard 1
MORE INFO / BUY NOW DEMO
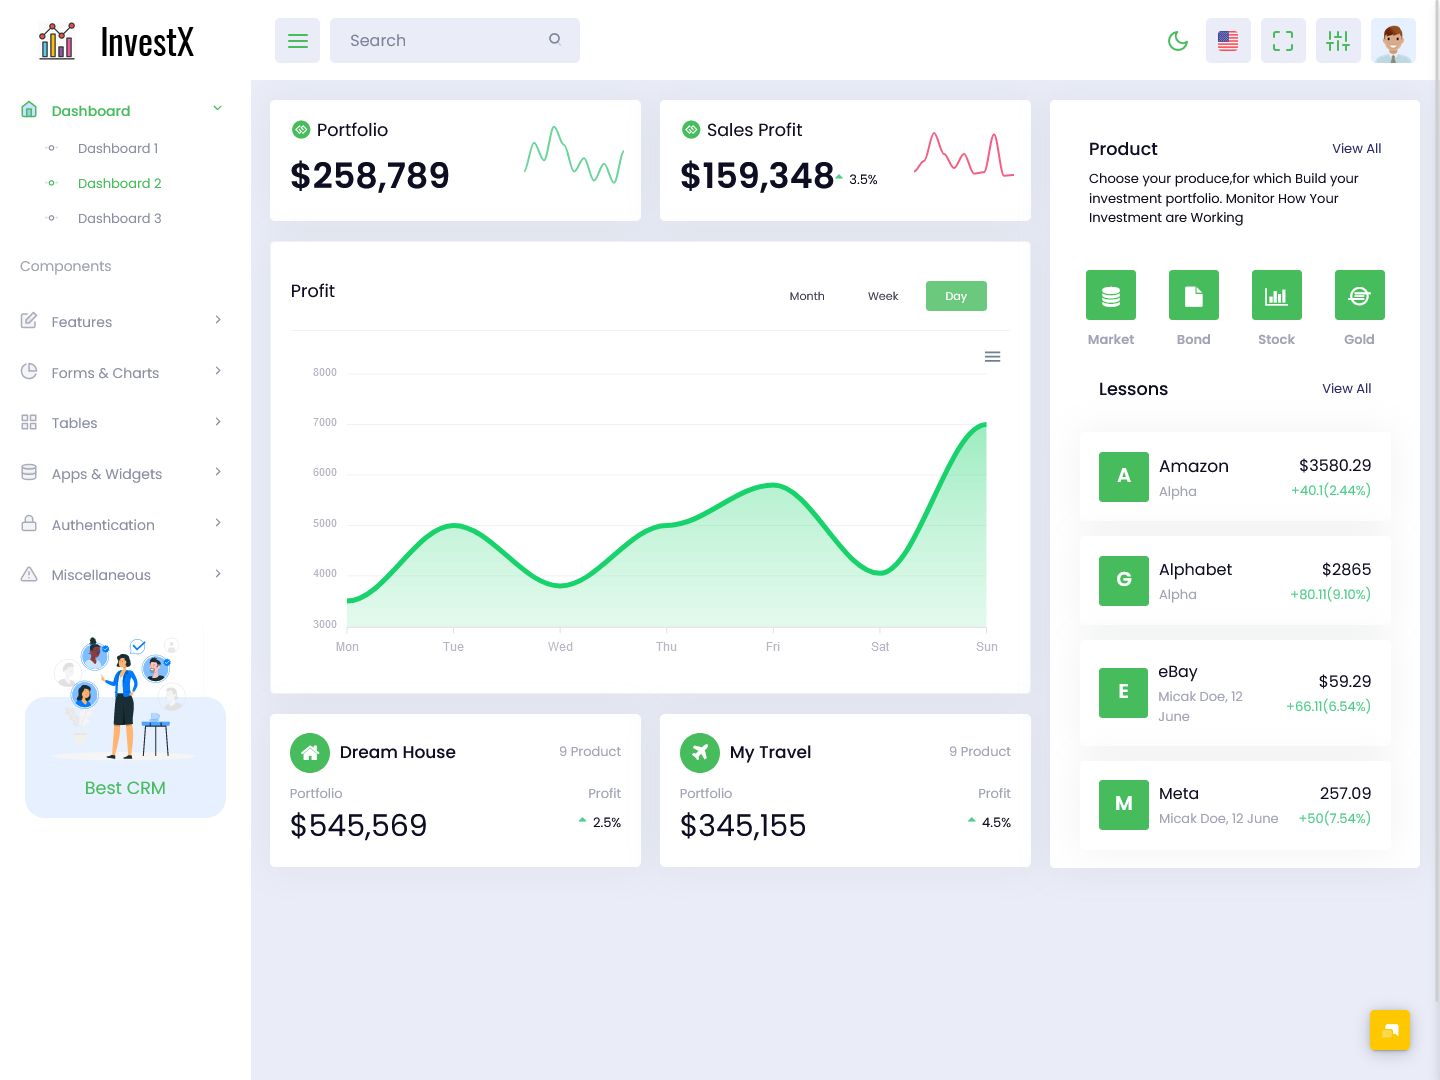
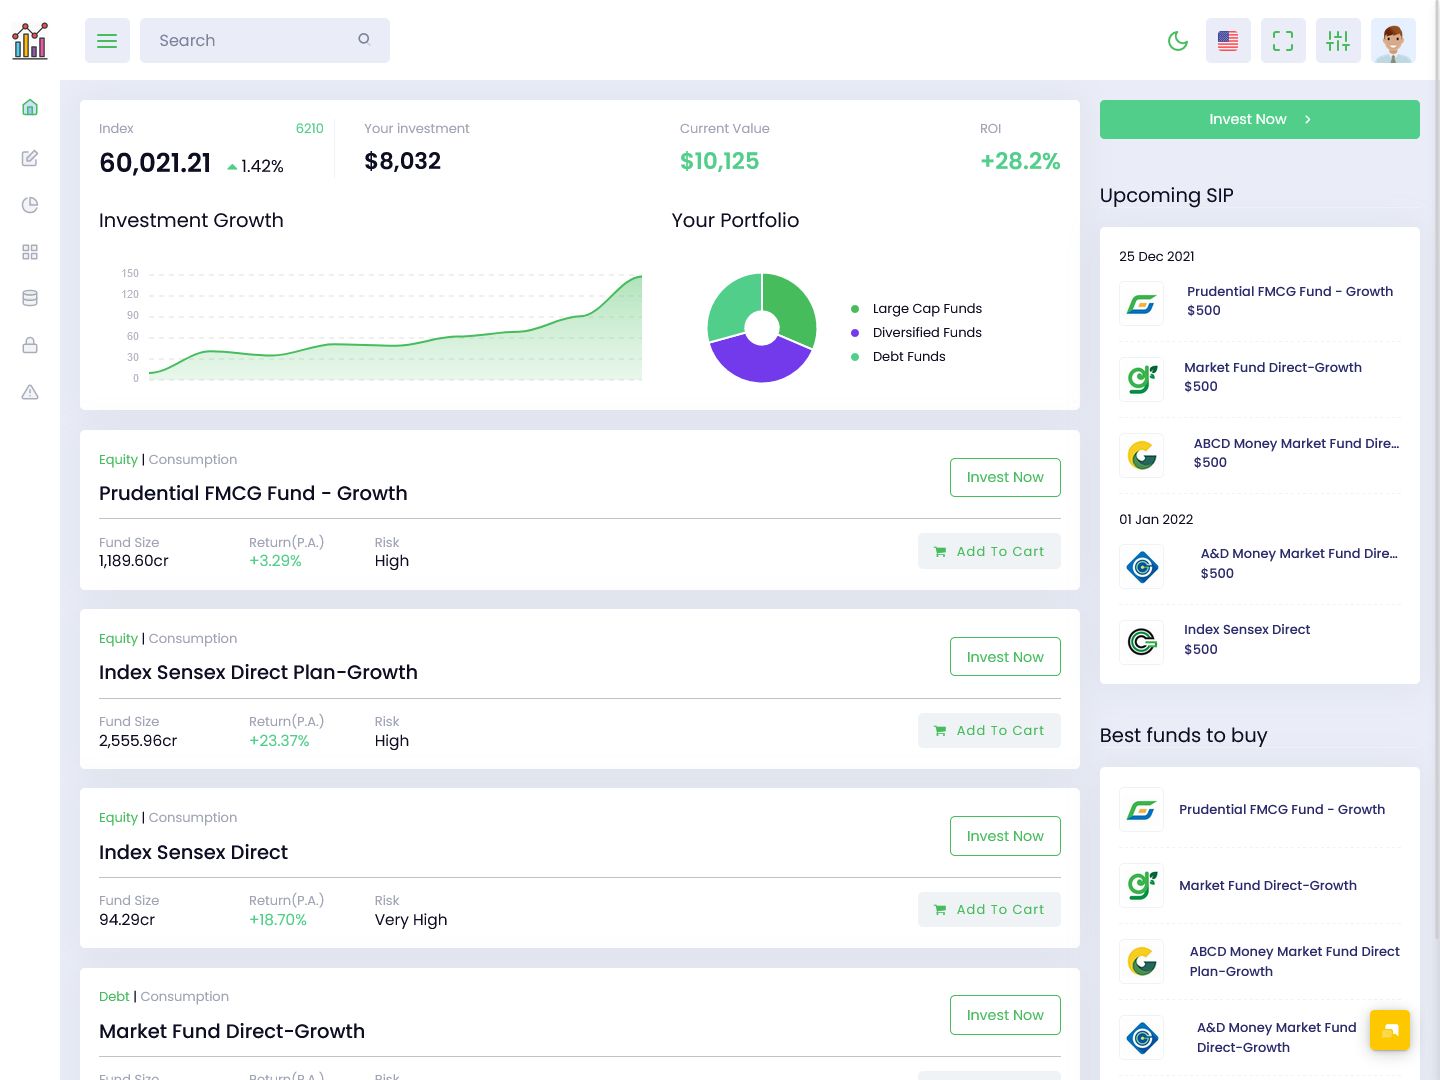
Admin Dashboard 2
MORE INFO / BUY NOW DEMO
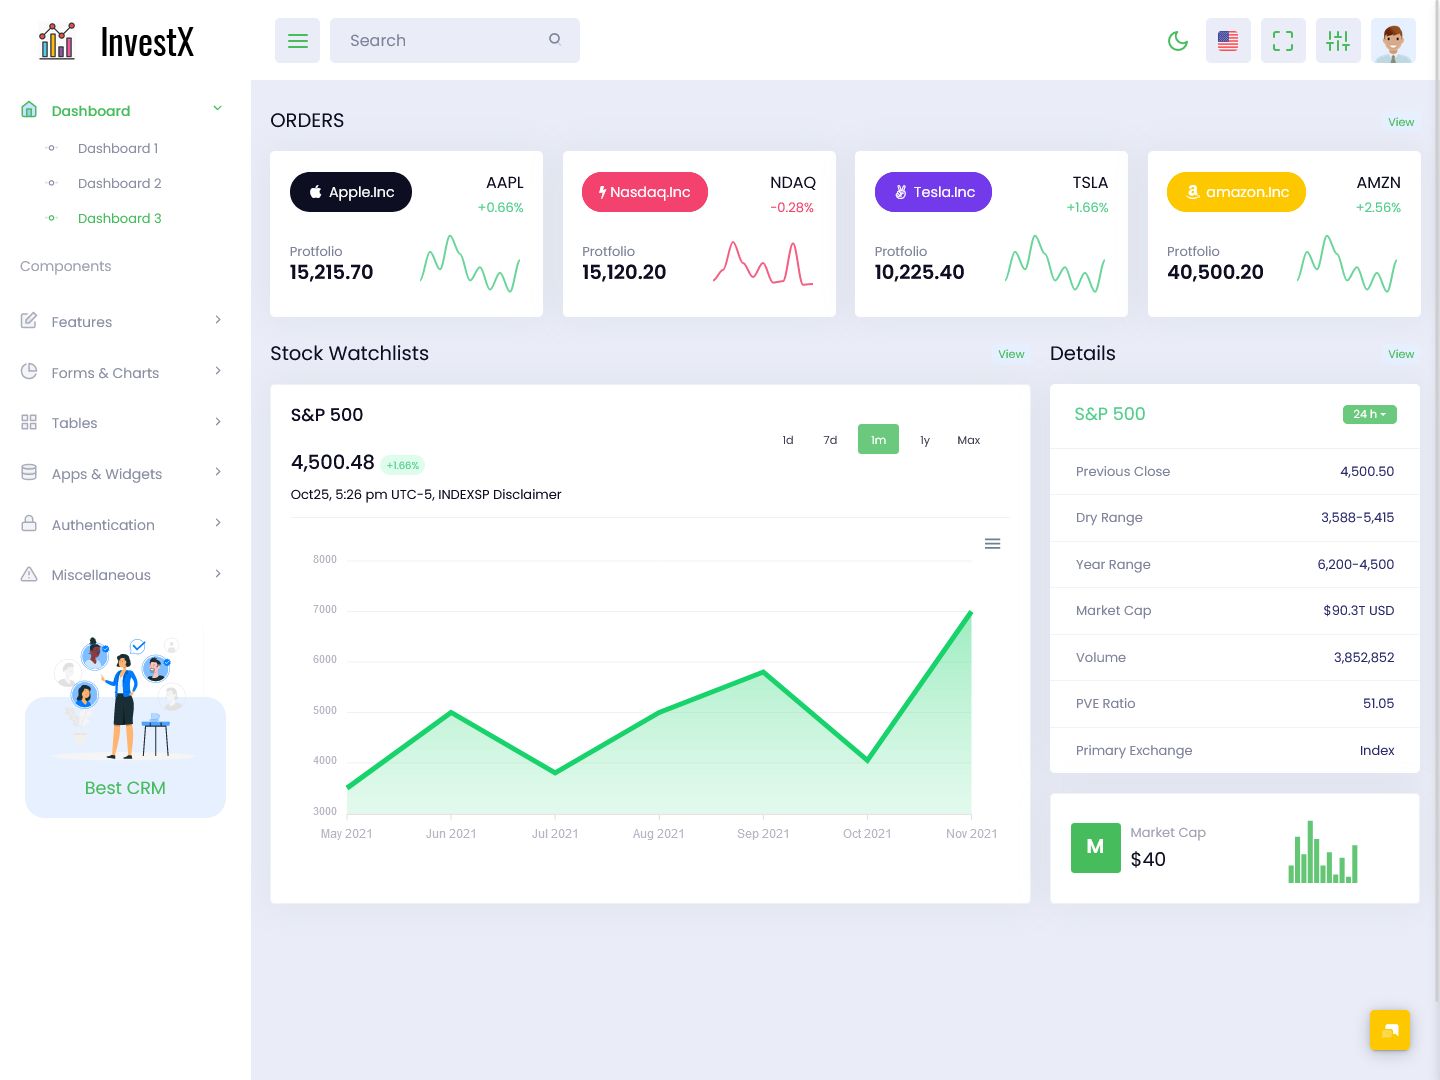
Admin Dashboard 3
MORE INFO / BUY NOW DEMO
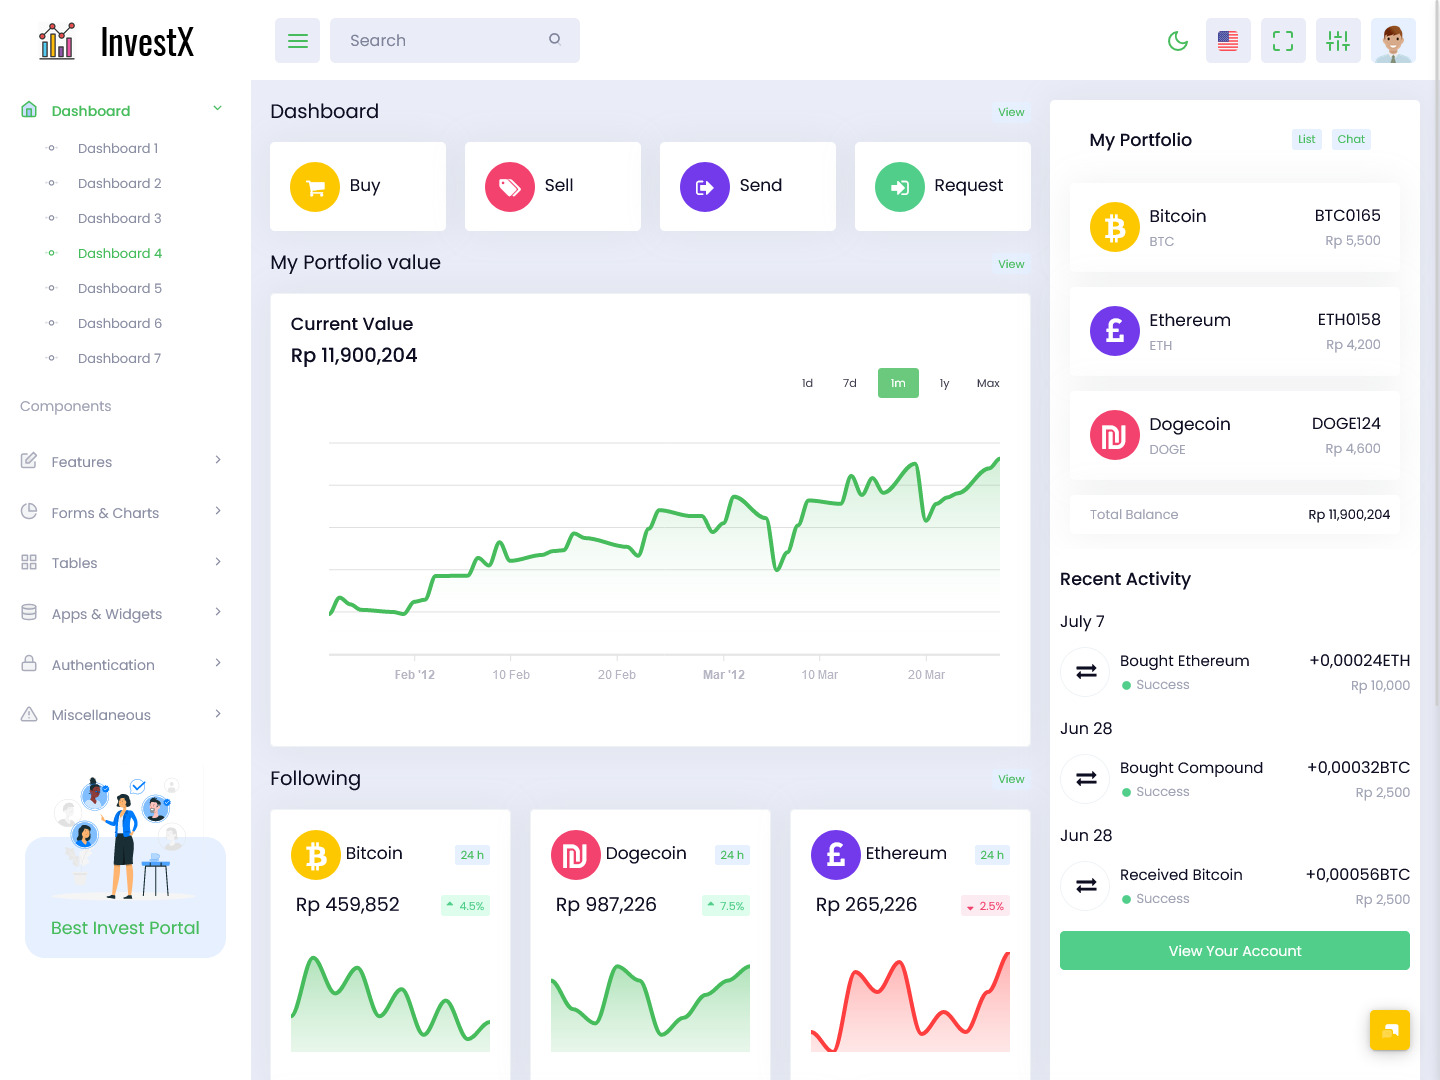
Admin Dashboard 4
MORE INFO / BUY NOW DEMO
Admin Dashboard 5
MORE INFO / BUY NOW DEMO
Admin Dashboard 6
MORE INFO / BUY NOW DEMO
Admin Dashboard 7
MORE INFO / BUY NOW DEMO
Dark Dashboard
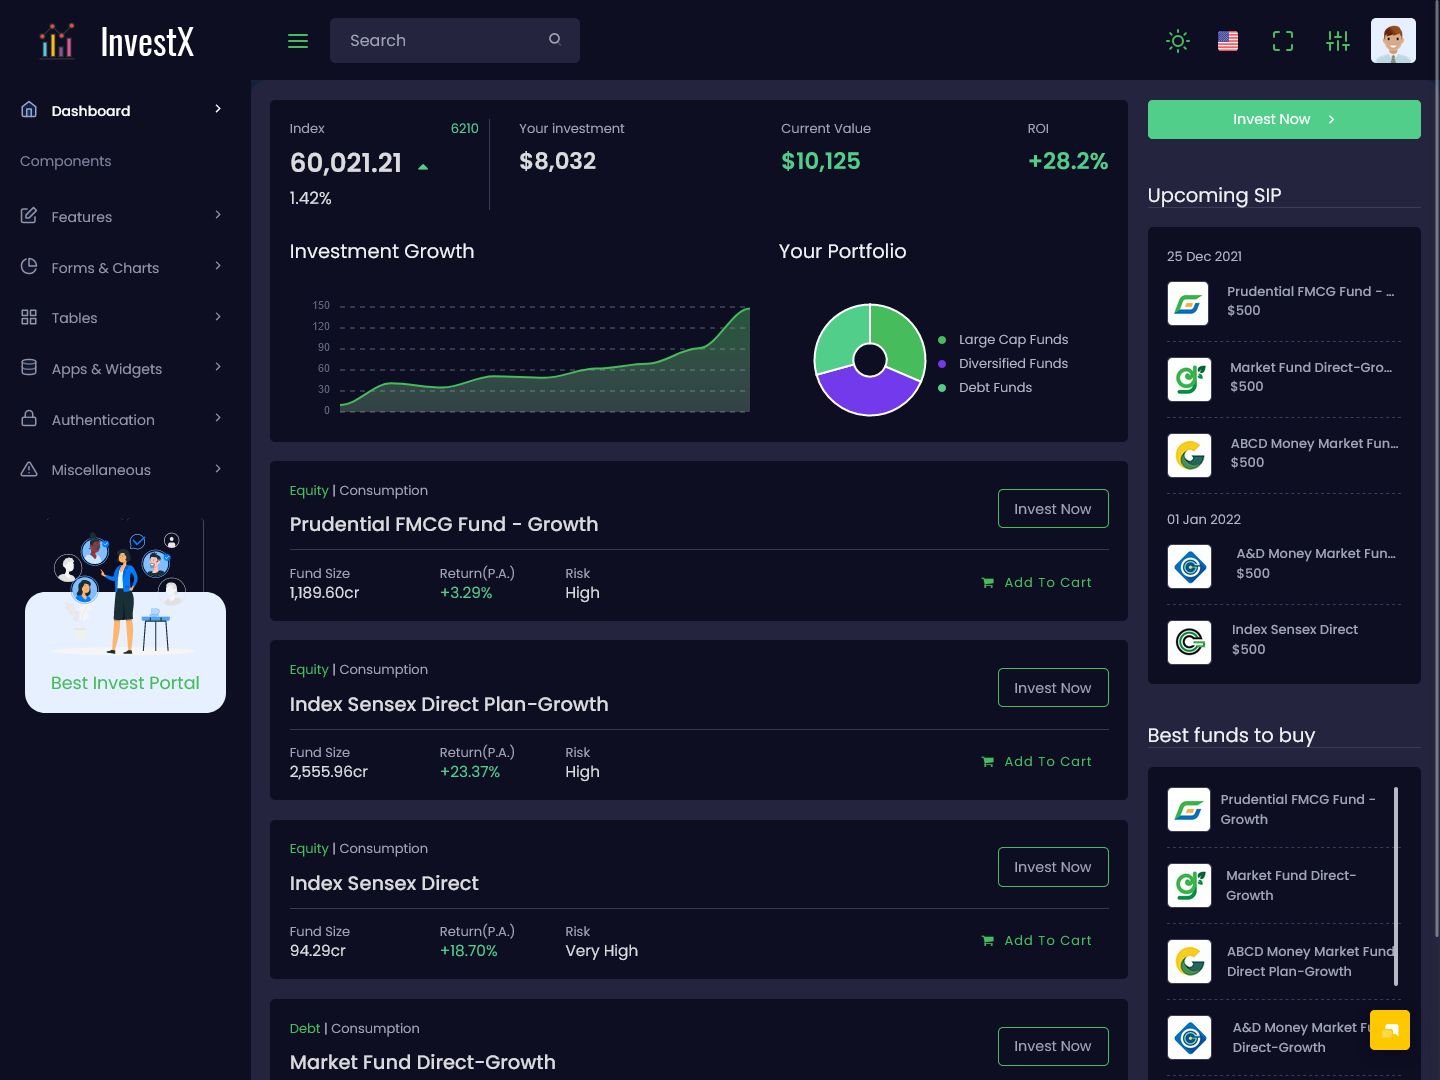
MORE INFO / BUY NOW DEMO
Mini Sidebar Dashboard
MORE INFO / BUY NOW DEMO
Dark Mini Sidebar Dashboard
MORE INFO / BUY NOW DEMO
Horizontal Dashboard
MORE INFO / BUY NOW DEMO
Uses of Investment Portfolio Admin Dashboard:
The Investment Dashboard has many uses. The main use is that it streamlines the reporting process. Thus, it becomes easy for viewers to read the report. Apart from it, it also provides entrepreneurs investment status, reminders and simple report creation wizard. A Admin Dashboard Template report can contain many things. Like it may include a wide range of business-critical information about the investment activity and portfolio management. For instance, there can be such indicators as such indicators as ROI, assets coverage ratio, capital enhancement, income, expenses, risk tolerance, and others.
Main Users of Investment Portfolio Admin Dashboard:
The main users of this type of Bootstrap 5 Admin Dashboard are generally from the financial fields. Among them, Brokers and Advisors are the core ones. Dashboards help them to monitor and measure investment portfolio performance. It increases the accuracy of data, which in result, results in better performance for clients.
Tools provide by Investment Portfolio Admin Dashboard:
There are generally five major tools provided by the Investment Portfolio Admin Dashboard. They are OLAP Pivots, Scorecards, Investment Maps, Financial Reports and What If Scenarios. Now let’s discuss each tool in detail.
1) OLAP Pivots : Broadly, this Bootstrap Templates term refers to a new view of data available within a Slice of a multidimensional OLAP Cube. For an instance: a financial analyst might want to view or “pivot” data in various ways, such as displaying all the cities down the page and all the products across a page. It could be of any time period, version or any type of expenditure. He will be able to look at it. Cube also provides study data in different ways. One has the flexibility to mould it and read the data accordingly. This gives analysts a bird eye view of the reports, which ultimately helps him in taking an efficient decision. OLAP Cube also saves lots of time for analysts. Rather than studying individual topic separators, all topics can be studied together with the help of this Cube.
2) Scorecards : Scorecards help an individual to track its performance. A performance scorecard is a graphical representation of the progress over time of some entity, such as an enterprise, an employee or a business unit, toward some specified goal or goals. Performance scorecards are widely used in many industries throughout both the public and private sectors.
3) Investment Map : It is mainly used for the collection of investment data. It collects the overall FDI Statistics for more than 200 Countries. Along with it, it also provides detailed FDI sectoral country breakdown for about 115 Countries. The investment Bootstrap Admin Web App map also helps the Investment Promotion Agencies to identify the various opportunities. It helps in prioritizing the investment opportunities among various countries and investors. Moreover, it also opens doors for the companies to find the suitable country for investment.
4) Financial Reports : A Finance Report Responsive Admin Dashboard Template is one of the important dashboards. It helps in keeping track of all important finances such as tracking finance KPIs, effective cash management, keeping track of all the expenses, sales and profit in detail. This all helps the company to track in detail its finances and also provide necessary points which are helpful in elevating the existing level.
5) What If scenarios : What-if analysis is the process of mathematically predicting how an organization will be affected given a predefined situation.
For now, I hope that the above information is helpful to you. I will take a leave now. For more details regarding Investment Portfolio Admin Dashboard, stay tuned and don’t forget to follow us!
Related Posts


This Post Has 0 Comments