
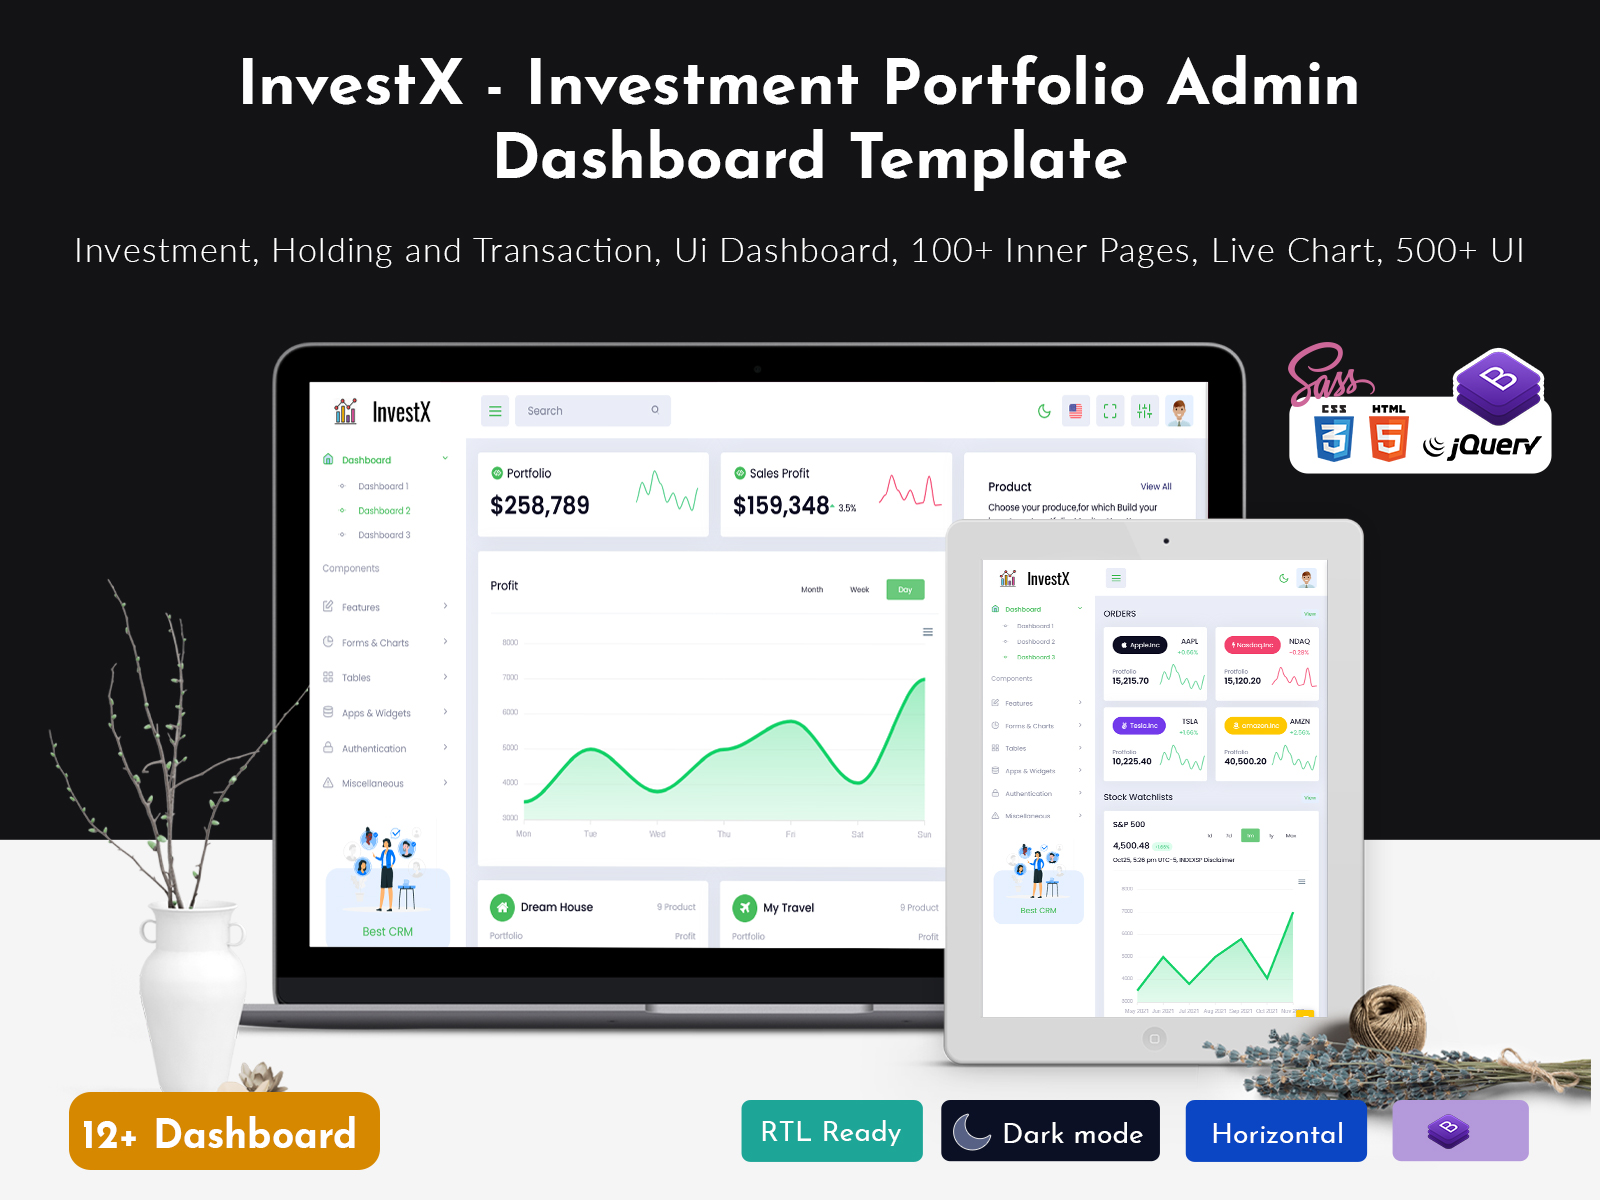
Managing investments in today’s fast-changing financial world requires more than just basic tools. A modern…
Investment Dashboard for Portfolio & Market Tracking
Reading Time: 2 minutes
At the top of this blog, you can watch a complete Investment Dashboard demo video. The video shows how investment data is displayed, how portfolios are tracked, and how users can monitor market performance in real time. Watching the video first helps visitors quickly understand the dashboard layout and features before reading the detailed explanation below.
This video-first approach improves engagement and makes financial data easier to understand.
Watch Full Video
📝 What Is an Investment Dashboard?
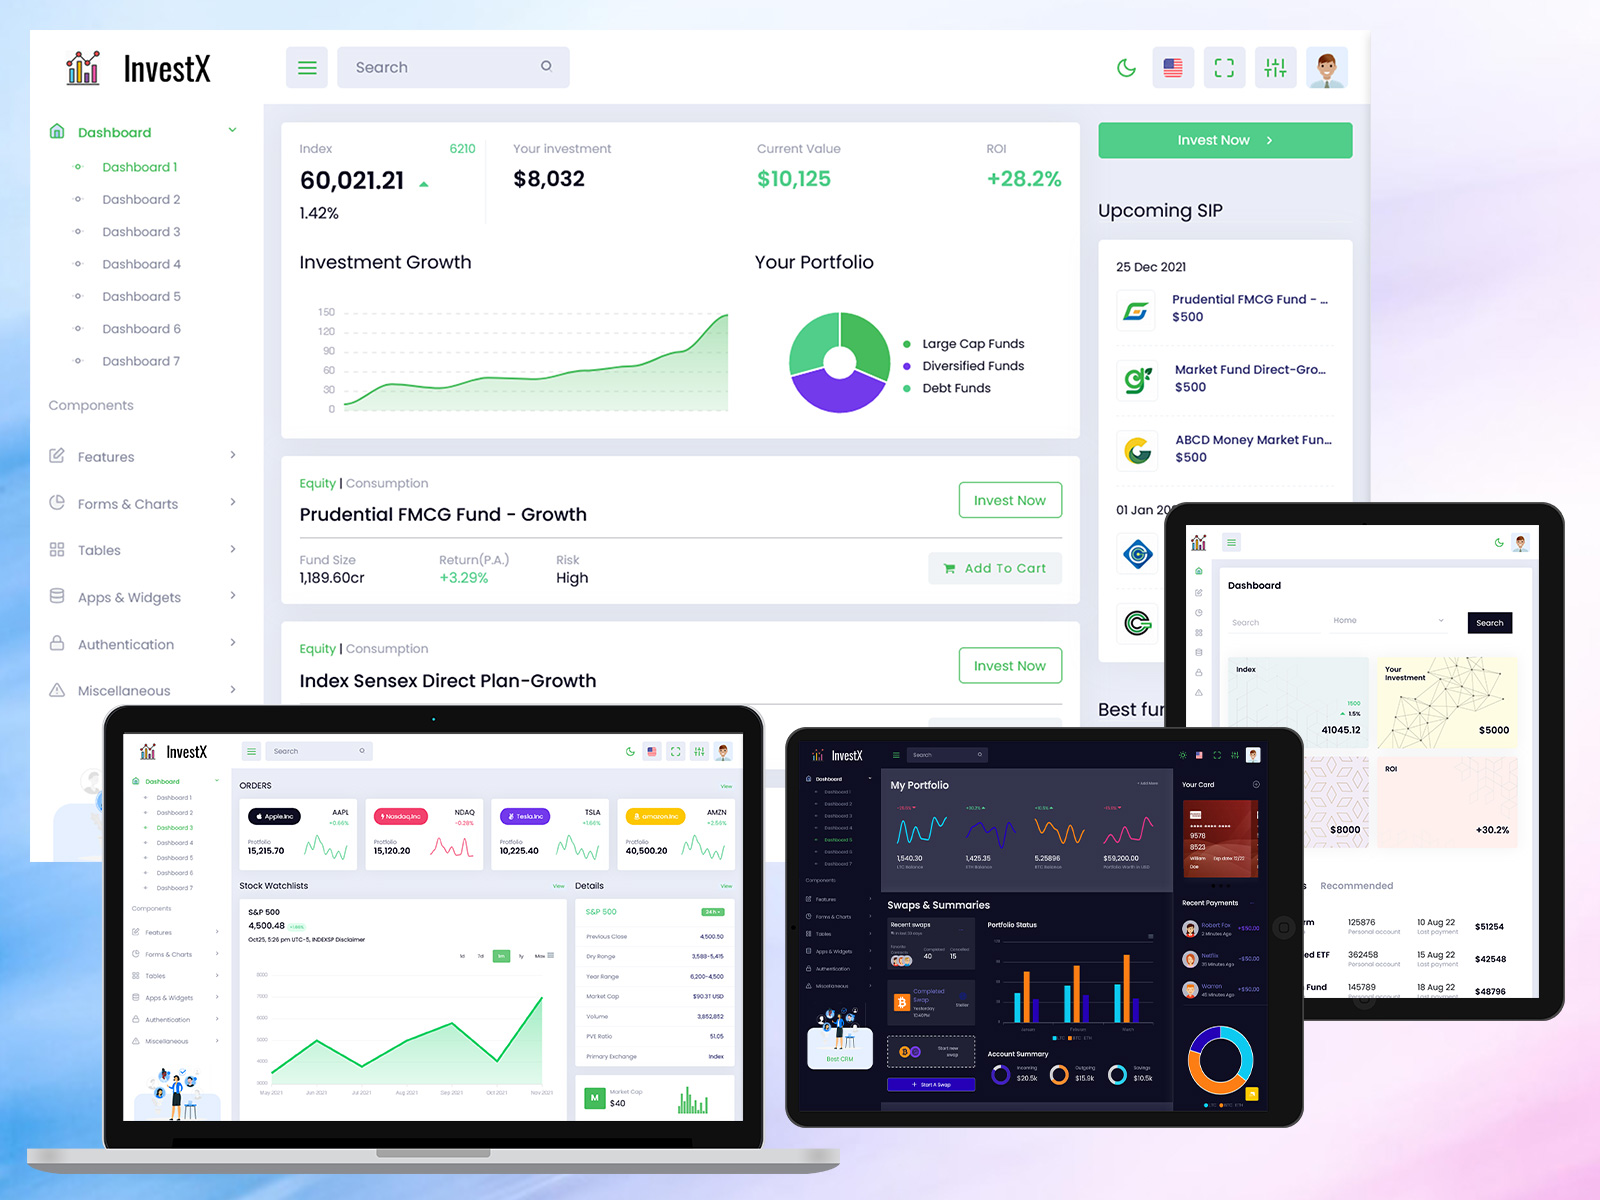
An Stock market dashboard is an admin panel designed to track, analyze, and manage different types of investments from one place. It gives users a clear overview of their financial performance, including stocks, mutual funds, and overall portfolio value.
This dashboard often combines features of a Stock Market Dashboard, Mutual Fund Dashboard, and Portfolio Dashboard into a single interface. It helps investors and businesses make informed decisions using real-time data, charts, and reports.
The Investment Dashboard is usually built using modern technologies like HTML, CSS, JavaScript, Bootstrap, React, or data visualization tools. Its main goal is to convert complex financial numbers into simple and meaningful insights.
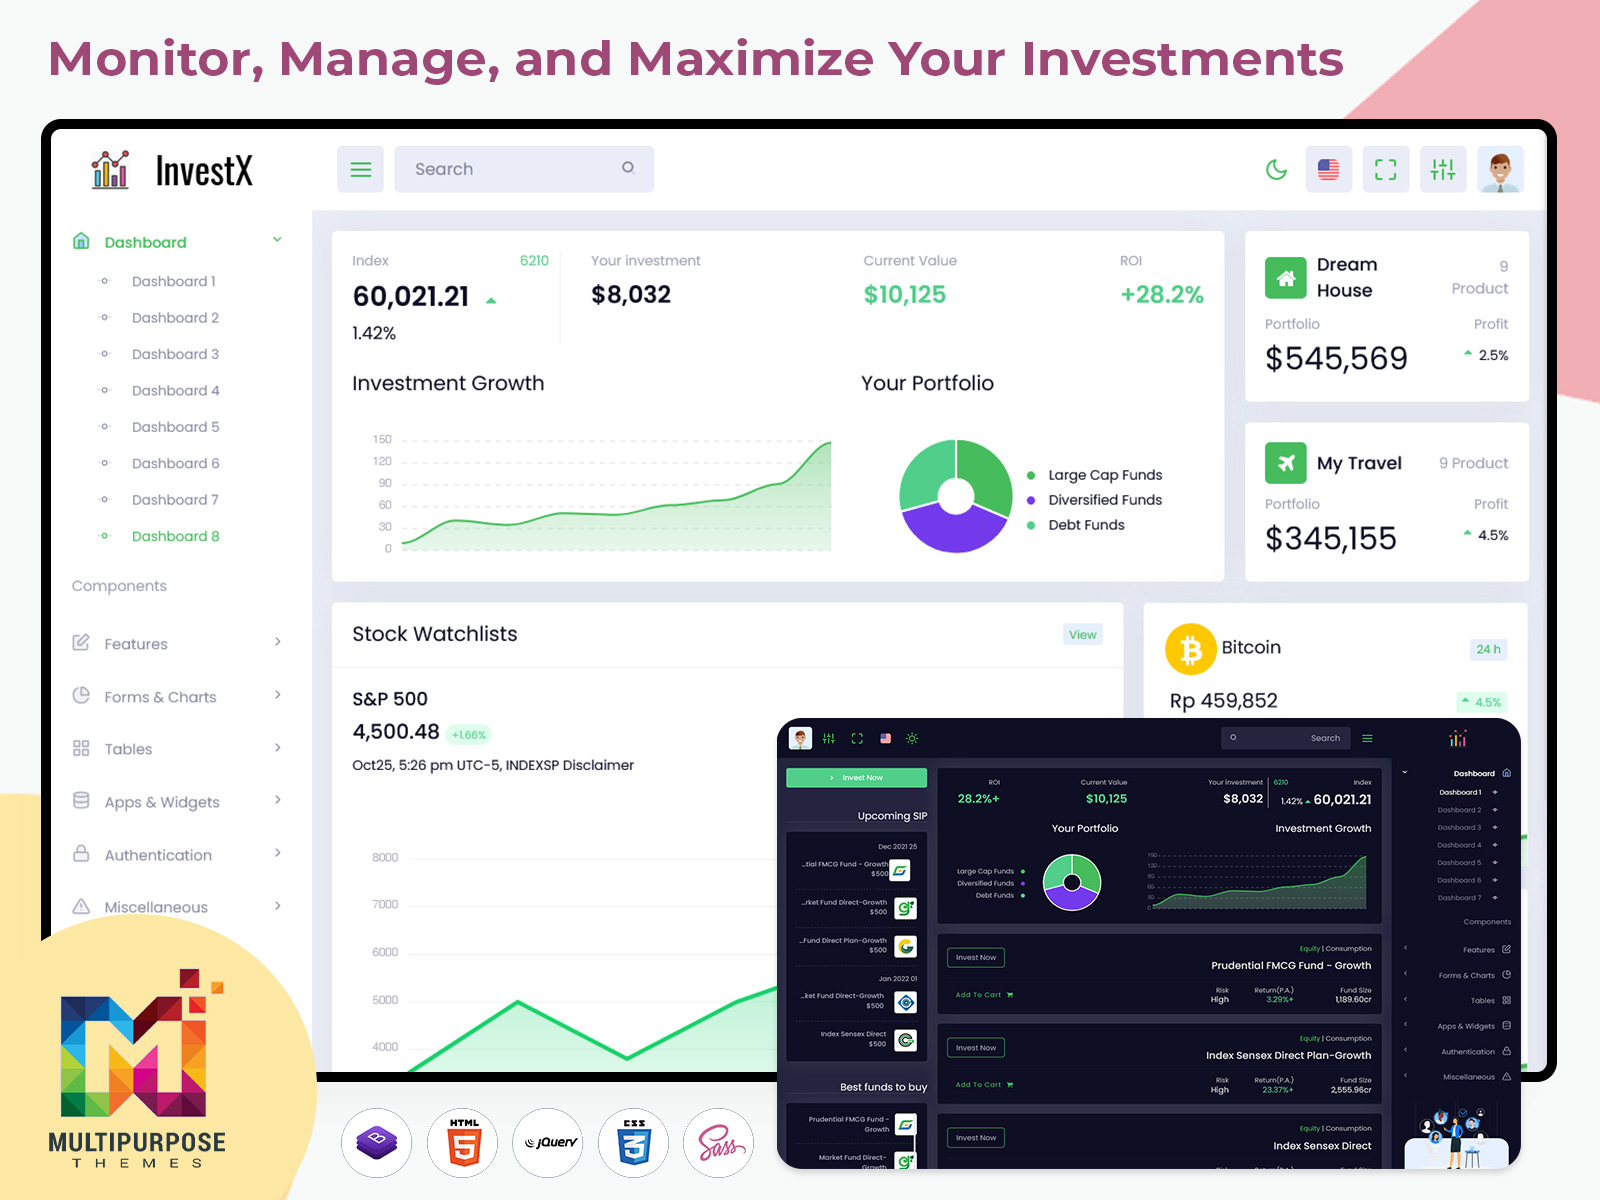
⭐ Key Features of Investment Dashboard
Portfolio Dashboard – View total investment value, gains, and losses
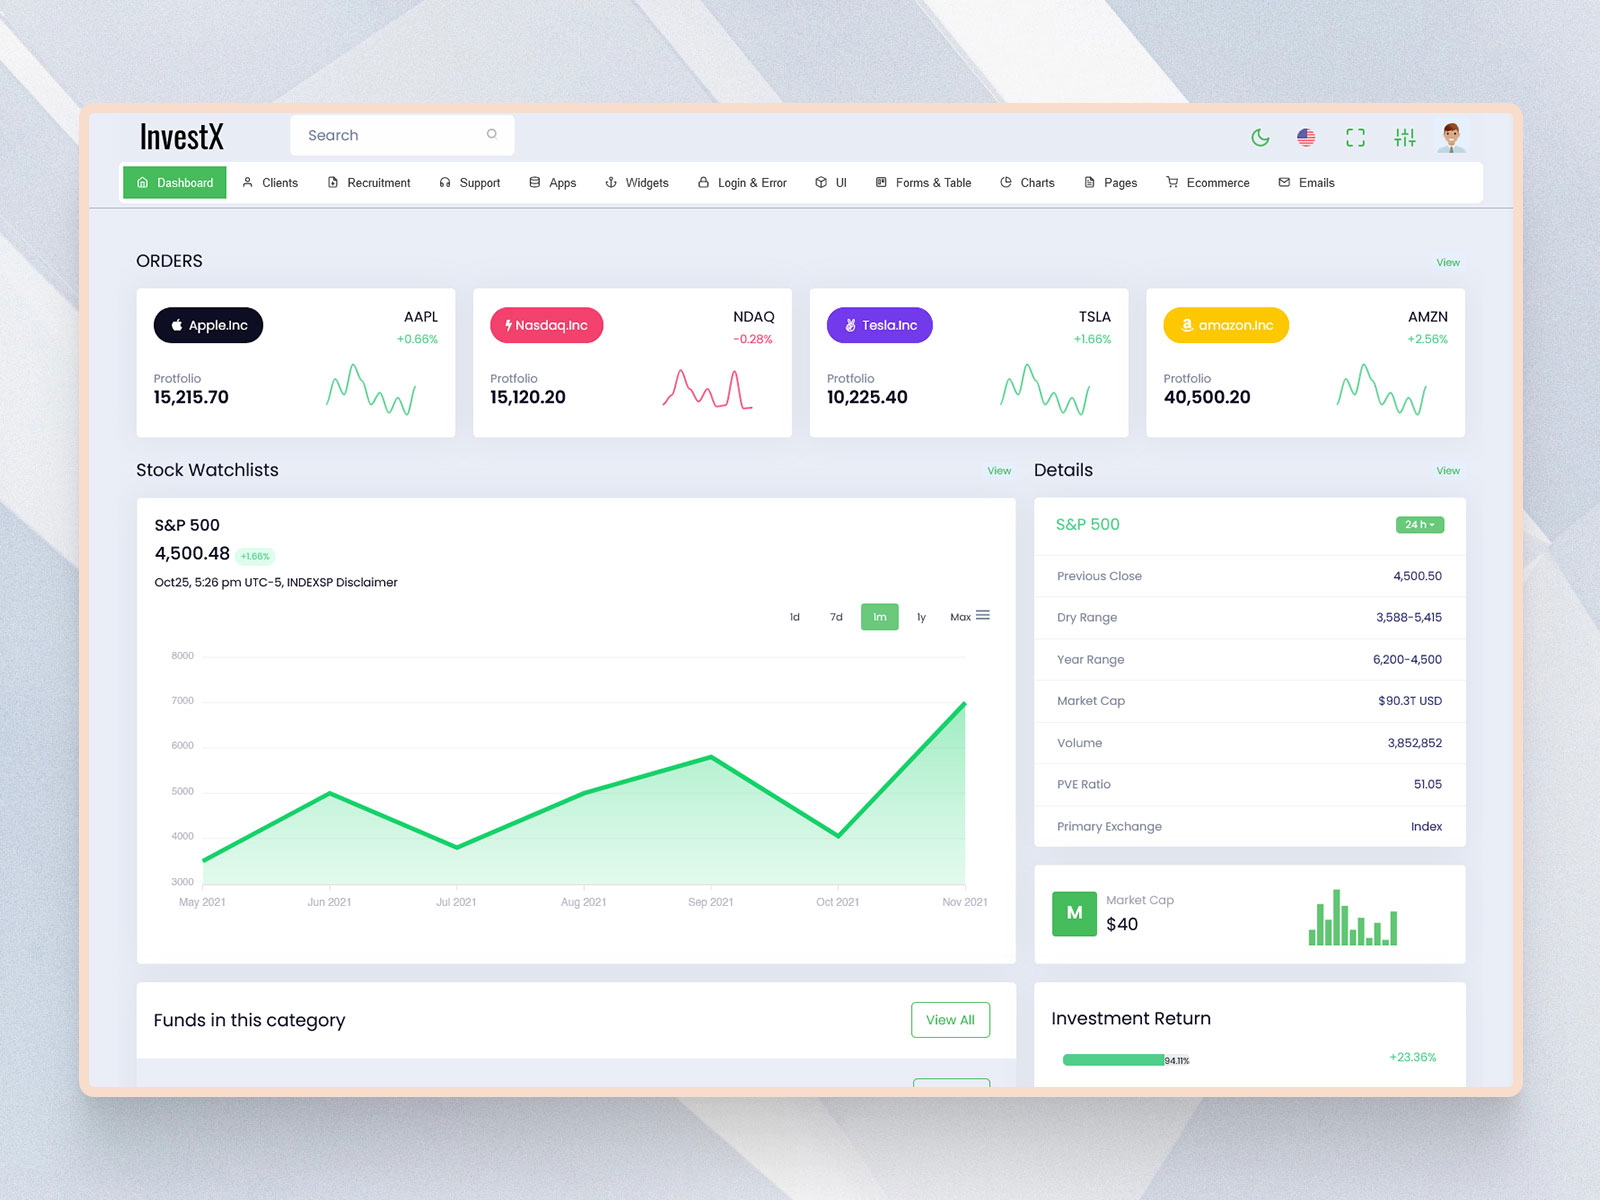
Stock Market Dashboard – Track live stock prices, trends, and performance
Mutual Fund Dashboard – Monitor fund returns, NAVs, and asset allocation
Performance Charts & Graphs – Visual insights into market and portfolio data
Real-Time Data Updates – Stay updated with live market movements
Admin Dashboard Controls – Manage users, portfolios, and reports
Responsive Design – Works smoothly on desktop, tablet, and mobile devices
Custom Filters & Reports – Analyze data by time period, asset type, or category
These features help users track investments clearly and confidently.
💡 Use Cases of Investment Dashboard
An Stock market dashboard can be used in many practical scenarios:
Individual Investors – Track stocks, mutual funds, and portfolio performance
Stock Market Platforms – Display market analytics and investment data
Wealth Management Firms – Manage multiple client portfolios
Mutual Fund Companies – Show fund performance and reports
FinTech Startups – Build investment and analytics platforms
SaaS Products – Offer investment insights through admin dashboards
Using a combined Portfolio Dashboard helps users monitor all investments from one place.
👥 Who Should Use This Dashboard?
This Investment Dashboard is ideal for:
Investors managing stocks and mutual funds
Financial Advisors tracking client portfolios
Developers building finance or investment platforms
Startups launching FinTech products
Agencies & Freelancers creating investment dashboards for clients
Product Owners managing financial analytics tools
If your product deals with financial data or investment tracking, this dashboard is a strong solution.
🎯 Why Video-First Content Works for Investment Dashboards
Watchlist dashboards are data-heavy and highly visual. A video demo helps users quickly understand charts, performance indicators, and portfolio breakdowns without confusion.
This approach helps with:
Better SEO performance
Higher user engagement
Increased YouTube watch time
More trust and credibility
Showing a Stock Market Dashboard and Mutual Fund Dashboard in action builds confidence among users and investors.
👉 Call to Action (CTA)
Watch the full Investment Dashboard demo and subscribe to our YouTube channel for more Stock Market Dashboard, Portfolio Dashboard, and admin template videos.
Related Posts


This Post Has 0 Comments