
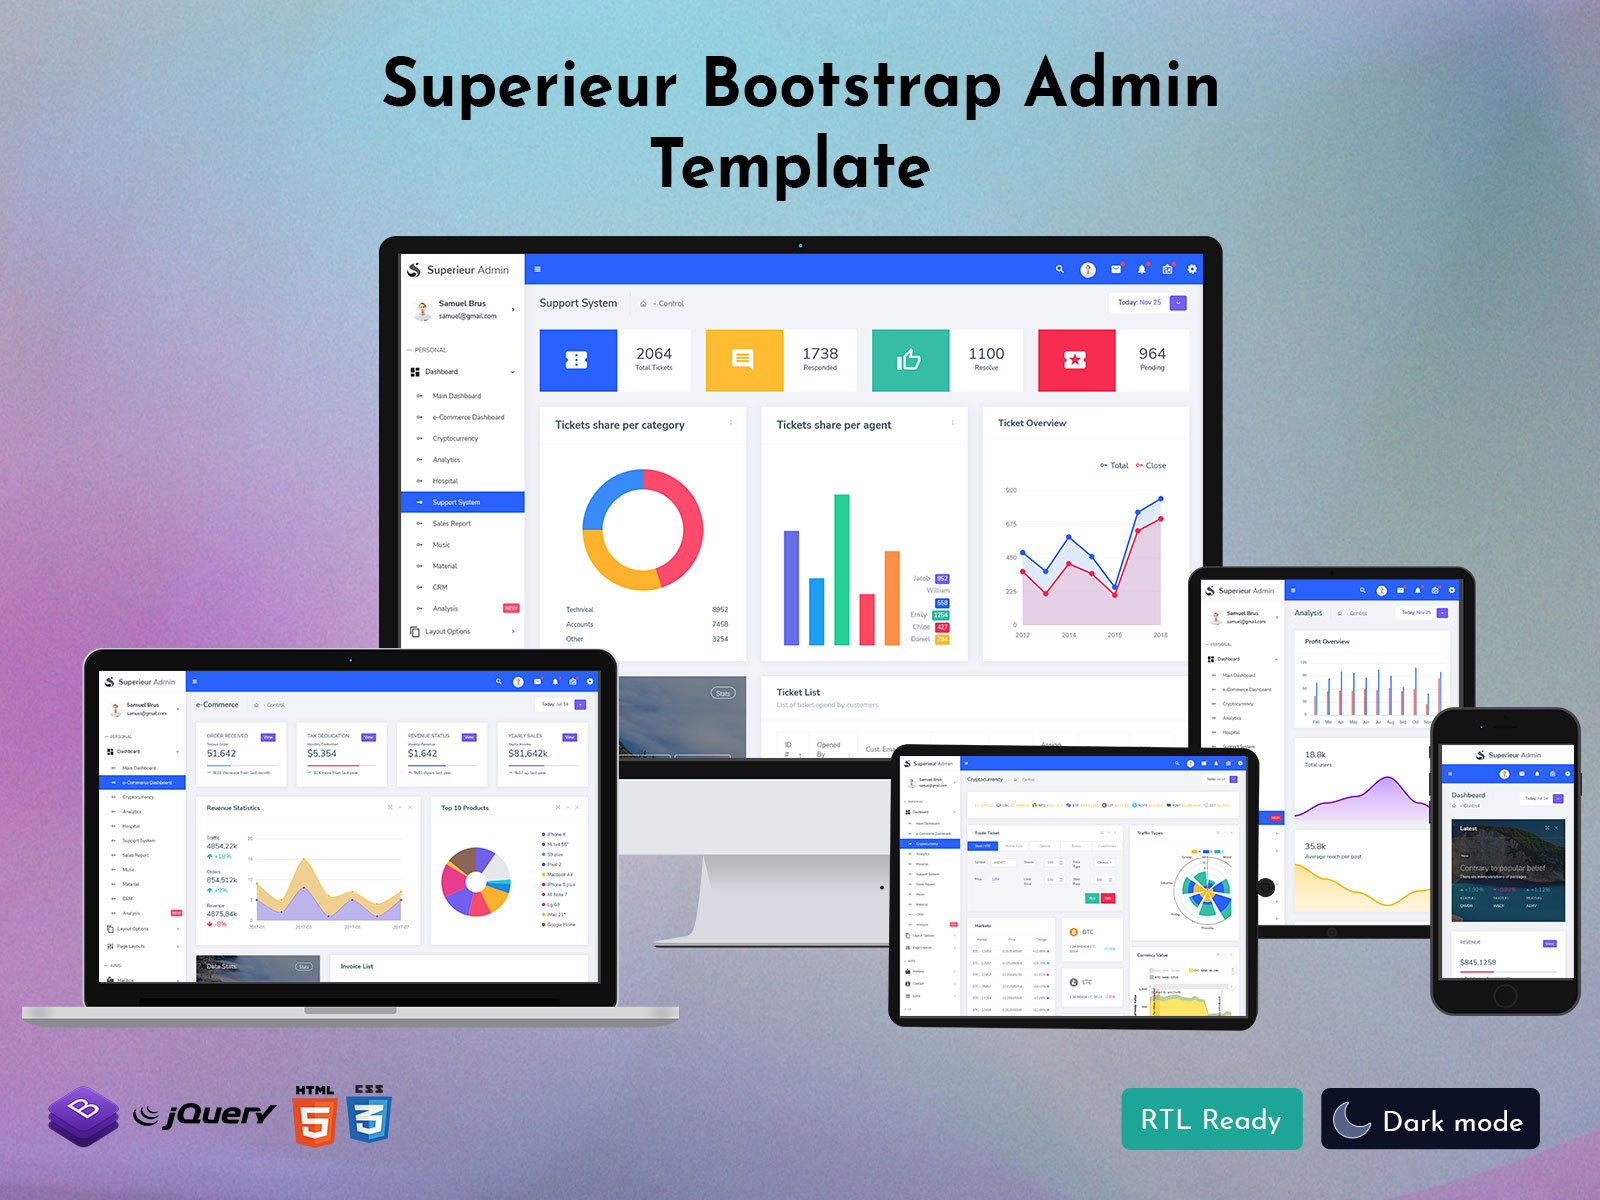
A Bootstrap Admin Panel is a ready-made user interface framework designed to help developers create…

UI Dashboard – Empowering Businesses with Live Data Insights
Reading Time: 6 minutes
Introduction: What is a UI Dashboard?
Companies rely on data to make informed decisions, optimize performance, and stay competitive. One of the most efficient tools for organizing and visualizing this data is a UI Dashboard. But what exactly is a UI Dashboard? A UI Dashboard (User Interface Dashboard) is a visual tool that aggregates and displays key business data in an easily accessible format.
It allows users to monitor, analyze, and interact with various data points from different departments—such as sales, marketing, production, and customer service—within a single interface. The goal of a Dashboard UI is to provide real-time insights into business operations, enabling teams to make data-driven decisions quickly and efficiently.
Whether you’re a business owner, manager, or part of a larger team, a UI Dashboard provides a central hub for all key metrics, saving you time and improving your ability to react to changes in your business environment.
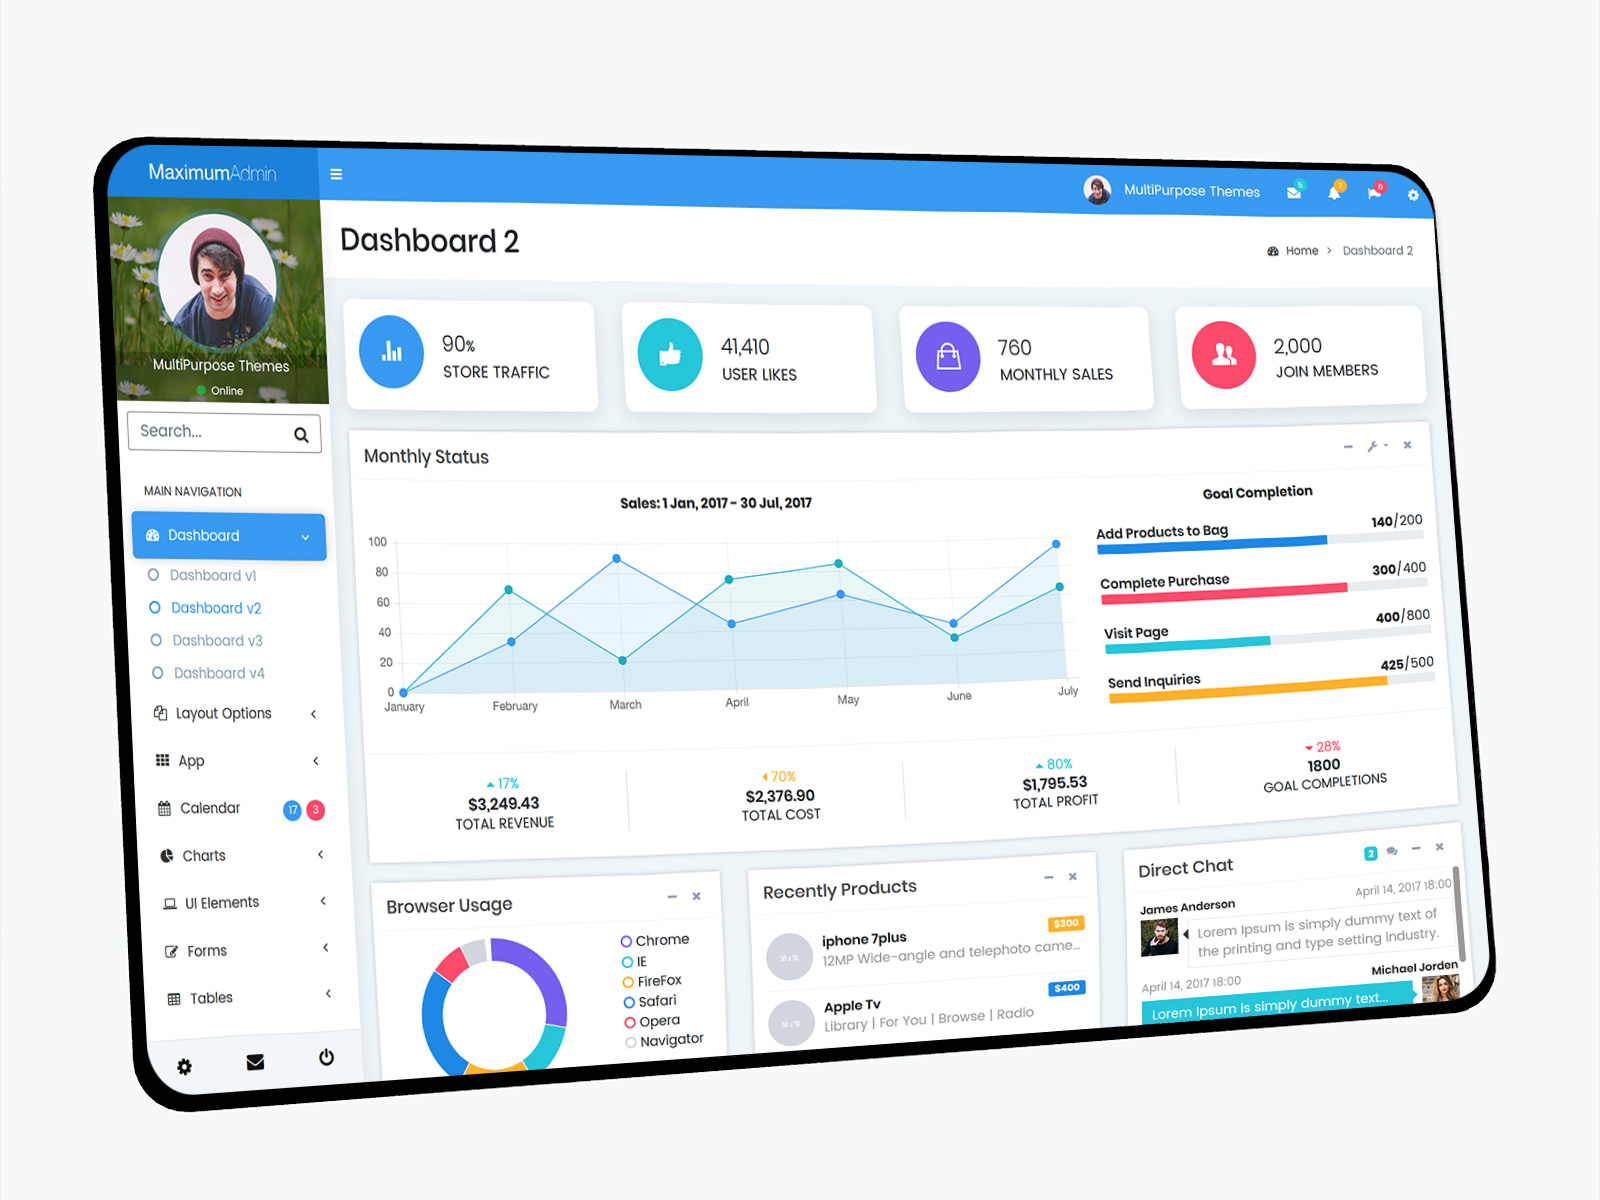
Dashboards of Maximum Admin
Light Dashboard

MORE INFO / BUY NOW DEMO
Dark Dashboard

MORE INFO / BUY NOW DEMO
Key Components of a UI Dashboard
UI Dashboards are designed to display various metrics that matter the most to the business. From Sales Overview to Monthly Visits, a good UI Dashboard presents these metrics clearly and concisely. Here’s a breakdown of the key sections often included in a Master Dashboard or Admin Dashboard UI:
1. Sales
The Sales section is a core feature of any UI Dashboard. It provides a snapshot of the business’s sales performance, tracking revenue over time, identifying the best-selling products, and comparing sales across different regions or sales teams. Visualizations such as bar charts, line graphs, and pie charts make it easy to track how sales are performing against goals and historical data.
2. Purchase
The Purchase section tracks purchasing activities, inventory management, and supplier relations. It displays data on the volume of products purchased, purchase costs, and trends over time. This helps businesses manage their supply chains, ensuring that they maintain sufficient stock levels without over-purchasing.
3. Return
Returns can have a significant impact on a business’s profitability, so tracking them is crucial. The Return section of the UI Dashboard shows data on return rates, reasons for returns, and how these returns affect overall sales. This helps businesses identify product issues and customer satisfaction levels, enabling them to improve their offerings.
4. Marketing
The Marketing section of the UI Dashboard helps businesses track the effectiveness of their marketing campaigns. Whether it’s social media engagement, email campaigns, or digital ads, this section displays metrics like conversion rates, click-through rates, and customer acquisition costs. Marketers can adjust their strategies based on the insights provided by these analytics.
5. Order Summary
The Order Summary provides an overview of all orders placed, including order status, shipping information, and payment status. This section can help teams manage fulfillment processes by offering a quick view of pending and completed orders, along with customer data.
6. Sales Overview
In addition to the detailed Sales section, the Sales Overview gives a high-level view of sales trends. This includes total sales, sales by region, best-selling products, and sales projections. The Sales Overview section helps managers identify patterns and forecast future sales more accurately.
7. Revenue
Tracking Revenue is essential to understanding a company’s financial health. The Revenue section of the Master Dashboard shows revenue trends, revenue per product line, and profitability across different business units. By analyzing revenue data, businesses can optimize pricing strategies, improve margins, and adjust their offerings based on customer preferences.
8. Recent Stats
The Recent Stats section gives a snapshot of the latest data across multiple business areas. This might include recent sales transactions, website traffic, new customer sign-ups, or recent marketing activities. Recent Stats provide an instant overview of what’s happening in real-time.
9. Production This Year
For manufacturing or production-based businesses, tracking Production This Year is crucial for planning and optimization. This section displays the total production output for the current year, production trends, and comparisons to previous years. It can also help identify bottlenecks in the production process and areas for improvement.
10. Commission This Year
Sales teams often rely on commissions as a significant part of their compensation. The Commission This Year section shows how much commission sales representatives have earned based on their sales performance. This can help motivate the sales team and allow managers to track compensation distribution across the team.
11. Overview
The Overview section offers a bird’s eye view of the business, summarizing key performance indicators (KPIs) such as sales, revenue, customer satisfaction, and order completion rates. This overview helps managers quickly identify areas that require attention and understand how well the business is performing across various departments.
12. Trending Items
Understanding what products or services are trending is vital for businesses to adjust their sales and marketing strategies. The Trending Items section tracks the most popular items, highlighting which products are generating the most interest and sales. This section helps businesses optimize inventory and marketing efforts.
13. Monthly Visits
For e-commerce businesses, understanding web traffic is crucial. The Monthly Visits section shows the number of visitors to the website, page views, and user engagement metrics. This information helps businesses assess the success of their digital marketing efforts and make improvements to the website user experience.
Video of Maximum Admin
Why is a UI Dashboard Important?
A UI Dashboard is important because it simplifies decision-making and provides businesses with the tools they need to be proactive. Here’s why investing in a Dashboard UI is critical for your business:
1. Centralized Data
One of the primary advantages of a Master Dashboard or Admin Dashboard UI is that it centralizes all critical business data into a single interface. Whether it’s sales, marketing, or production data, having all the information in one place makes it easier for managers and teams to stay organized and focus on what matters most.
2. Real-Time Insights
A Dashboard UI allows businesses to view real-time data, which is essential for fast-paced environments where timely decisions can make a significant impact. For example, if a marketing campaign is underperforming, managers can quickly identify the issue and make necessary adjustments to improve results.
3. Improved Productivity
With all the data accessible at a glance, employees don’t waste time searching for information. This increases productivity and ensures that teams can focus on strategic tasks rather than administrative work. For instance, with a Bootstrap Admin Panel, sales representatives can focus on closing deals instead of sorting through spreadsheets.
4. Better Decision-Making
With easy access to key metrics like sales figures, revenue, and marketing performance, businesses can make data-driven decisions with confidence. Whether adjusting a marketing strategy or altering sales forecasts, having the right data in real-time helps decision-makers make more informed choices.
5. Enhanced Performance Tracking
A Bootstrap Admin Template or Bootstrap 5 Dashboard Template is designed to track performance across various areas. By monitoring metrics such as monthly visits, trending items, and commissions, businesses can identify what is working and what needs improvement. This enhances performance tracking and fosters a culture of continuous improvement.
6. Customizable and Scalable
A Dashboard Template allows businesses to tailor the layout and design of the dashboard to fit their needs. Additionally, as a company grows, it can scale the dashboard to include more data points, ensuring that it remains useful and relevant over time.
Conclusion: Buy Now and Enhance Your Business
In today’s data-driven world, businesses need to be able to monitor their performance across multiple dimensions and make decisions based on accurate, real-time data. UI Dashboard provide this capability, enabling businesses to keep track of everything from sales performance to website visits and production metrics—all in one place.
With the ability to streamline processes, improve decision-making, and enhance team productivity, investing in a UI Dashboard is crucial for any business looking to stay competitive. Whether you choose a Bootstrap Admin Template, a Bootstrap 5 Dashboard Template, or a fully customizable Admin Template, these tools are designed to help businesses gain a clearer understanding of their operations.
So, if you’re looking to improve business operations and streamline your decision-making, it’s time to buy now and invest in a UI Dashboard solution that will help you take your business to the next level. Your data is your most valuable asset—use it wisely!
Buy Now and Get Started Today!
Click below to purchase and start unlocking the full potential of your business!
BUY NOW
Related Posts


This Post Has 0 Comments