In today’s digital world, every business depends on powerful web applications to manage operations, users,…

Real-Time Patient and Operations Monitoring Medical Dashboard
Reading Time: 6 minutes
A Medical Dashboard is a comprehensive data visualization tool designed to provide real-time insights into various aspects of healthcare and patient management. It allows healthcare professionals, administrators, and decision-makers to monitor, analyze, and act on key metrics, helping to improve patient outcomes, operational efficiency, and resource allocation.
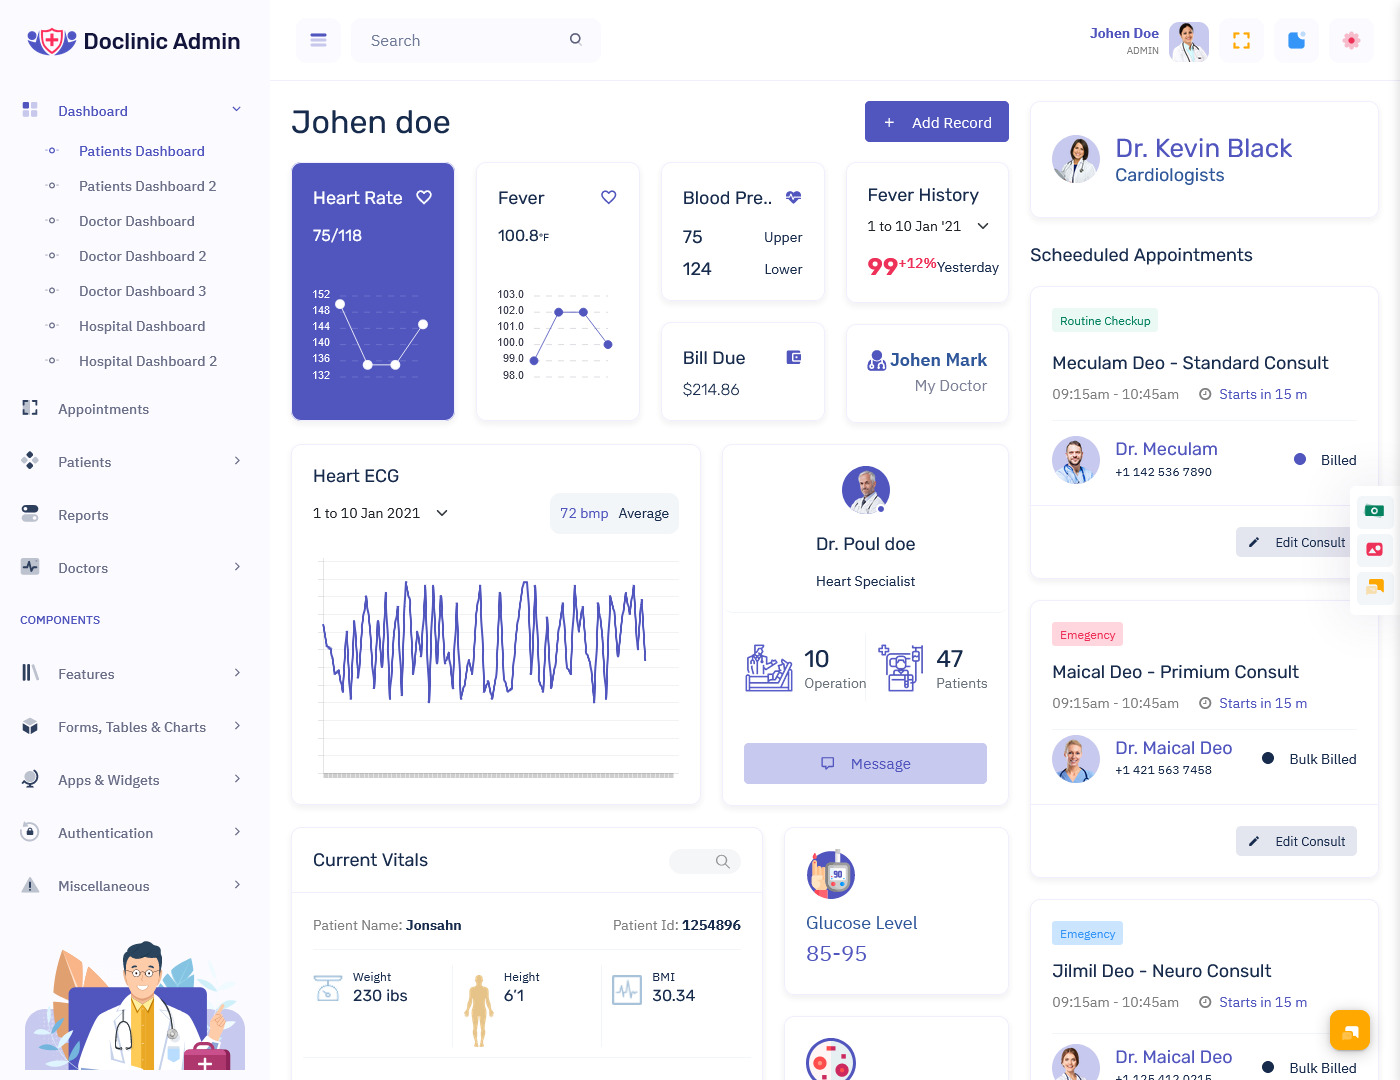
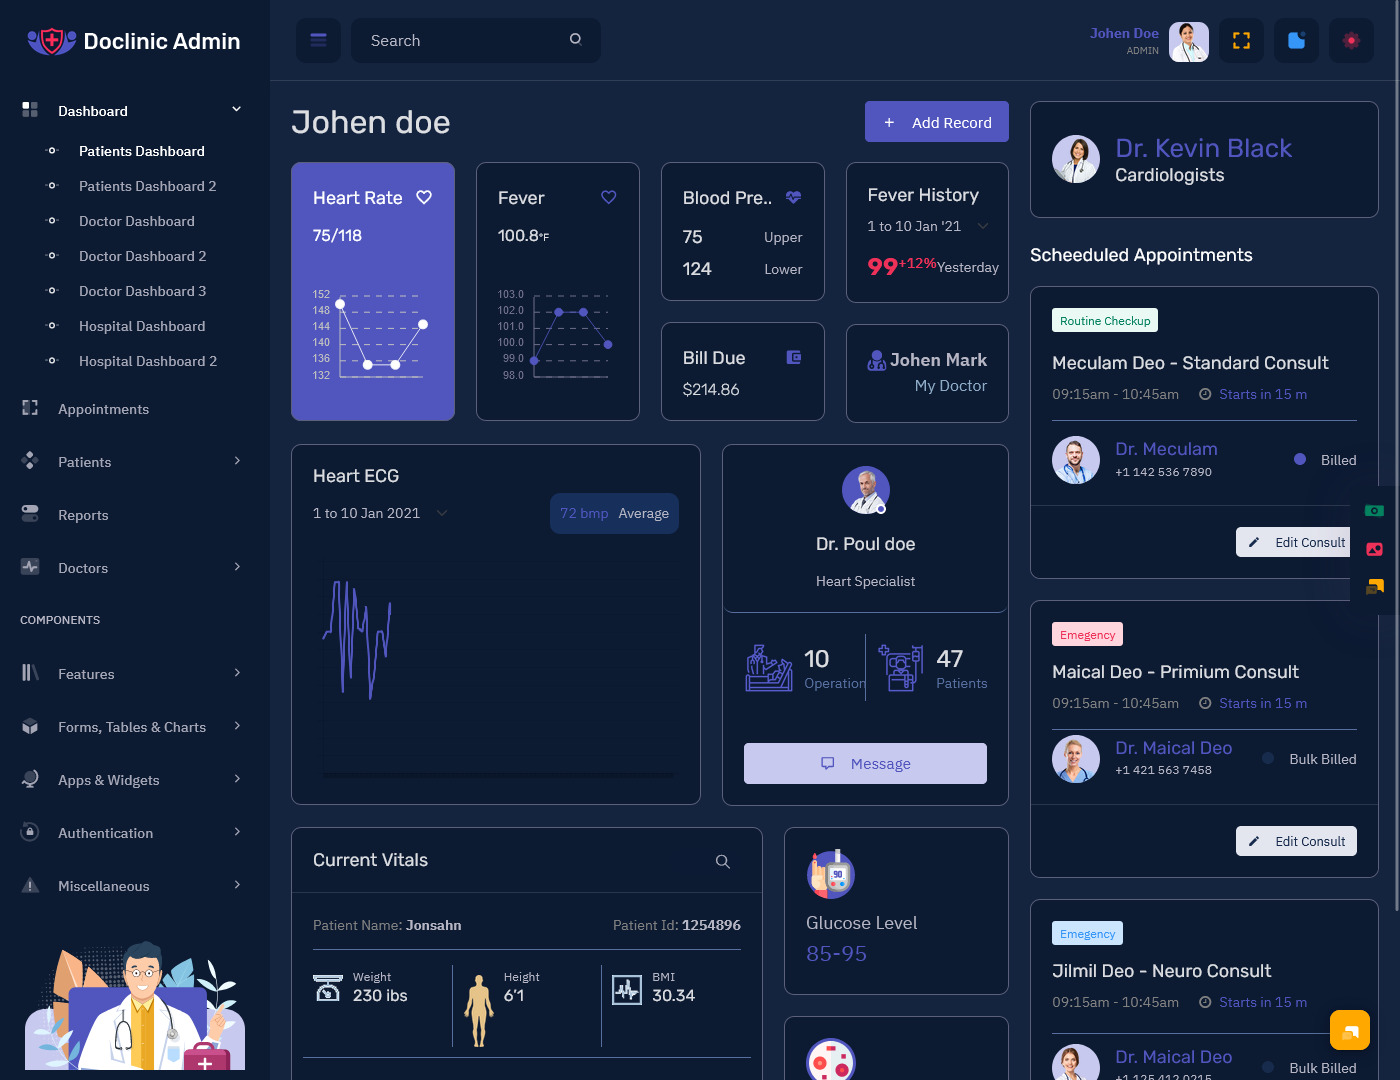
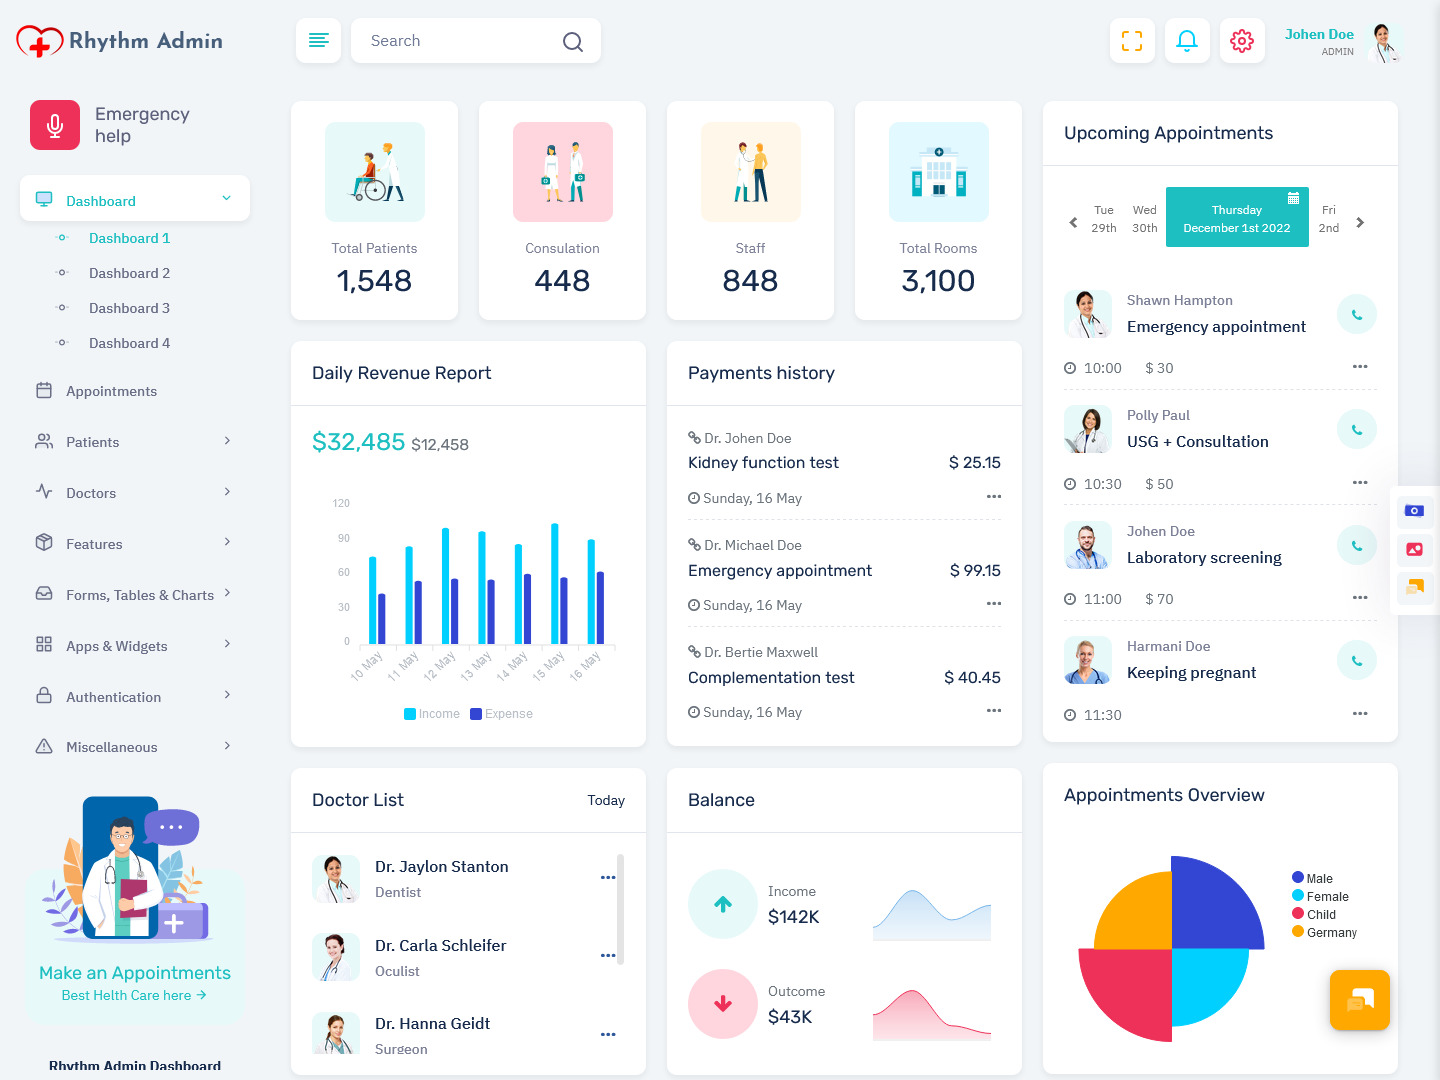
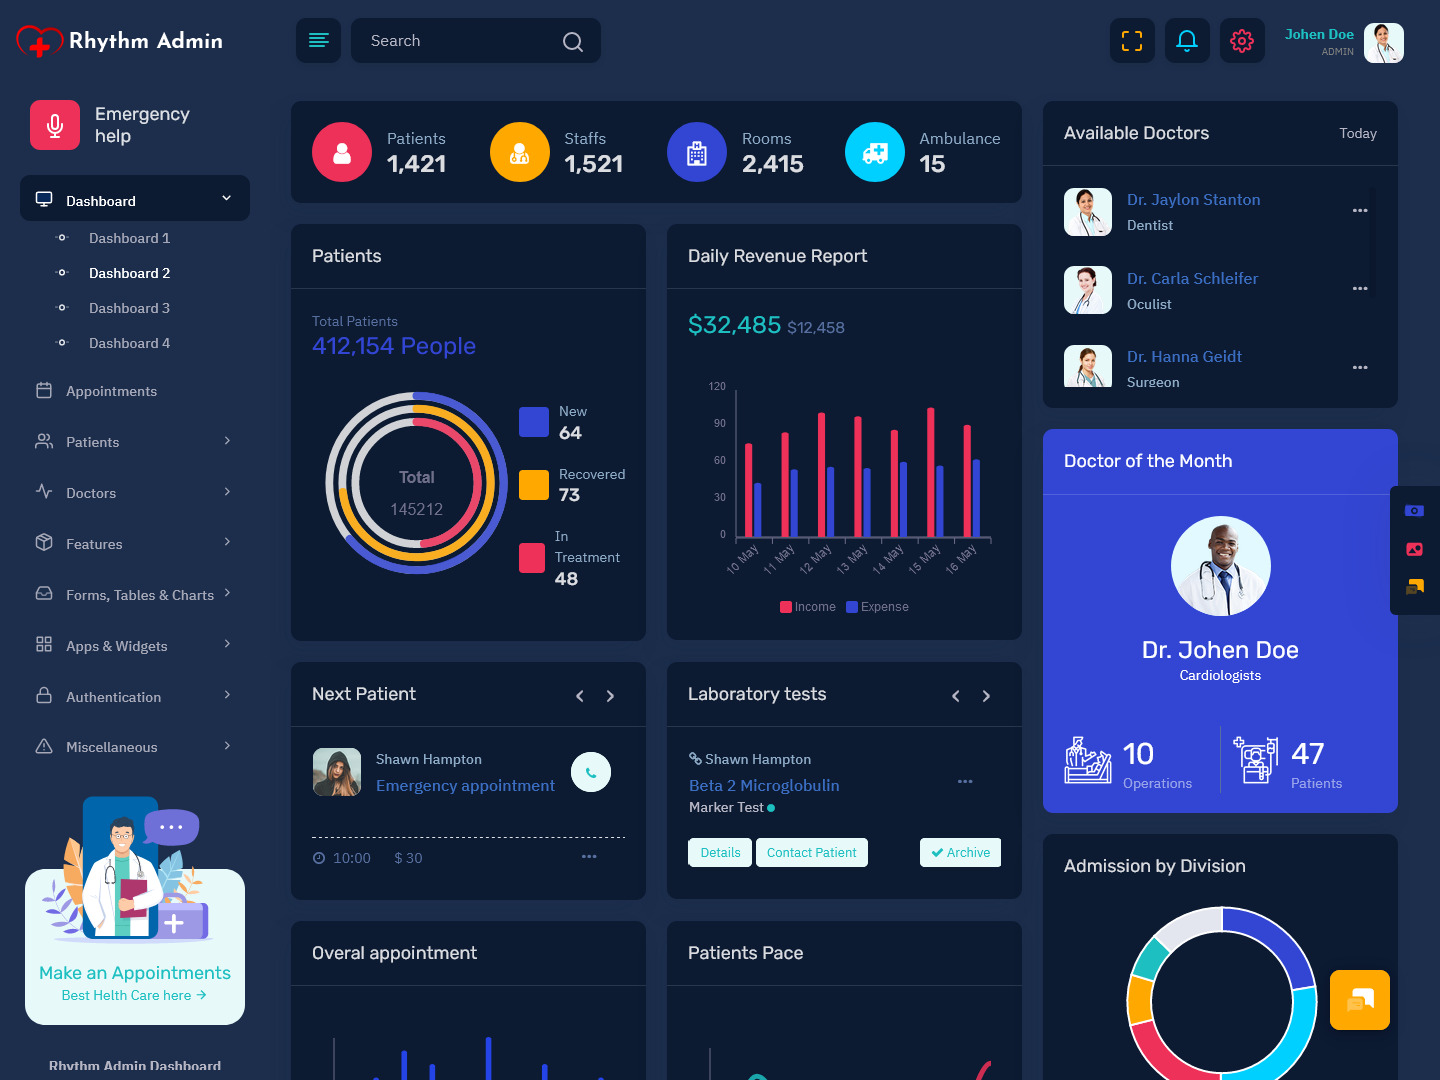
The Hospital Dashboard is divided into different sections, each focusing on a specific aspect of healthcare, such as patient metrics, operational data, clinical performance, resource usage, and more. This template can be customized to fit different types of healthcare settings (e.g., hospitals, clinics, emergency departments) and can be used by medical professionals, management teams, or hospital administrators.
Dashboards of Medical Admin
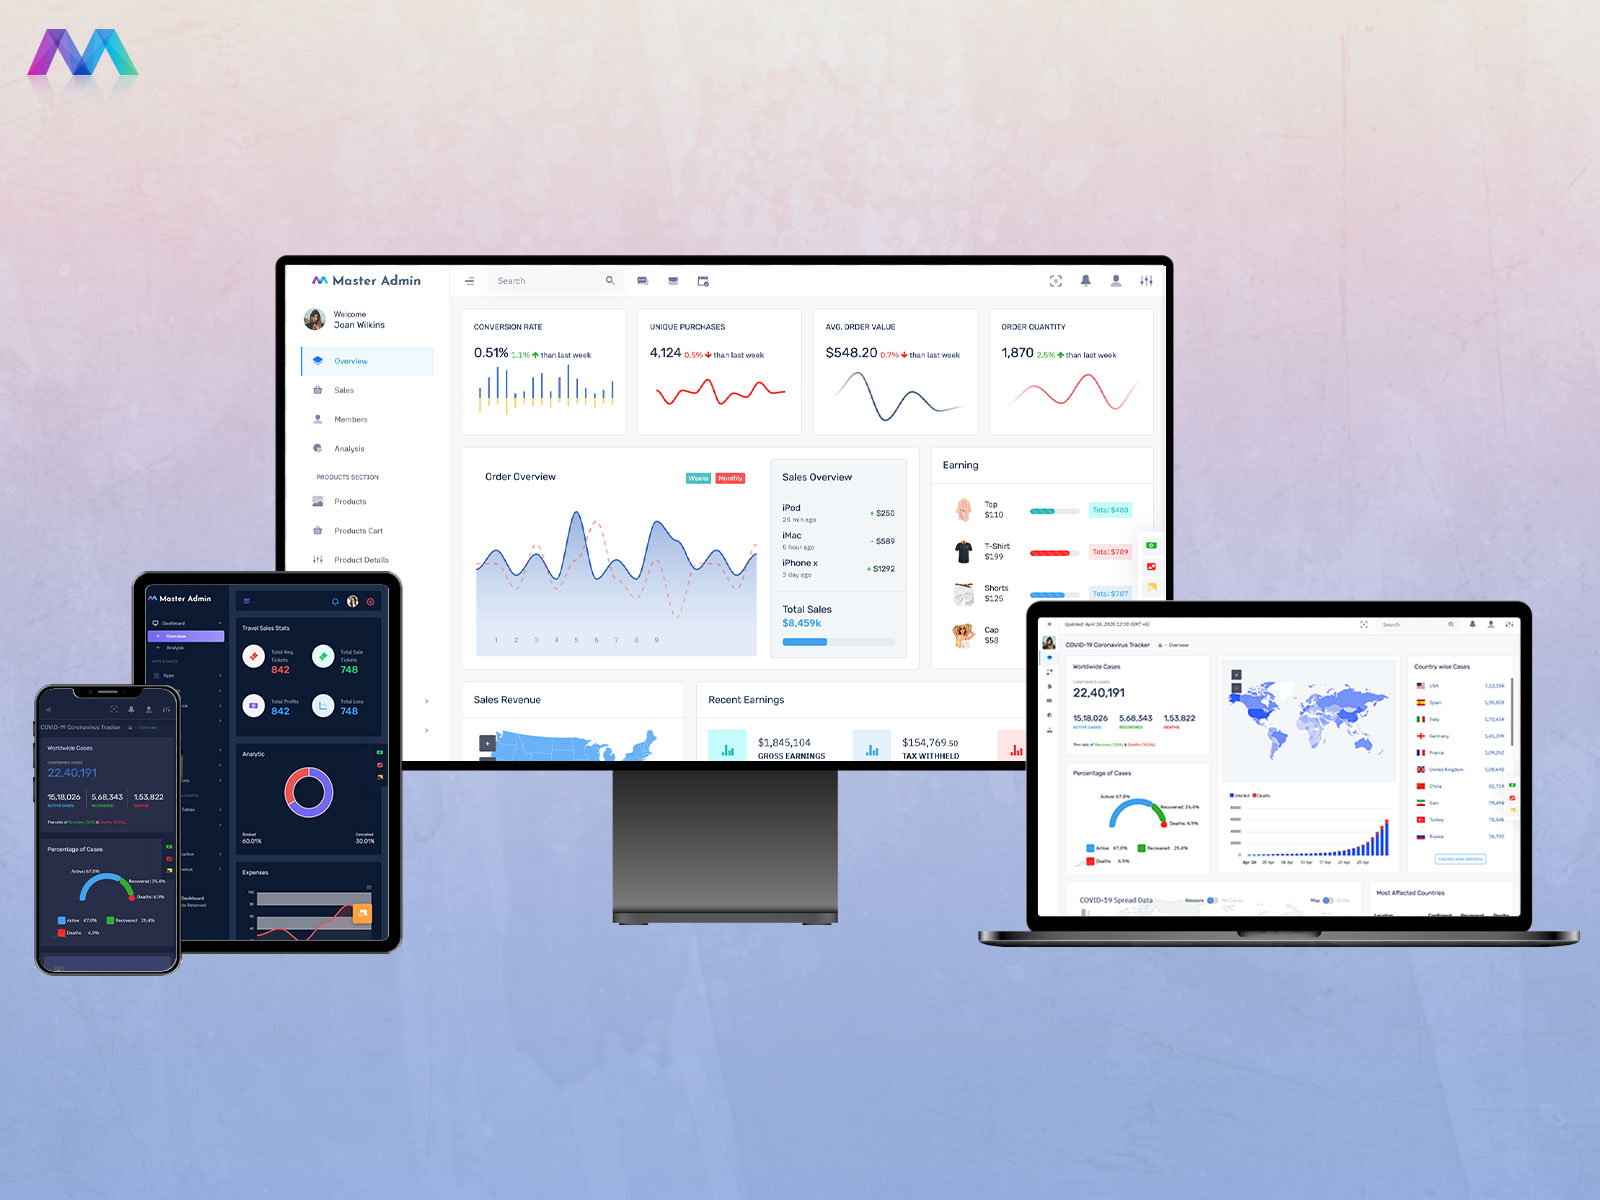
1. Doclinic Admin
Patients Dashboard – Light
MORE INFO / BUY NOW DEMO
Patients Dashboard – Dark
MORE INFO / BUY NOW DEMO
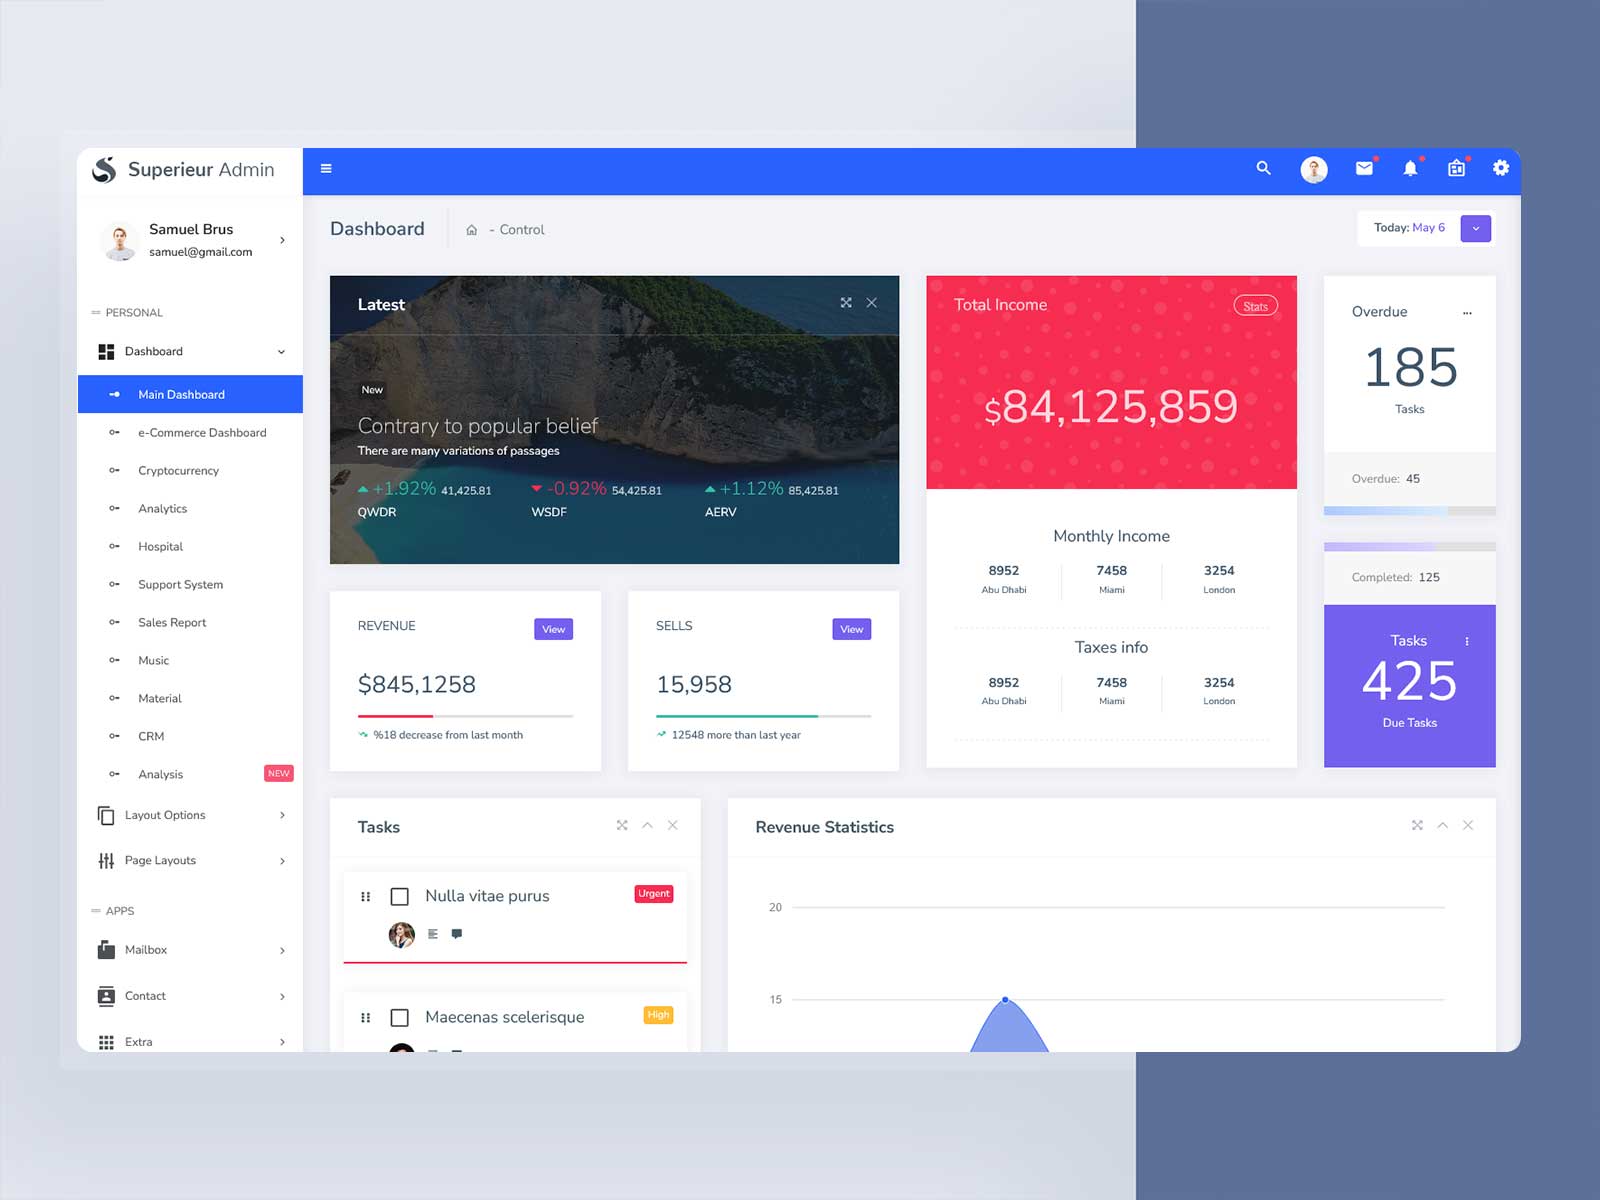
1. Rhythm Admin
Dashboard – Light
MORE INFO / BUY NOW DEMO
Dashboard – Dark
MORE INFO / BUY NOW DEMO
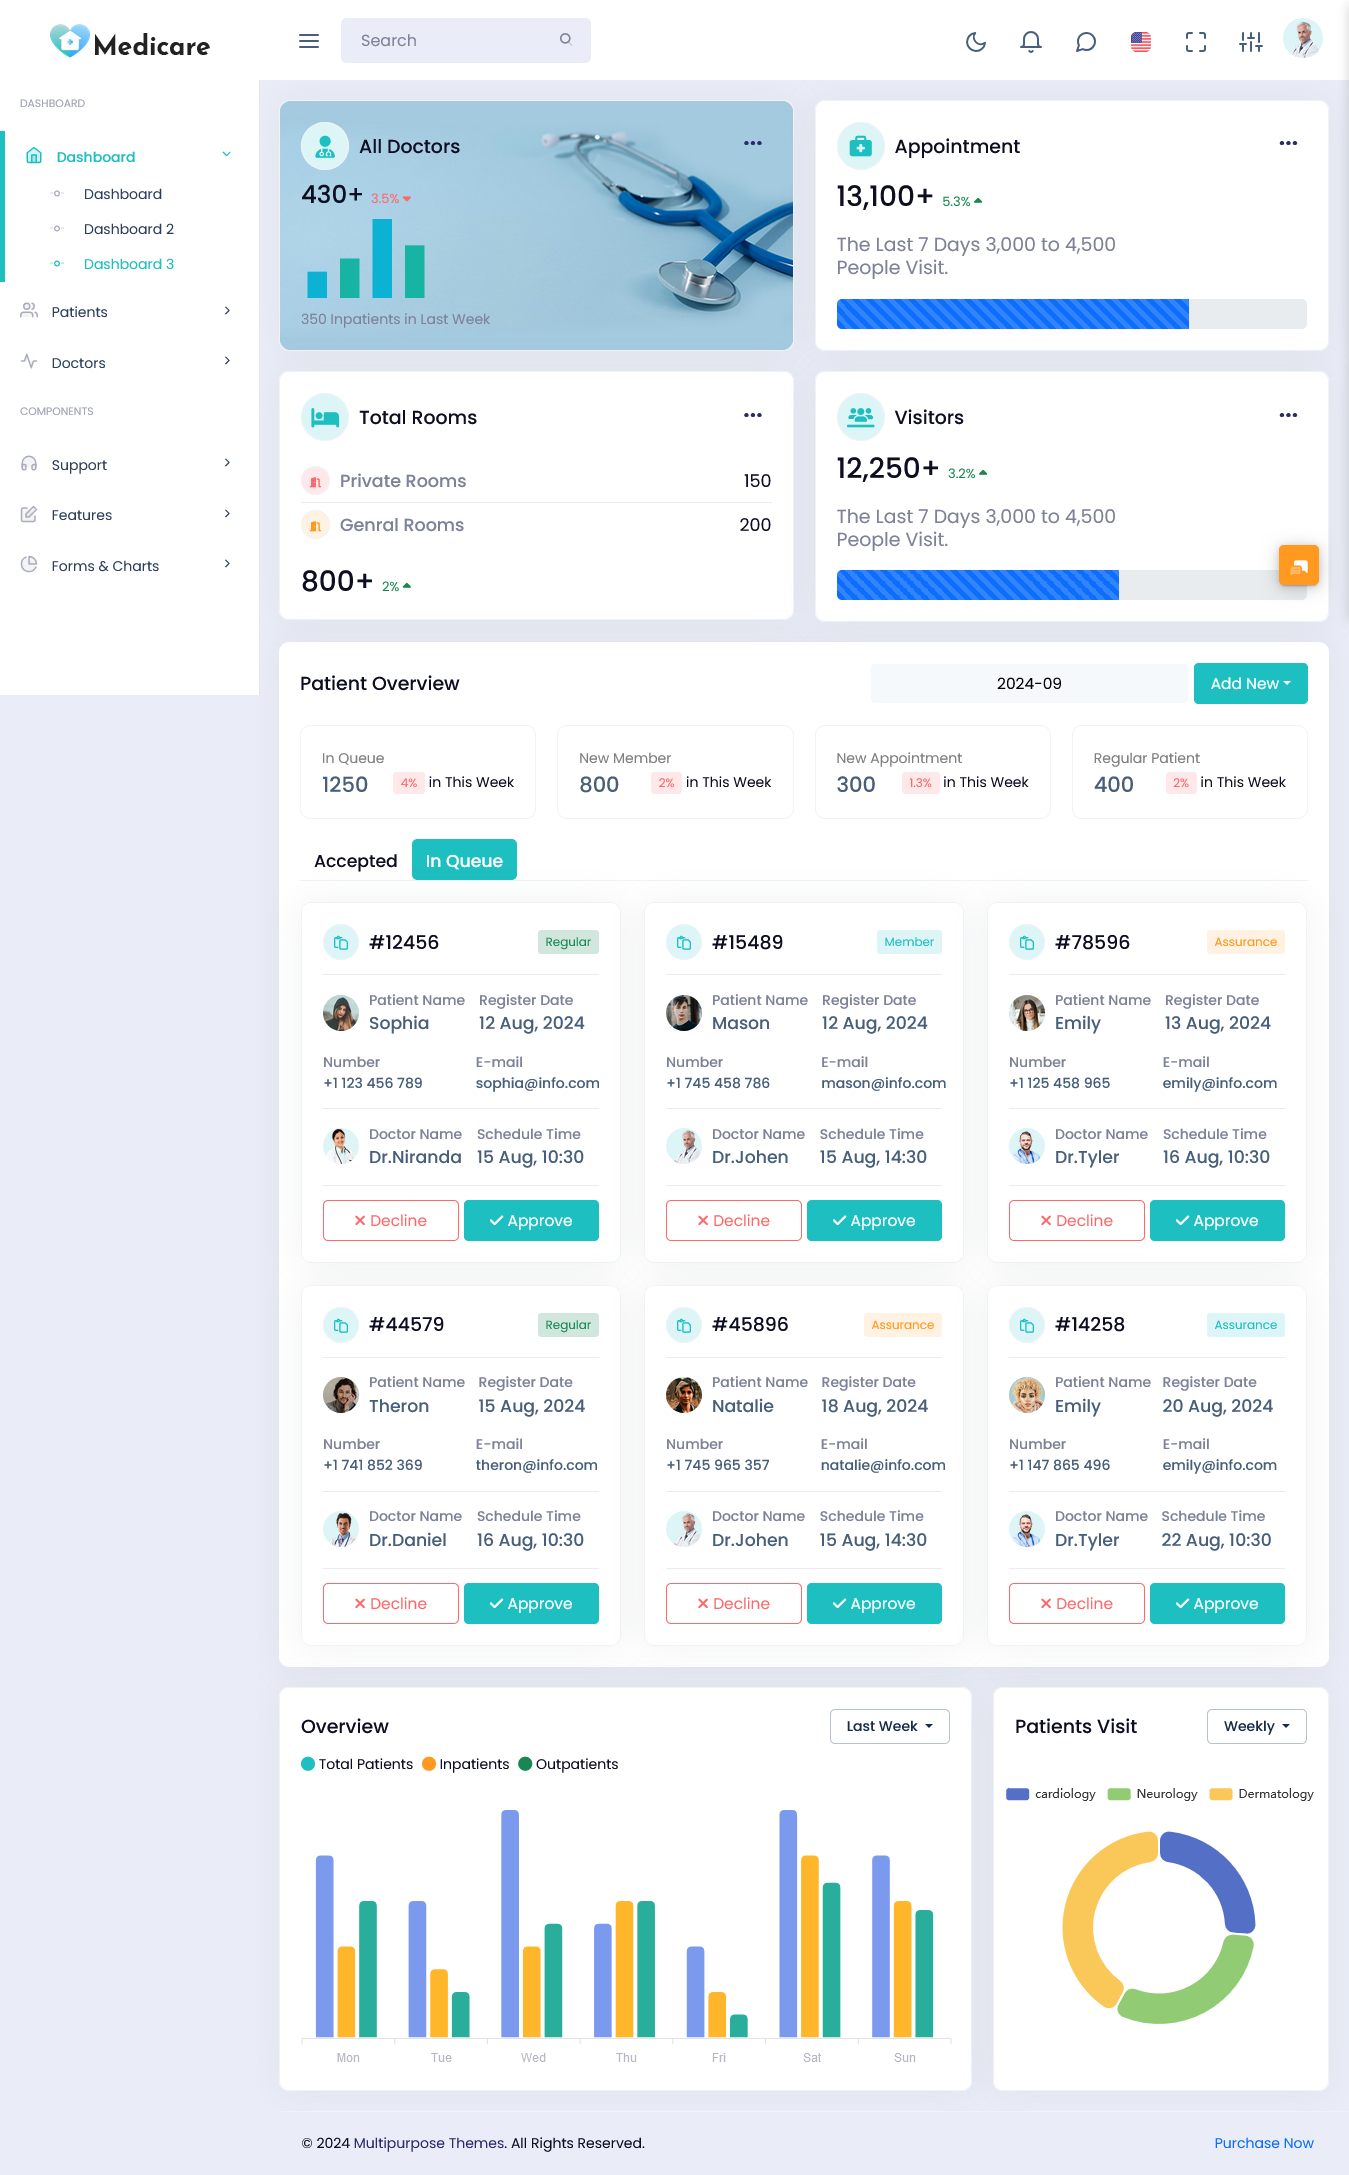
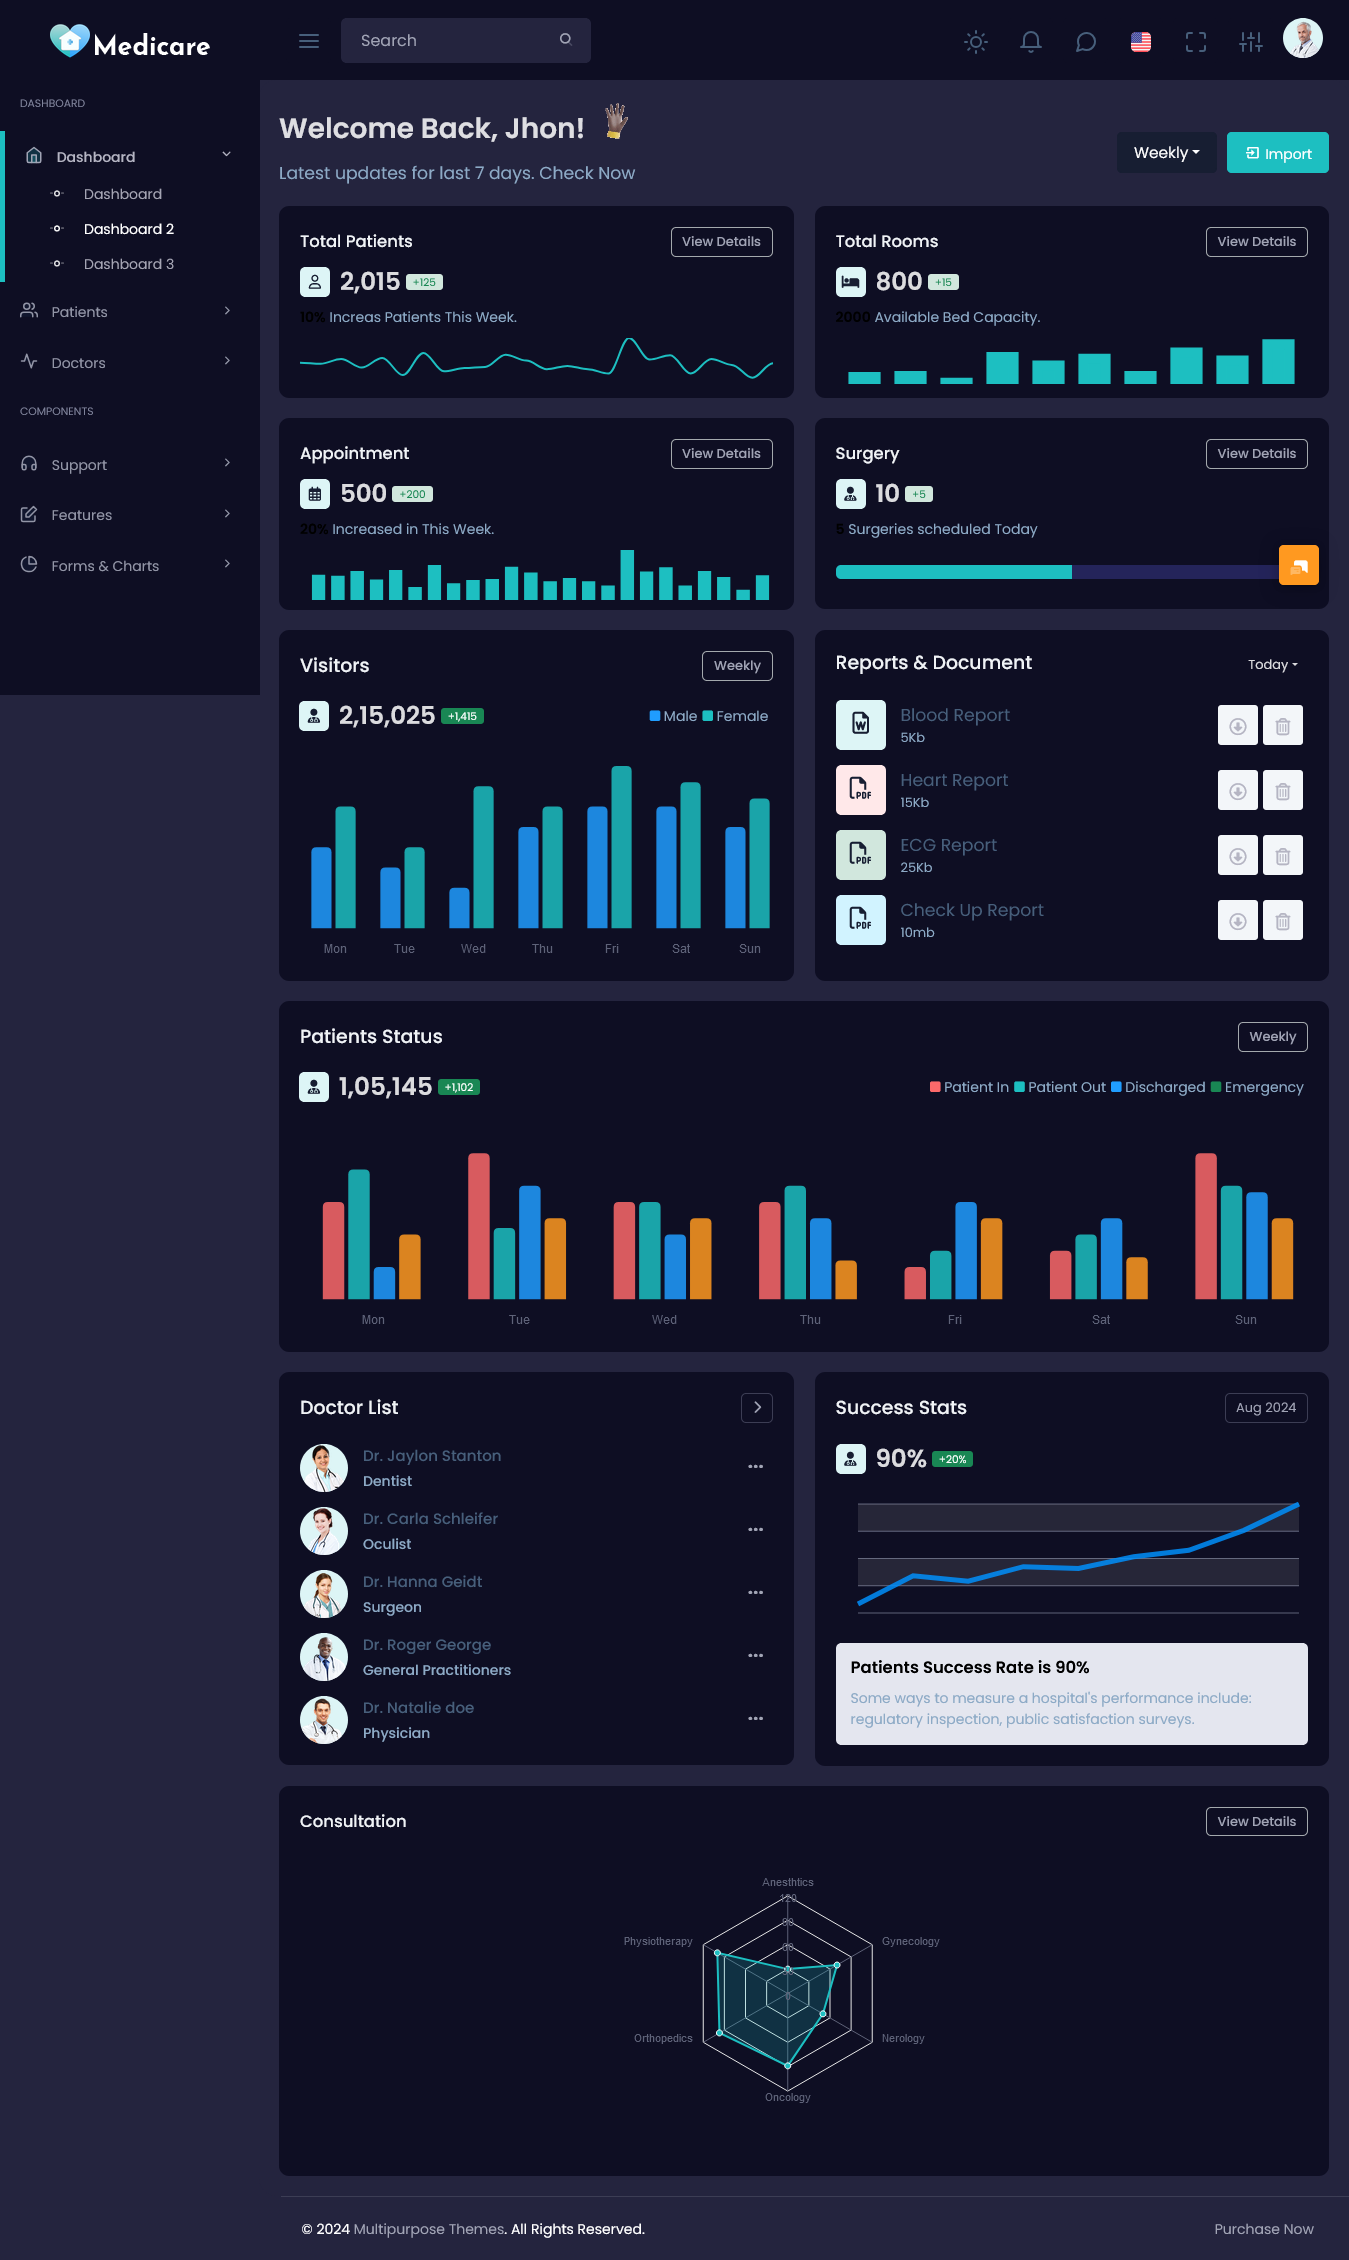
1. Medicare Admin
Dashboard – Light
MORE INFO / BUY NOW DEMO
New Dashboard – LTR Style – Dark Version
MORE INFO / BUY NOW DEMO
A Medical Dashboard Template is a powerful tool designed to help healthcare professionals and administrators manage, track, and visualize key data points in real time. This Doctor Dashboard Template is highly customizable, providing intuitive layouts that display critical information such as patient statistics, appointment schedules, treatment outcomes, and staff performance.
Medical dashboards typically feature clear, easy-to-read charts, graphs, and tables that help healthcare teams make informed decisions quickly. They can include data on patient demographics, admissions, discharges, medical history, lab results, and more. Additionally, a well-designed dashboard integrates effortlessly with existing electronic health records (EHR) and hospital management systems, providing a centralized view of all relevant data.
The main advantage of using a Hospital Dashboard is efficiency. With everything from patient flow to resource allocation visible at a glance, medical teams can identify trends, monitor treatment effectiveness, and respond to urgent needs faster. It also aids in improving patient care by ensuring that important data is never overlooked.
Key Features
- Real-time patient tracking
- Bed and equipment availability
- Physician and staff performance analytics
- Patient demographics analysis
- Financial and operational metrics
- Alerts and notifications
Target Users
- Doctors & Healthcare Providers
- Hospital Administrators
- Healthcare Analysts
- Operations Teams
Dashboard Template
1. Header Section
- Hospital/Facility Name
- Date and Time
- User Profile: (Login information, Role – Admin, Nurse, Doctor, etc.)
- Notifications Icon: To display critical system updates, alerts, or patient status changes.
- System Health Status: A quick summary of the system status—whether all systems are operational, or if there are any connectivity issues with connected devices.
2. Patient Metrics Section of Medical Dashboard
1. Current Admissions Overview
- Total Patients Admitted: Total number of patients currently admitted across departments.
- Patients Waiting for Room: Number of patients who are on hold for a bed in the emergency department or awaiting room assignments.
- Critical Patients: Display the number of patients in critical care units (ICU, ER).
- Discharges Pending: The number of patients who have been discharged but whose formal paperwork or final procedures are pending.
- Average Length of Stay (LOS): The average duration patients have stayed in the hospital, divided by departments (e.g., ER, ICU, General Ward).
2. Patient Demographics
- Age Breakdown: A pie chart or bar graph showing the distribution of patient age groups (e.g., 0-18, 19-35, 36-65, 65+).
- Gender Distribution: A simple bar chart representing the number of male, female, and non-binary patients admitted.
- Top 5 Common Conditions: Display a list of the most common diagnoses for patients currently admitted (e.g., diabetes, pneumonia, cardiovascular disease).
3. Patient Monitoring (Real-Time Data)
- Vital Signs: A live stream of average vital signs for patients currently in critical care, such as heart rate, respiratory rate, blood pressure, and oxygen saturation levels.
- Alerts: Highlight patients with abnormal or dangerous vital signs (color-coded alerts: green for normal, yellow for warning, red for critical).
3. Operational Metrics
1. Bed Availability
- Total Beds: Total number of beds across departments (e.g., ER, ICU, General Ward).
- Occupied Beds: Percentage and number of currently occupied beds.
- Available Beds: Number of available beds.
- Beds by Department: Break down the available beds by department or unit.
- Discharges Today: A tally of the number of patients discharged within the current day.
2. Staff Performance of Medical Dashboard
- Doctors on Duty: Number of physicians currently on shift, divided by department (e.g., cardiology, orthopedics).
- Nurses per Patient Ratio: Display the average number of nurses per patient in different departments.
- Staff Performance Metrics: Metrics on staff performance such as average response time to critical incidents, patient satisfaction score for nursing care, etc.
3. Equipment Availability
- Critical Equipment Usage: A breakdown of equipment such as ventilators, ECG machines, infusion pumps in use, and the number of available units.
- Scheduled Maintenance: Equipment currently scheduled for maintenance, with estimated downtime, and the number of units being repaired or tested.
4. Clinical Performance Section
1. Patient Treatment Times
- Average ER Wait Time: Time patients wait to be seen in the Emergency Room.
- Average Time in Surgery: Average time patients spend in surgical operations, broken down by procedure type.
- Recovery Time: Average time in recovery for post-surgery patients.
2. Treatment Outcomes
- Readmission Rates: A graph or table displaying readmission rates for patients within 30 days of discharge, broken down by department or condition.
- Mortality Rates: Mortality rate statistics in real-time or for specific time periods (e.g., 7-day, 30-day mortality).
- Patient Satisfaction Scores: Graphical representation of patient satisfaction metrics (survey results) on a scale of 1 to 10, divided by department.
3. Clinical Procedures & Treatment Effectiveness
- Top 5 Most Common Procedures: Number of common clinical procedures performed (e.g., C-sections, appendectomies, orthopedic surgeries).
- Treatment Success Rate: Percentage of successful treatments or operations across various departments or specialties.
5. Financial and Operational Metrics
1. Revenue Generation
- Total Revenue: Displays the total revenue generated by the hospital over a given period.
- Revenue by Department: Breakdown of revenue generation by departments such as emergency, inpatient, outpatient, surgery, etc.
- Insurance Claims Submitted/Approved: Tracks the number of claims submitted and approved by insurance companies.
2. Cost Management
- Operational Costs: Total cost of operations, including staffing, equipment, supplies, utilities, and medications.
- Cost Per Patient: Average cost per patient for different treatments or hospital services.
- Expenditures by Department: Display operational expenditure by department or service line.
3. Resource Utilization of Medical Dashboard
- Drug & Supply Inventory: Current stock of drugs, surgical supplies, and other consumables, with alerts for low stock.
- Resource Utilization Rate: Percentage of resources used versus resources available (e.g., blood bank inventory, oxygen supply).
6. Alerts & Notifications
- Critical Alerts: Highlight critical events such as patients requiring immediate attention, critical equipment failures, or staff shortages.
- Upcoming Appointments/Procedures: List of upcoming patient appointments, surgeries, or tests with expected times and medical staff involved.
- Hospital-wide Announcements: Notifications on scheduled maintenance, shifts in operational policies, or important reminders for staff.
7. Custom Reports and Analysis
- Monthly Report Generator: Generate monthly reports on patient admissions, discharges, operational costs, and clinical outcomes.
- Comparison Charts: Display comparisons across timeframes, departments, or conditions to track performance improvements or declines.
- Predictive Analytics: Visualize trends and predictions (e.g., using machine learning algorithms) for future admissions, expected equipment failure, or staffing needs based on historical data.
8. Footer Section
- Legal and Compliance Notices: Display medical data privacy guidelines, HIPAA compliance information, or other relevant legal notices.
- Support Links: Links to IT support, help guides, and contact information for technical assistance or medical queries.
- Quick Access Links: Shortcuts to commonly used features (e.g., add new patient, view previous reports, schedule surgery).
Conclusion
This Medical Dashboard offers a dynamic and customizable framework for monitoring critical aspects of healthcare operations and patient care in real-time. The various sections—patient metrics, clinical performance, operational data, and financial insights—ensure that all key stakeholders, from administrators to medical professionals, have access to vital data in an intuitive, easily digestible format.
The Hospital Dashboard can be implemented with real-time data integration from electronic health record (EHR) systems, patient management systems, or any other connected healthcare tools. Advanced filters, interactive charts, and drill-down options can further improve the user experience by allowing customized views of data for specific departments, units, or conditions.
By leveraging this template, healthcare facilities can enhance their decision-making capabilities, streamline operations, and ultimately provide better patient care.
 skip to Main Content


This Post Has 0 Comments