Managing wedding events is a beautiful but complex responsibility. Every bride and groom dream of…
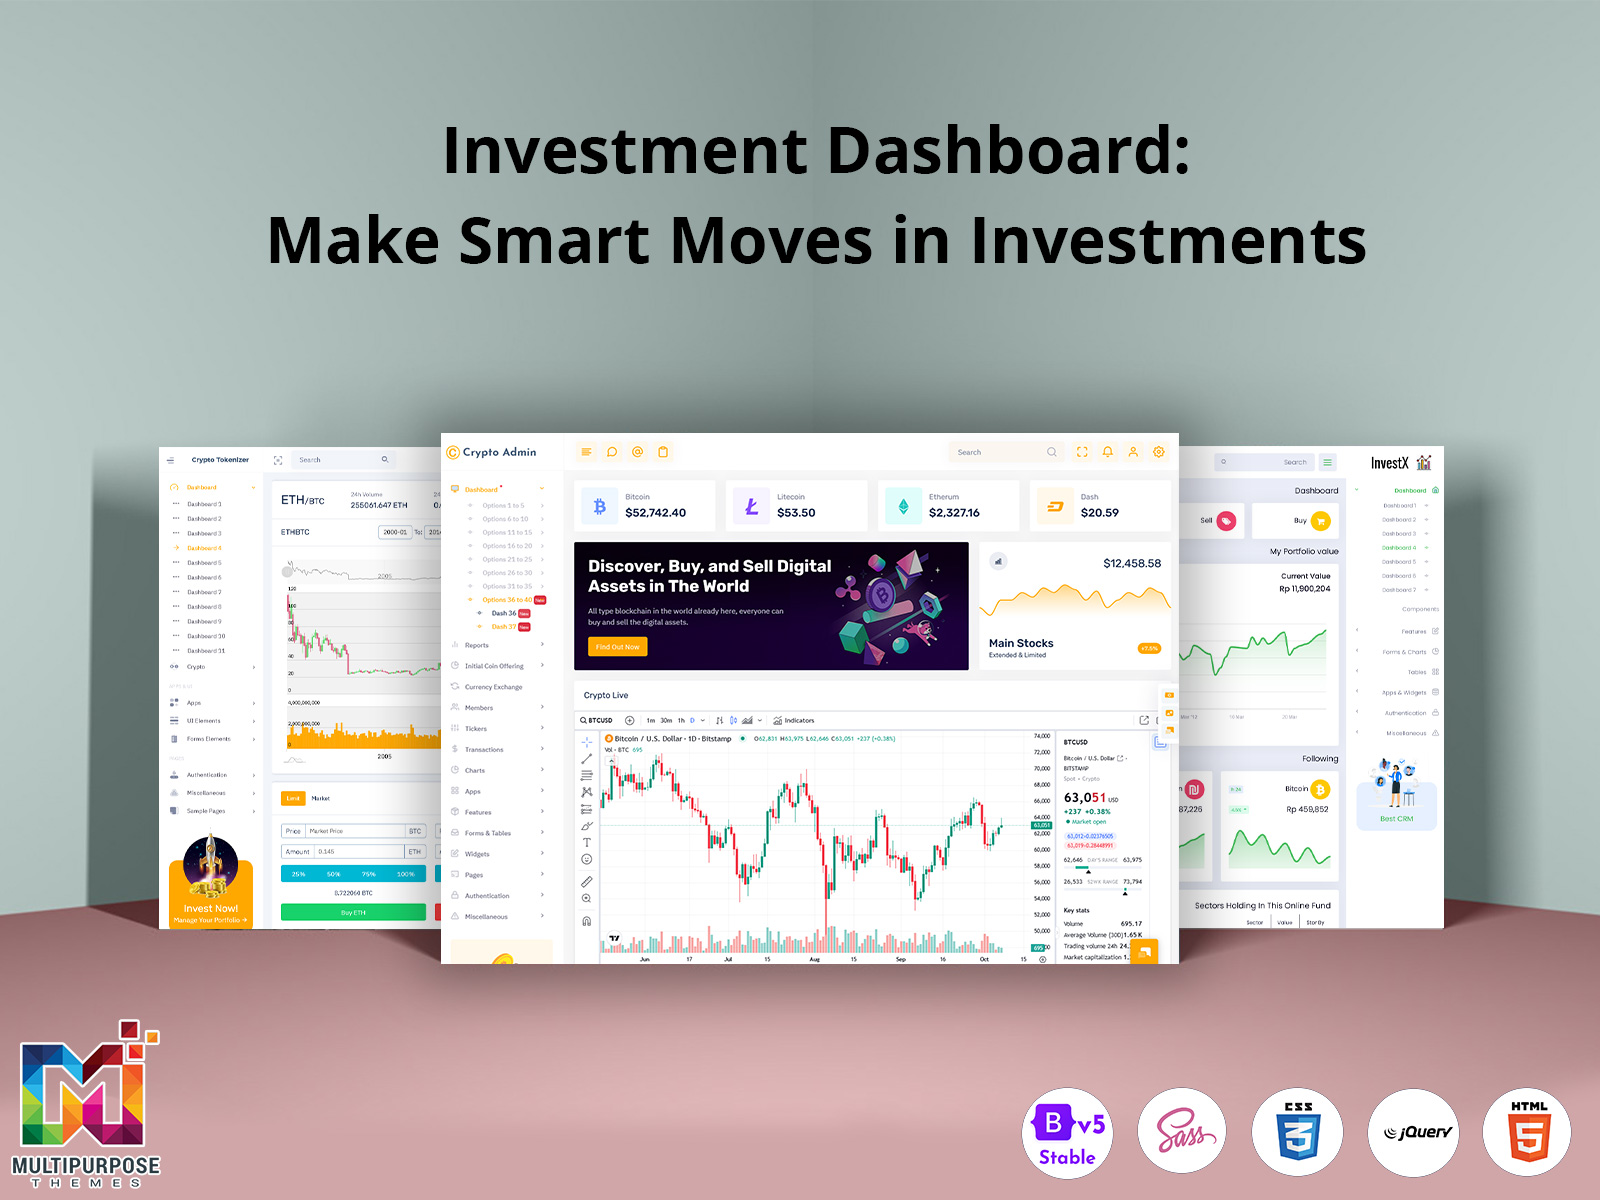
Leading-edge Investment Dashboard – Performance and Trends
Reading Time: 6 minutes
Welcome to the Multipurpose Theme! Whether you’re an expert investor or just starting your investment journey, you’ve arrived at the right place. Our Investment Dashboard is designed to upgrade the way you manage, track, and analyze your portfolios across different asset classes, including cryptocurrencies, Bitcoin, stocks, commodities, forex, and more.
Why Choose Our Investment Templates?
Our Trading Dashboard offer a range of features that support both beginner and expert investors, helping you optimize your investment process and make data-driven decisions with confidence. Whether you’re managing a multifaceted portfolio, tracking stock prices, monitoring Bitcoin fluctuations, or analyzing commodities, our dashboards have got you covered.
Why a Trading Dashboard Matters
A trading dashboard is a central hub where you can view and analyze all your investments in one place. It offers several crucial benefits:
Real-time Data:
Having up-to-date information is critical in fast-moving markets, especially when trading cryptocurrencies and stocks where price Instability is high.
Portfolio Management:
A good trading dashboard allows you to track your holdings, monitor your portfolio performance, and make data-driven decisions.
Technical and Fundamental Analysis:
A complete Investment Dashboard should incorporate both technical and fundamental metrics, Empowering you to analyze price charts, market trends, and financial indicators.
Risk Management:
With instant access to relevant data, you can react quickly to market changes and minimize risk exposure, protecting your investments from significant losses.
Customizable Features:
Investors have different needs, and a customizable dashboard ensures that you can create it to suit your individual investment strategy.
Our trading dashboard template is designed to incorporate all these essential features and more.
Our Investment Admin Templates for Smarter Investing
BUY NOW
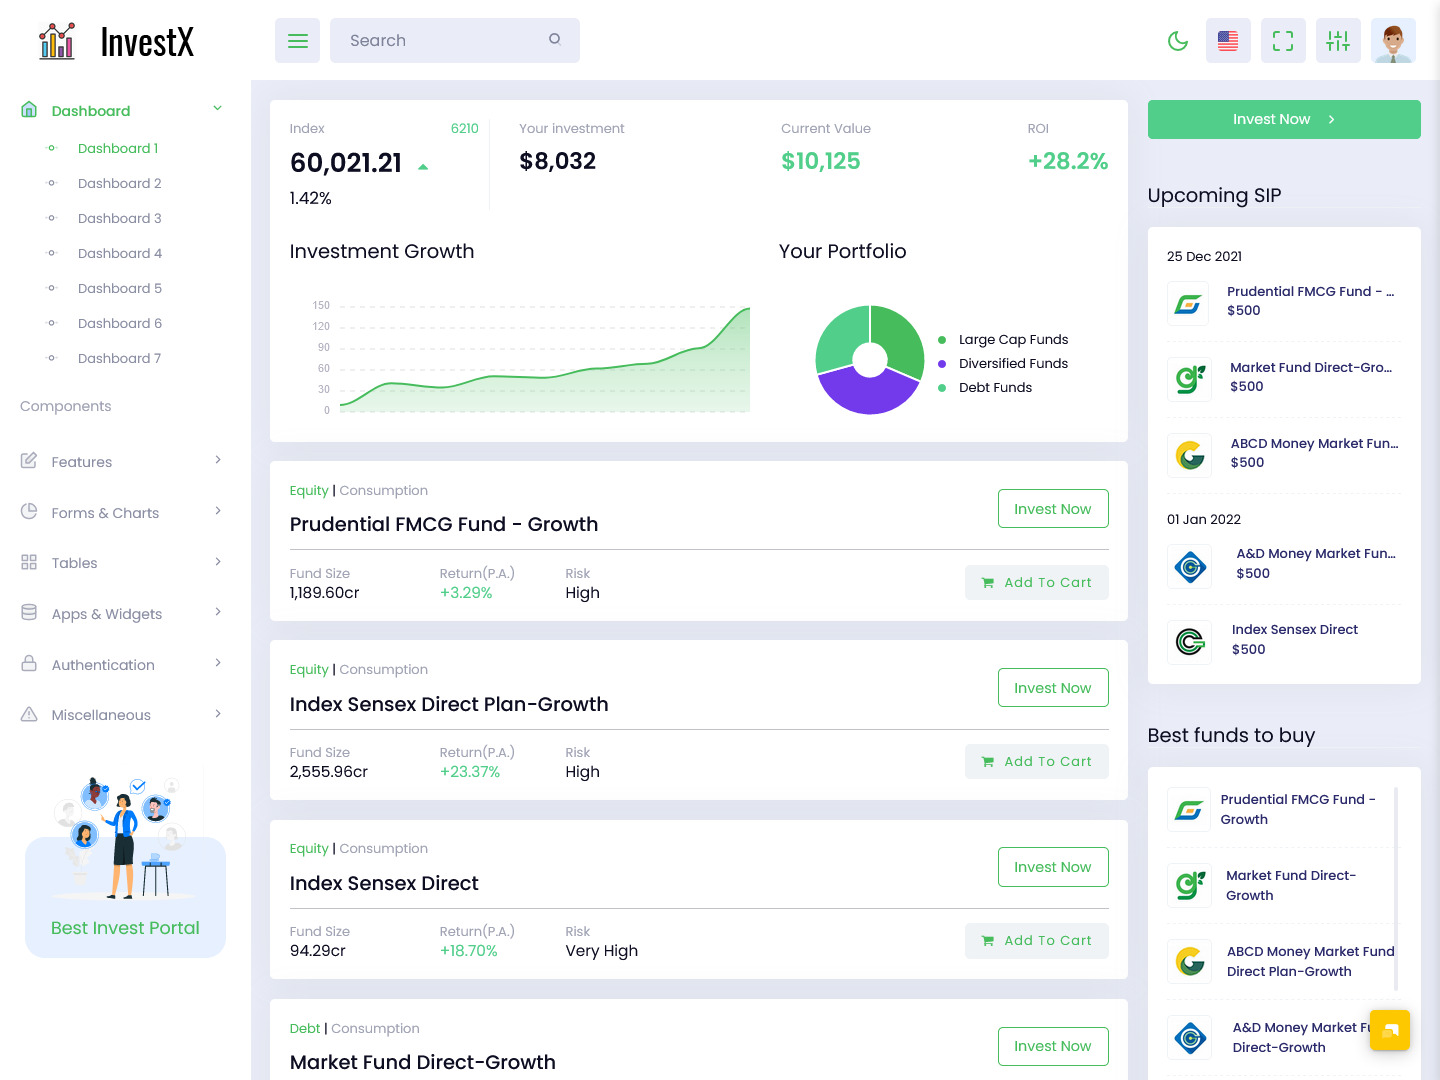
1. InvestX Admin Template
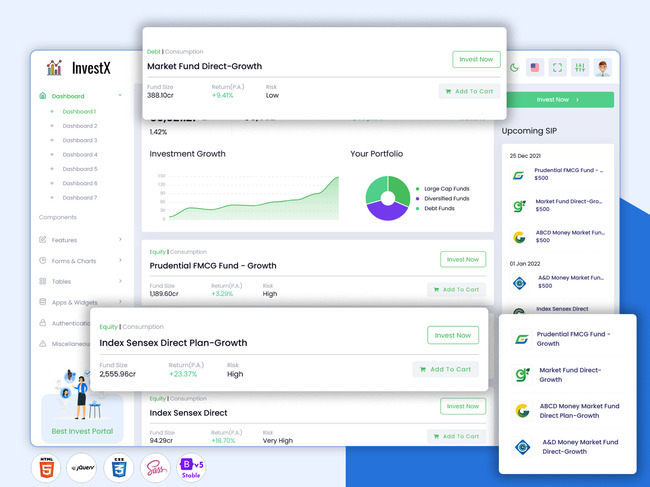
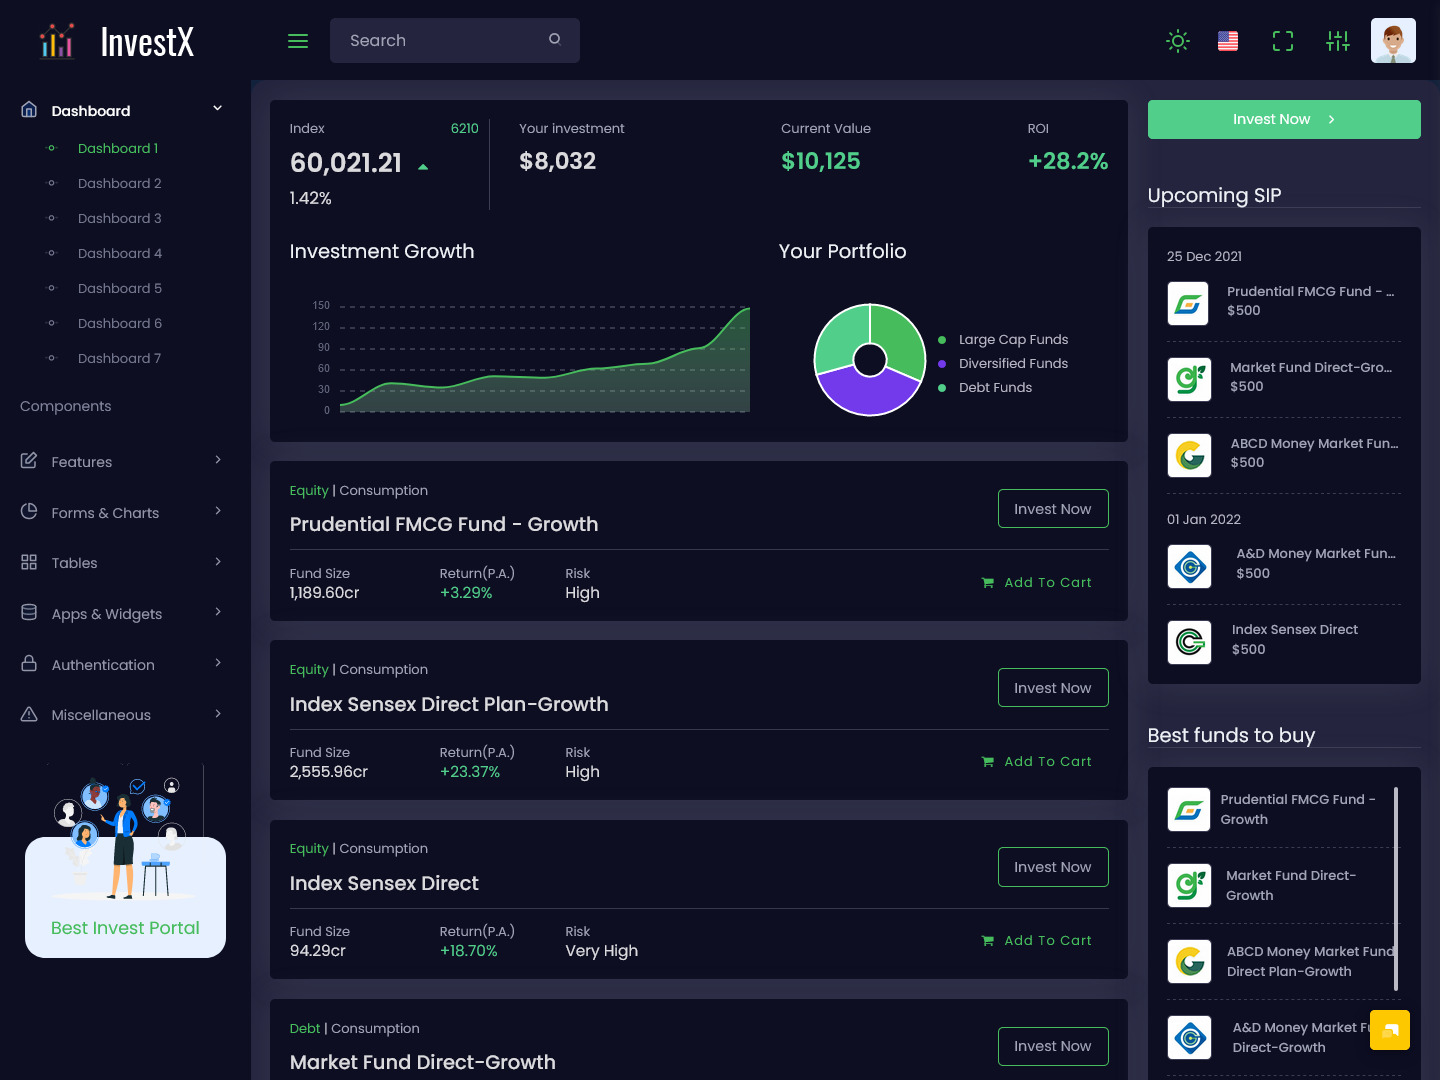
Dashboards of InvestX Admin Template
Dashboard – Light Version
MORE INFO / BUY NOW DEMO
Dashboard – Dark Version
MORE INFO / BUY NOW DEMO
Video of InvestX Admin Template
BUY NOW
2. Crypto Admin Template
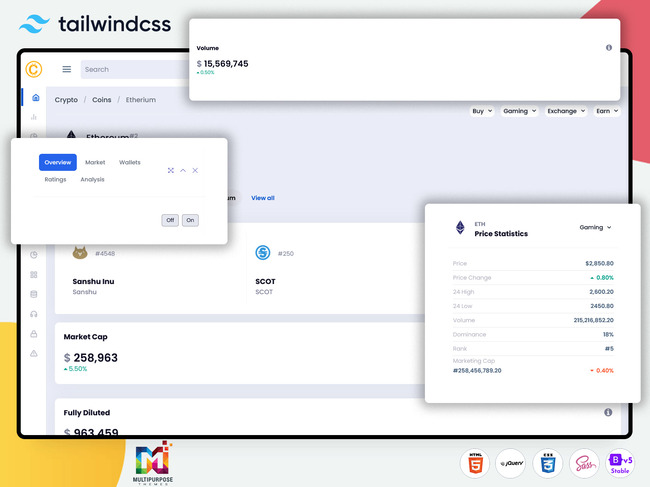
Dashboards of InvestX Admin Template
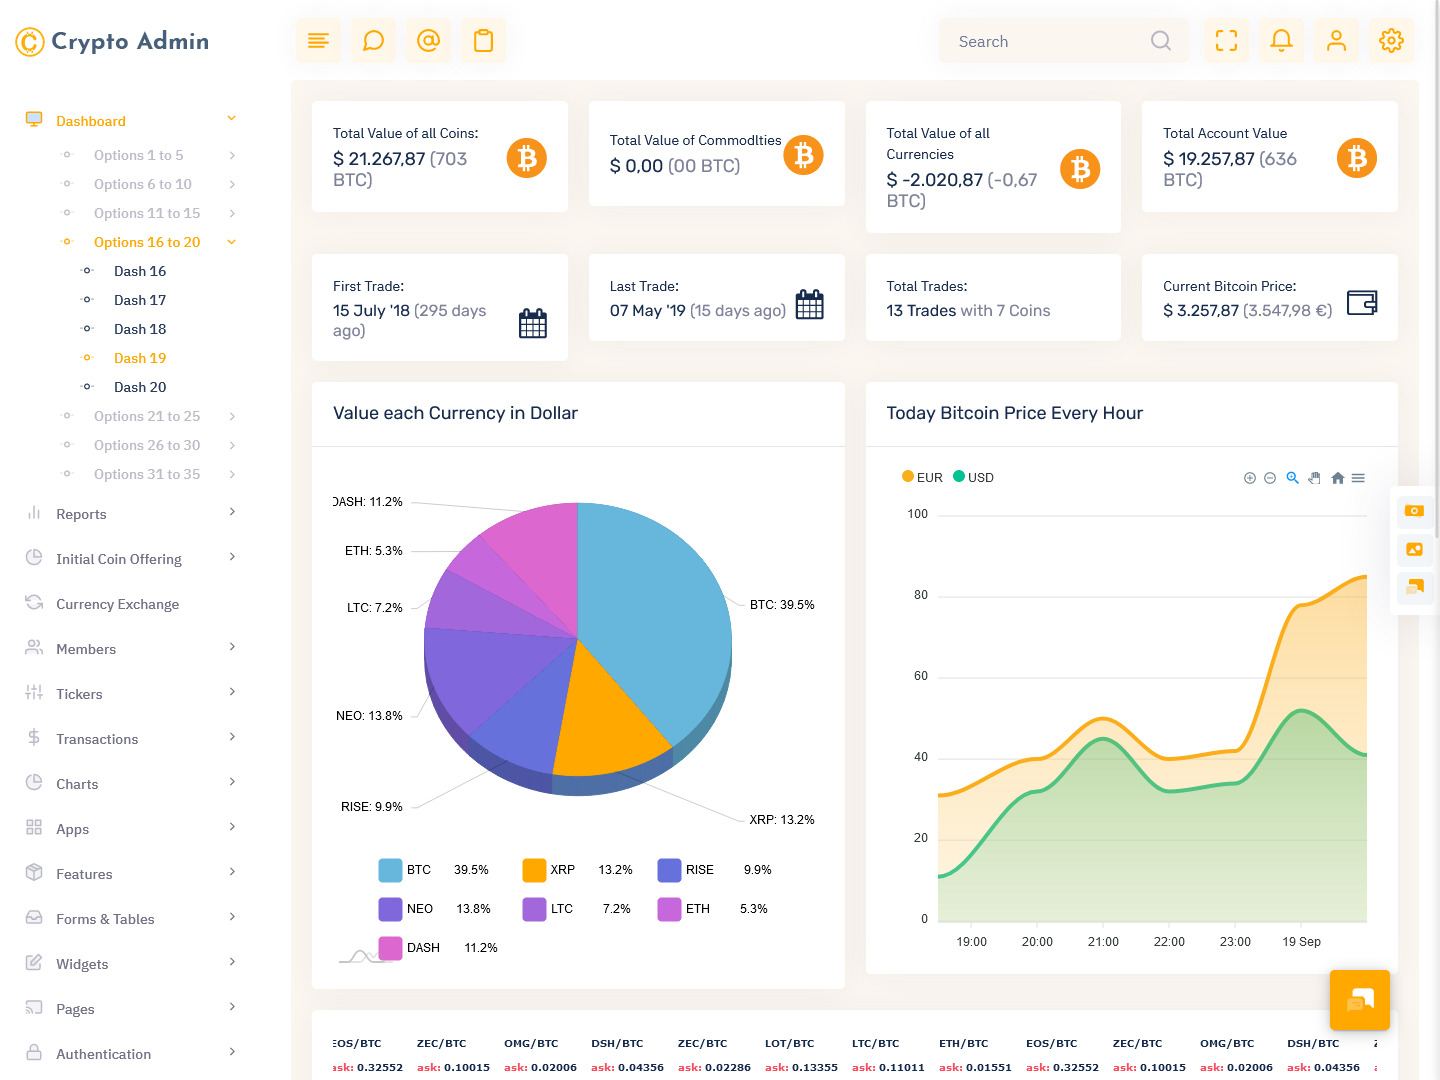
Dashboard – Light Version
MORE INFO / BUY NOW DEMO
Dashboard – Dark Version
MORE INFO / BUY NOW DEMO
Video of Crypto Admin Template
BUY NOW
3. Crypto Tokenizer Admin Template
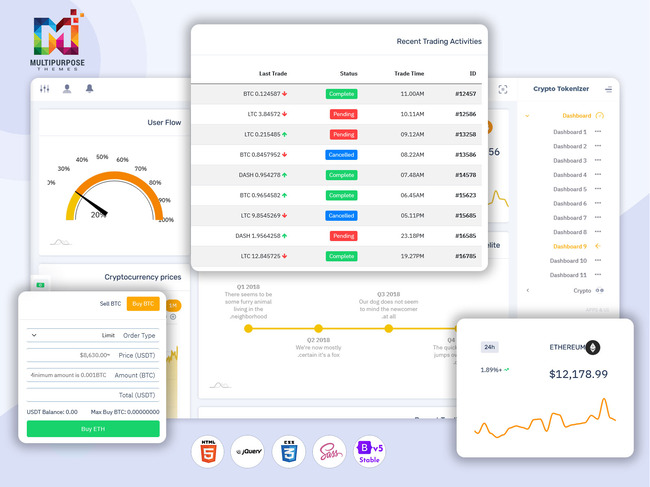
Dashboards of Tokenizer Admin Template
Dashboard – Light Version
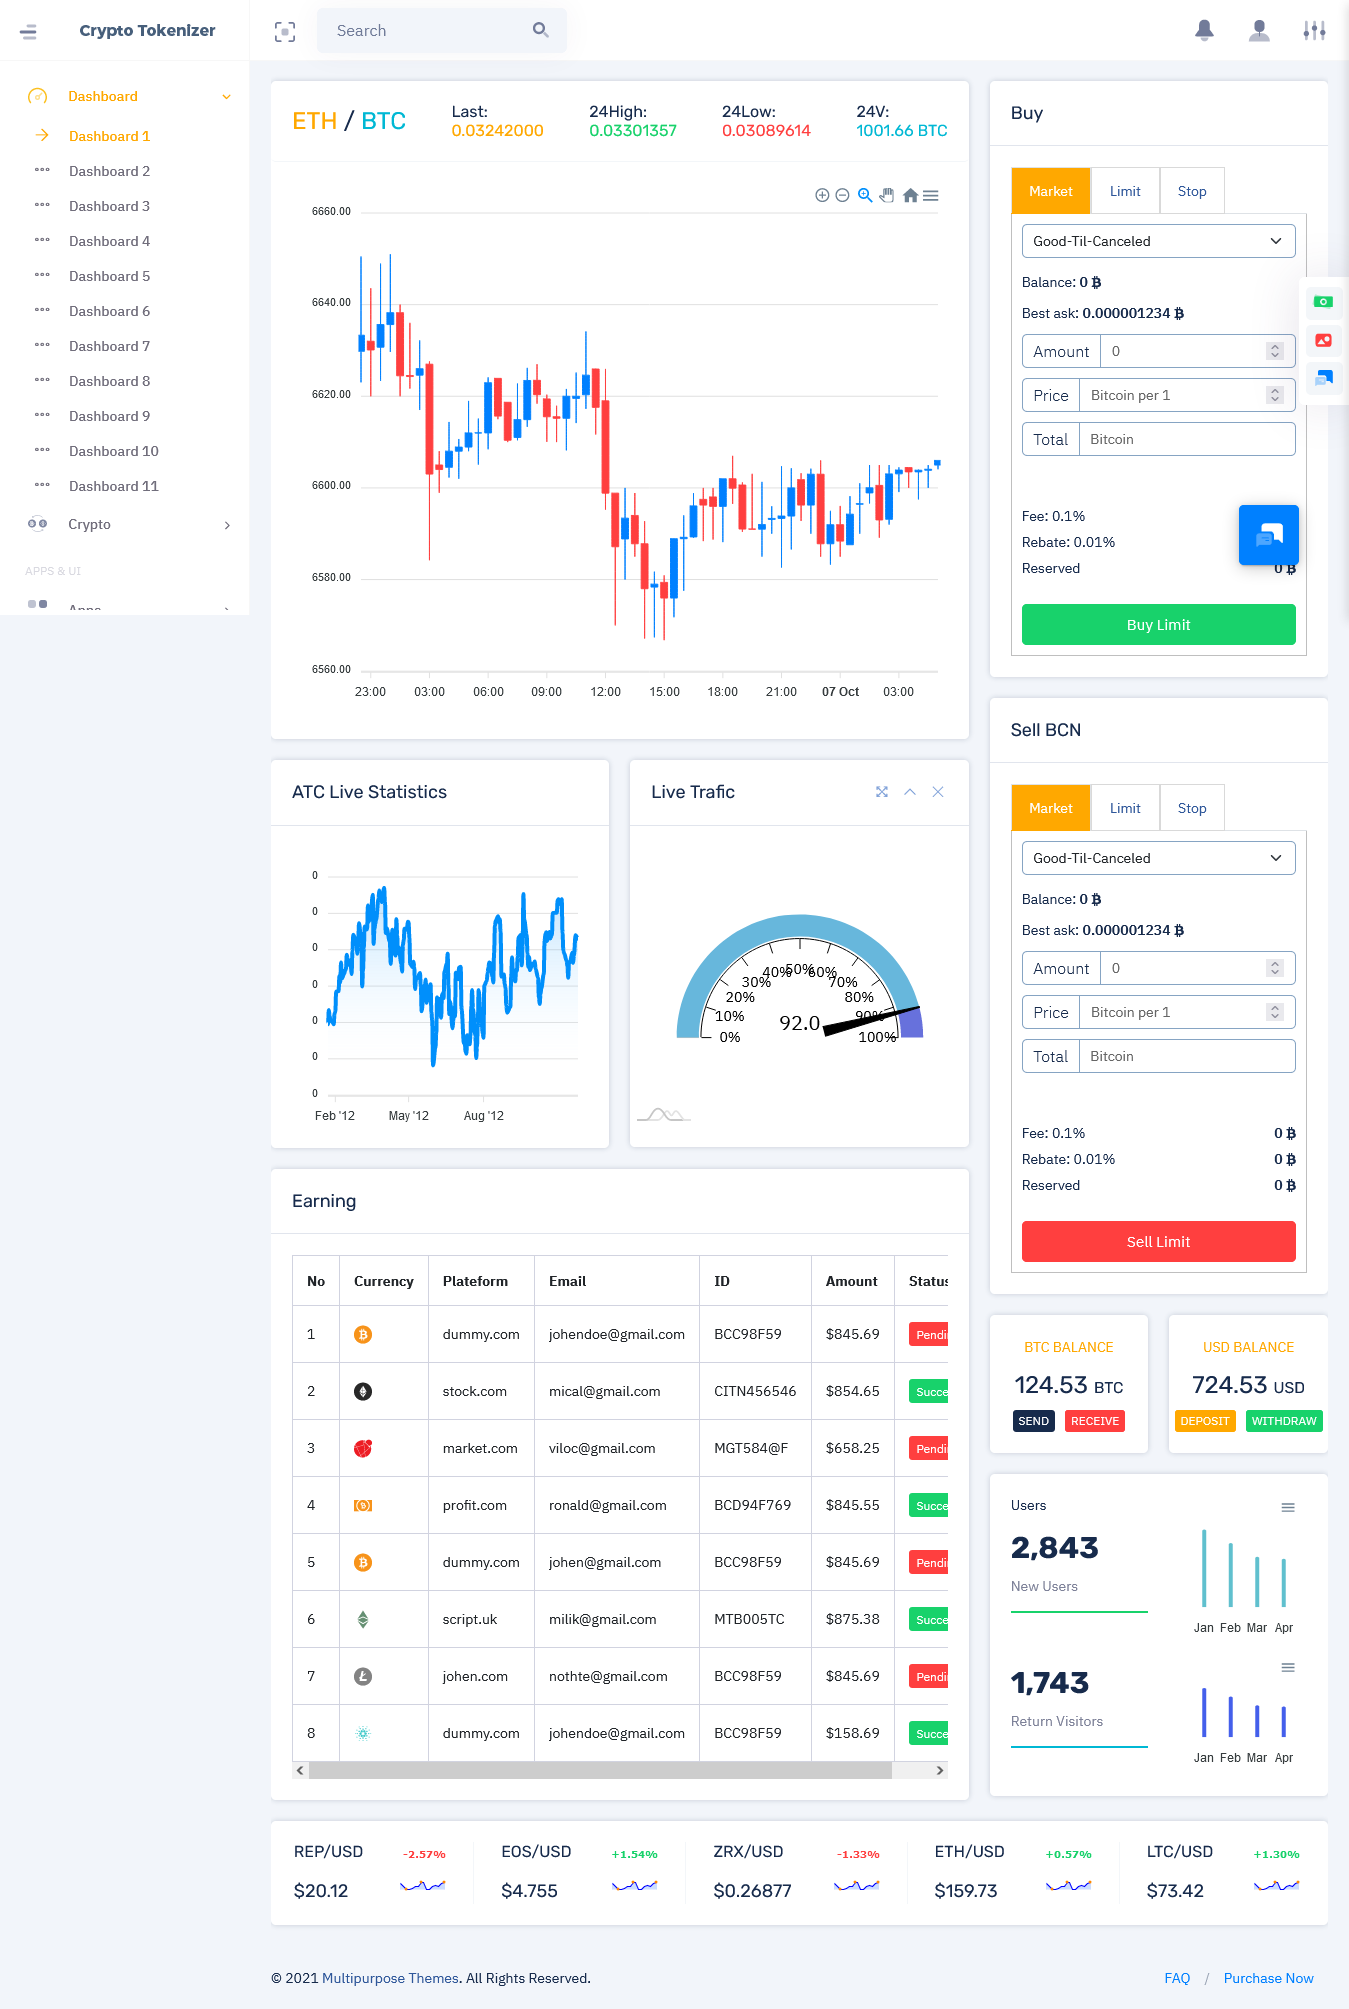
MORE INFO / BUY NOW DEMO
Dashboard – Dark Version
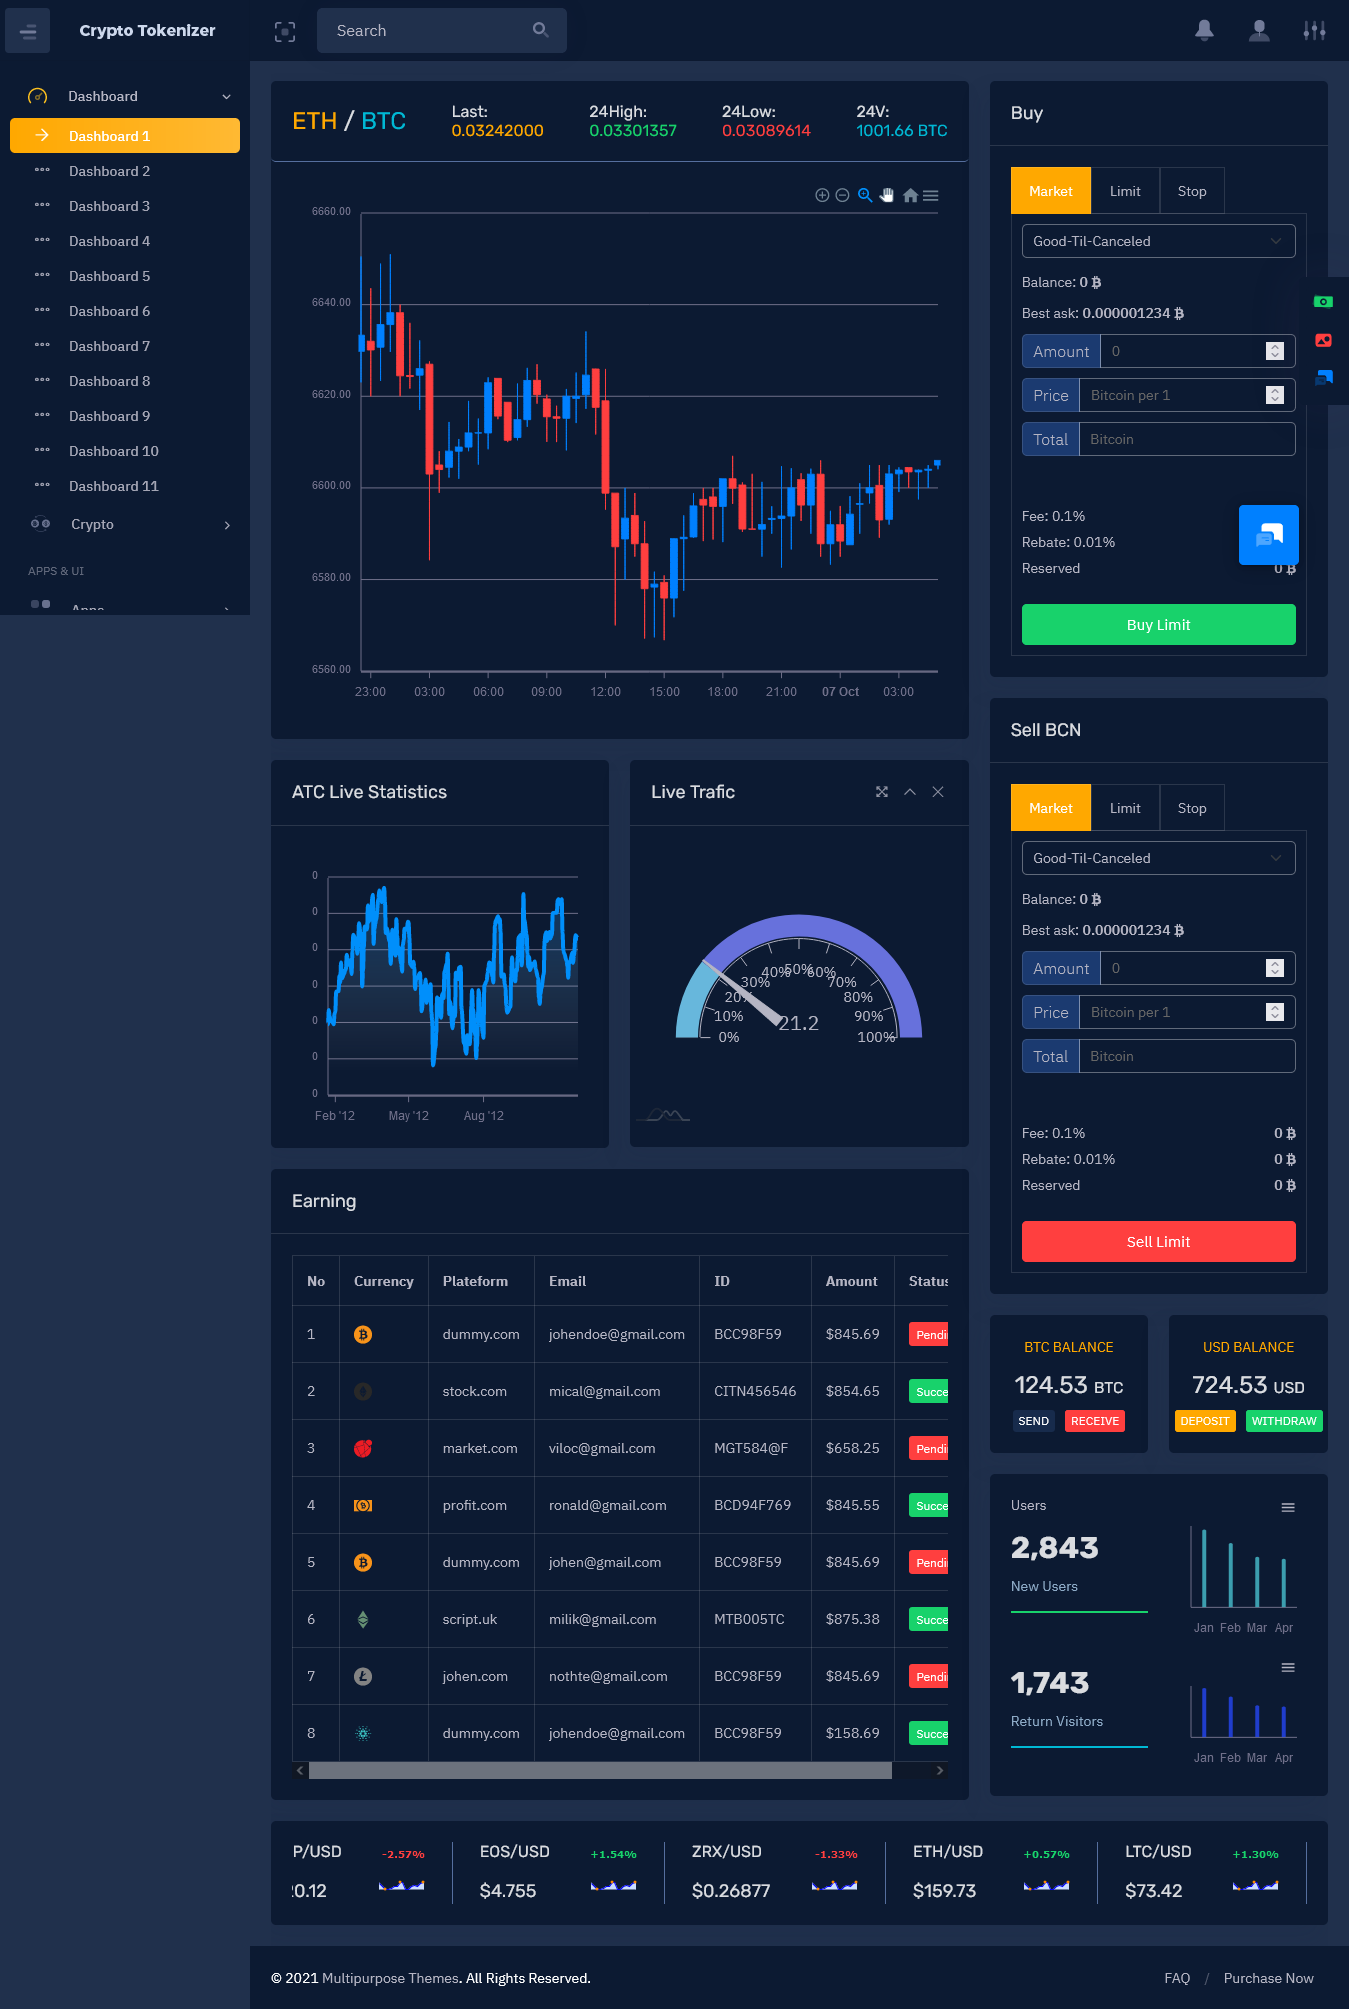
MORE INFO / BUY NOW DEMO
Video of Crypto Tokenizer Admin Template
Key Features of Our Trading Dashboard
Our dashboard template is designed for both beginner and expert traders who need an intuitive, user-friendly interface to manage multiple asset Sections. It comes packed with powerful features that make it an Imperative tool for anyone involved in the cryptocurrency, Bitcoin, and stock markets.
1. Multi-Asset Support (Crypto, Bitcoin, Stocks, and Commodities)
Our Trading Dashboard is built to handle a wide variety of asset Sections. Whether you’re tracking the latest Bitcoin prices, managing a portfolio of altcoins, monitoring stock movements, or investing in Resources like gold and oil, this Investment Dashboard can integrate all your investments into one cohesive platform.
Crypto and Bitcoin Tracker: Display the latest prices, volume, and market cap of major cryptocurrencies like Bitcoin, Ethereum, Ripple, and others. Real-time price updates help you spot market trends as they happen.
Stock Market Overview: Monitor stock prices, historical trends, and key financial metrics for companies on major exchanges like NYSE, NASDAQ, and more.
Commodities: Keep an eye on commodities like gold, silver, and oil prices with real-time data.
2. Real-Time Market Data and Alerts
Staying ahead of the curve is essential when dealing with volatile markets, which is why our dashboard template pulls real-time market data from multiple sources. You can track price movements, volume and other essential indicators as they happen.
Custom Alerts: Set price alerts to receive notifications when an asset hits a specific value, ensuring that you never miss an opportunity to buy or sell.
Live News Feed: Get instant updates on market news and relevant articles, helping you make well-informed decisions in real time.
Price Trends: Use moving averages, price candles, and trend lines to identify short-term and long-term market trends.
3. Customizable Widgets and Layouts
Not all traders and investors have the same needs. Our trading Investment Dashboard template allows you to fully customize your interface to display the data that matters most to you.
Custom Widgets: Choose from a variety of widgets like asset price tickers, historical charts, and portfolio summaries.
Drag-and-Drop Layouts: Create your perfect dashboard layout with easy drag-and-drop functionality.
Dynamic Filtering: Filter assets by categories such as “Top Movers,” “Gainers,” and “Losers” to spot opportunities quickly.
4. Advanced Charting and Technical Analysis
For those who rely on technical analysis to guide their investment decisions, our template provides an advanced charting engine that can display various types of charts such as line, candlestick, and OHLC (Open-High-Low-Close).
Indicators: Utilize a wide range of technical indicators, including moving averages, RSI, MACD, Bollinger Bands, and Fibonacci retracements to make informed trading decisions.
Chart Overlays: Compare multiple assets on a single chart for cross-market analysis.
Historical Data: Access price history data for in-depth technical analysis, using historical charts to analyze past price movements.
5. Portfolio Performance Analytics
Our Trading Dashboard includes tools to help you track your portfolio’s performance with precision.
Portfolio Overview: Get a clear picture of your total portfolio value, daily changes, and overall gains or losses.
Diversification Metrics: Check how diversified your portfolio is across different asset classes and make adjustments to minimize risk.
Asset Allocation: Visualize your asset allocation with pie charts or bar graphs, which provide a simple way to evaluate the balance of your investments.
Profit and Loss Statements: Track your investment profits and losses with easy-to-read summaries, helping you gauge the effectiveness of your trading strategies.
6. Risk and Capital Management Tools
Risk management is vital in trading and investing. Our Investment Dashboard includes built-in tools that allow you to assess and manage risk more effectively.
Stop-Loss and Take-Profit Calculators: Set up automated stop-loss and take-profit points based on your risk tolerance, ensuring that you can lock in gains and minimize losses.
Position Sizing: Calculate the optimal position size for each trade based on your risk appetite and account balance.
Risk/Reward Ratio: Calculate and track the potential risk/reward ratio for each trade to determine whether it aligns with your trading strategy.
7. User-Friendly Interface with Dark/Light Mode
The user interface is clean and intuitive, making it easy for users to navigate between various sections without feeling overwhelmed. With both dark and light modes, you can choose the display that suits your visual preference and working environment.
Mobile Responsive: Access your trading dashboard on the go with mobile-responsive layouts, ensuring you stay connected to the markets anytime, anywhere.
Easy Navigation: Quick access to essential tools like price tickers, news feeds, and market charts makes trading less stressful and more efficient.
Benefits of Using the Trading Dashboard
1. Efficiency and Time-Saving
One of the most significant benefits of using our Investment Dashboard is the time it saves. Instead of flipping between multiple websites and applications, all your data and tools are in one place. Whether you’re tracking multiple cryptocurrencies, managing stocks, or monitoring forex markets, the dashboard brings everything into a single, unified view. This level of efficiency is crucial for both full-time traders and those managing portfolios on the side.
2. Informed Decision Making
With real-time data, advanced charts, and portfolio analytics, you can make more informed decisions faster. By having key information at your fingertips, you can respond to market movements promptly and minimize missed opportunities or unnecessary risks.
3. Scalability
As your investment portfolio grows, the need for an adaptable and scalable dashboard becomes essential. Our trading dashboard template is designed to handle large volumes of assets, making it a long-term solution as your trading activity scales up.
Conclusion
In the ever-evolving world of crypto, Bitcoin, and traditional stock market investing, the ability to stay informed and make timely decisions can significantly impact your financial success. Our Investment Dashboard provides a comprehensive, user-friendly, and customizable solution to meet the needs of traders and investors in the crypto and stock markets alike. With real-time data, portfolio analytics, customizable widgets, and advanced technical analysis tools, it’s the ultimate platform for effective asset management.
Don’t let the volatility of the markets overwhelm you. Take control of your investments with our powerful, all-in-one Trading Dashboard today!
 skip to Main Content



This Post Has 0 Comments