Managing wedding events is a beautiful but complex responsibility. Every bride and groom dream of…

Education Software Dashboard – Teaching & Learning Analytics Hub
Reading Time: 6 minutes
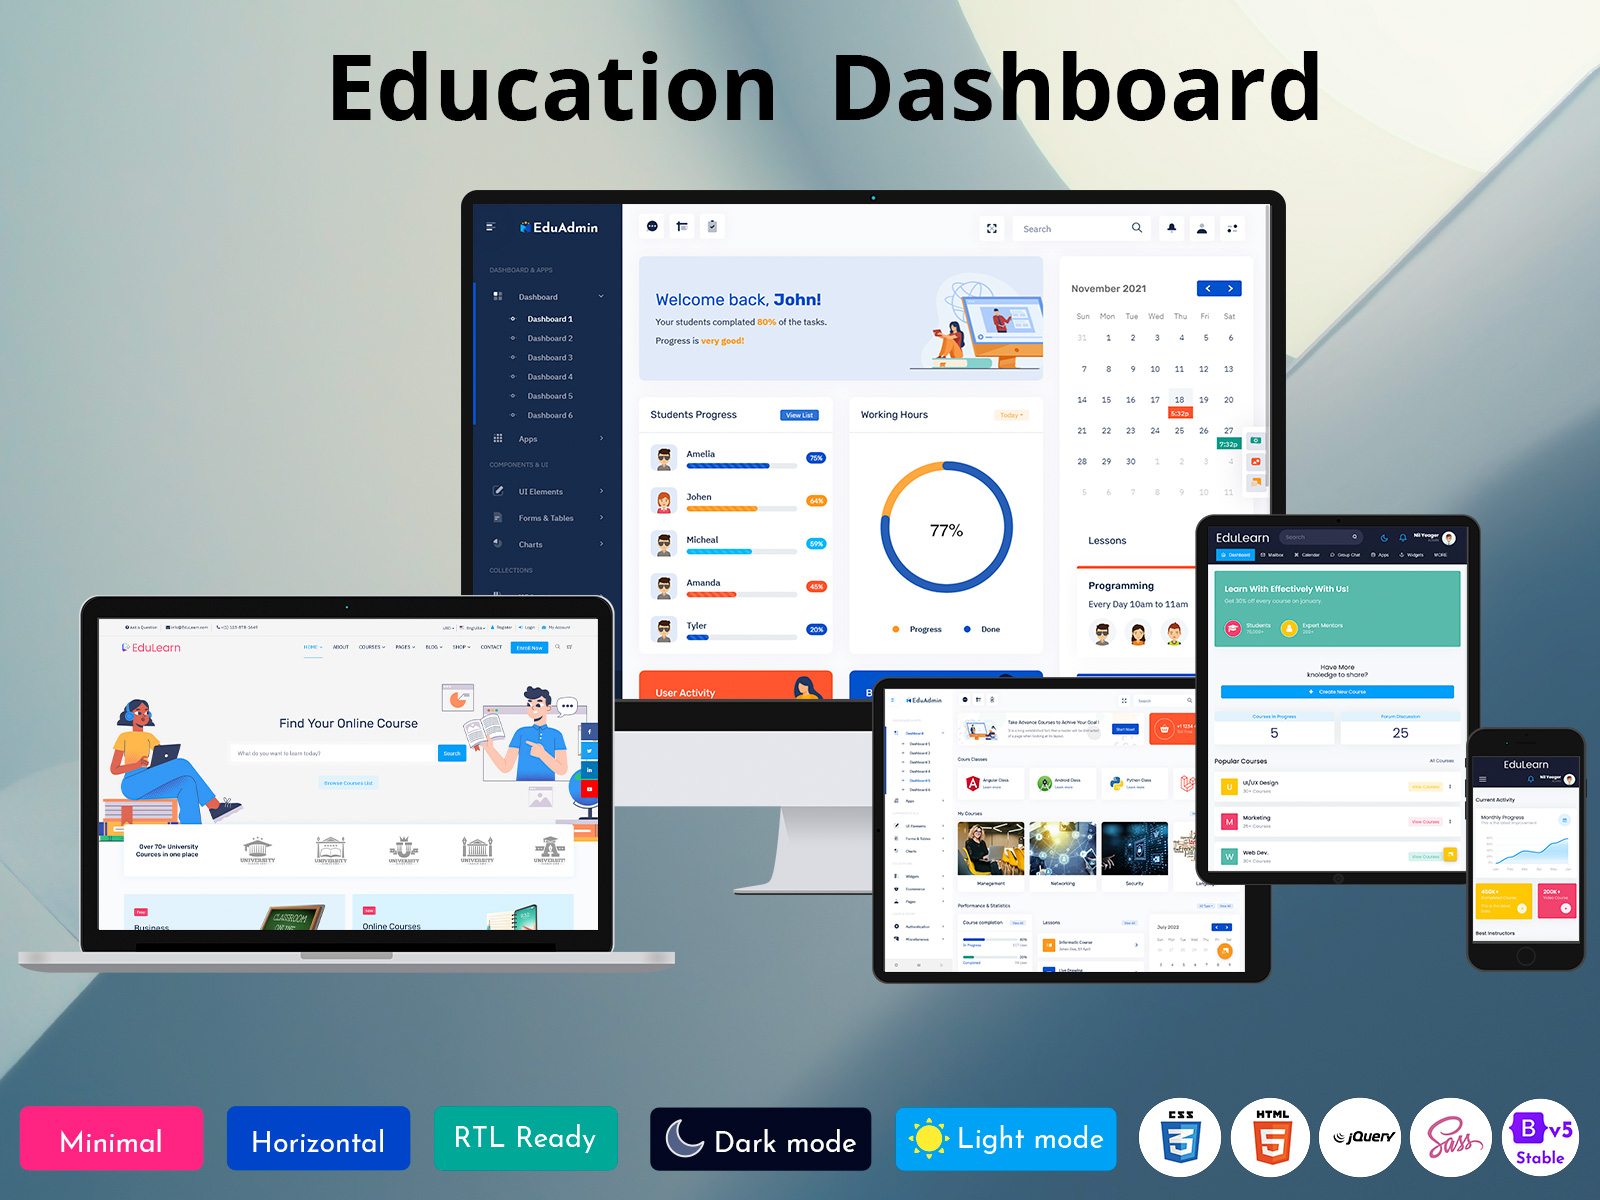
An Education Software Dashboard acts as a blueprint that allows institutions to easily create dashboards tailored to their specific needs. Whether used for academic tracking, institutional management, or student performance analysis, these templates can streamline operations, increase data transparency, and foster a data-driven culture within educational environments.
LTR Style Dashboards of EduAdmin
Dashboard – Light

MORE INFO / BUY NOW DEMO
Dashboard – Dark

MORE INFO / BUY NOW DEMO
Dashboard – Light

MORE INFO / BUY NOW DEMO
Dashboard – Dark

MORE INFO / BUY NOW DEMO
Dashboard – Light

MORE INFO / BUY NOW DEMO
Dashboard – Dark

MORE INFO / BUY NOW DEMO
Dashboard – Light

MORE INFO / BUY NOW DEMO
Dashboard – Dark

MORE INFO / BUY NOW DEMO
New Dashboard – Light
MORE INFO / BUY NOW DEMO
Key Components of an Education Dashboard Template
- Data Integration Capabilities The primary function of an education dashboard is to aggregate and display data from various sources. A well-designed Online Classes Dashboard should be able to integrate with different learning management systems (LMS), student information systems (SIS), and even external applications. This allows users to pull real-time data and view up-to-date performance metrics without manually compiling information from disparate sources.For instance, a Education Software Dashboard may integrate data from a learning management system to display grades, attendance records, and assignment submission statistics. Additionally, it may pull data from a student information system to track enrollment figures, demographic information, and student progress.
- Customizable Visual Layouts A good education dashboard template offers a high degree of customization. Dashboards are often filled with a variety of visual elements such as charts, graphs, heat maps, and tables. These elements can be configured based on the user’s preferences, allowing institutions to present data in a way that aligns with their goals. For example, a template might include:
- Bar charts for comparing student performance across different subjects or cohorts.
- Line graphs to track progress over time.
- Pie charts to represent class attendance percentages or grade distributions.
- Heat maps to highlight areas where students are excelling or struggling.
Customization options in terms of layout ensure that users can prioritize the most important metrics, whether it’s student grades, graduation rates, or resource allocation.
- Real-Time Data Visualization The ability to visualize data in real time is one of the main reasons educational institutions adopt dashboards. A well-built template ensures that data updates automatically, allowing decision-makers to act on the most current information. This is particularly useful for monitoring student performance, detecting at-risk students early, and adjusting instructional strategies as needed.In a typical academic dashboard, you may have real-time updates on attendance rates, assignment submission rates, and exam scores. If the Education Software Dashboard is linked with performance-tracking tools, instructors can instantly see when a student’s grades are slipping or when a class is showing signs of disengagement. This immediacy allows for timely interventions.
- Key Performance Indicators (KPIs) Key performance indicators (KPIs) are metrics that offer insights into the effectiveness of educational strategies. For administrators, KPIs can include metrics like:
- Graduation rates: To track the success of retention and completion programs.
- Enrollment figures: To gauge institutional growth or identify potential areas of concern.
- Student satisfaction surveys: To assess how students feel about their learning experience.
- Instructor performance: Based on student feedback, engagement, and exam results.
A Online Classes Dashboard should provide a quick overview of these KPIs, often using color-coding or alerts to indicate areas that need attention. These data points help guide policy decisions and optimize resource allocation.
- User Access Control and Security Given the sensitive nature of student data, dashboards need to be designed with robust security features. The template should allow for user access control, ensuring that different stakeholders (such as administrators, teachers, and students) only have access to the information they are authorized to view.For example:
- Teachers might have access to data specific to their classes, including individual student performance metrics and attendance.
- Administrators may need a broader view that includes institutional-level data such as enrollment numbers, resource usage, and overall student performance.
- Students should have access to their own performance metrics and feedback, but not to the detailed information of other students.
- Interactive Features Beyond simple visualizations, a good education Education Software Dashboard includes interactive features that allow users to drill down into the data for deeper analysis. For instance, users might be able to click on a bar chart representing a student’s grades and then view detailed reports on individual assignments, course materials, and instructor feedback.Interactive features make dashboards more than just static reports—they turn them into powerful analytical tools that help users identify patterns, trends, and areas for improvement. This functionality also encourages user engagement, as stakeholders can explore data on their own terms.
- Mobile-Friendly Design In today’s fast-paced world, it is important for education dashboards to be accessible on mobile devices. An education dashboard template that is mobile-friendly ensures that users can access important data on the go, whether they are in a classroom, a meeting, or at home.Mobile responsiveness is particularly valuable for busy teachers and administrators who may need to check on student performance, attendance, or institutional KPIs while away from their desks. For example, an administrator might receive an alert about a drop in attendance rates and immediately access the dashboard to investigate the issue.
- Collaboration Tools Collaboration is an essential aspect of education, and a good Online Classes Dashboard fosters collaboration by allowing multiple users to share insights and communicate within the platform. Administrators, teachers, and other staff members can leave comments, set reminders, or tag colleagues in specific data points.For example, a teacher might notice a concerning trend in the performance of a particular group of students and can tag a colleague or school counselor in the dashboard to initiate a conversation about potential interventions. Collaboration features like these help ensure that action is taken quickly and efficiently.
Benefits of Using an Education Dashboard Template
- Enhanced Decision Making By providing a clear, consolidated view of key data, education dashboards enable better-informed decisions. Administrators can assess trends in real-time, allowing for quicker responses to emerging issues, such as declining student engagement or lagging academic performance.
- Increased Efficiency With a centralized dashboard that aggregates data from various systems, educational institutions can save time that would otherwise be spent manually gathering and analyzing information. Automated data feeds and real-time updates streamline workflows and eliminate redundancies.
- Personalized Learning Dashboards can be used to track student progress at an individual level, helping educators identify students who may need extra support. This fosters a personalized learning environment where teachers can tailor interventions to meet the specific needs of each student.
- Improved Student Outcomes By monitoring performance metrics regularly, educators and administrators can quickly identify at-risk students and implement early intervention strategies. This proactive approach can significantly improve student outcomes, reducing dropout rates and improving graduation rates.
- Increased Transparency Dashboards help increase transparency by making important data accessible to all stakeholders, including students, parents, and faculty. This fosters trust and accountability, ensuring that all parties are informed about the progress and challenges of the educational institution.
Conclusion
An Education Software Dashboard is a powerful tool that can transform how educational institutions manage and utilize data. By offering real-time insights, customizable layouts, and integration capabilities, it helps administrators, teachers, and students track performance, identify areas for improvement, and make data-driven decisions. With its ability to streamline processes, enhance collaboration, and improve student outcomes, the education dashboard is fast becoming an indispensable tool in the modern educational landscape.
 skip to Main Content


This Post Has 0 Comments